Zip Codes with the Highest Percentage of Households with Income Below $10,000 in Davenport, IA
RELATED REPORTS & OPTIONS
Household Income | $0-10k
Davenport
Compare Zip Codes
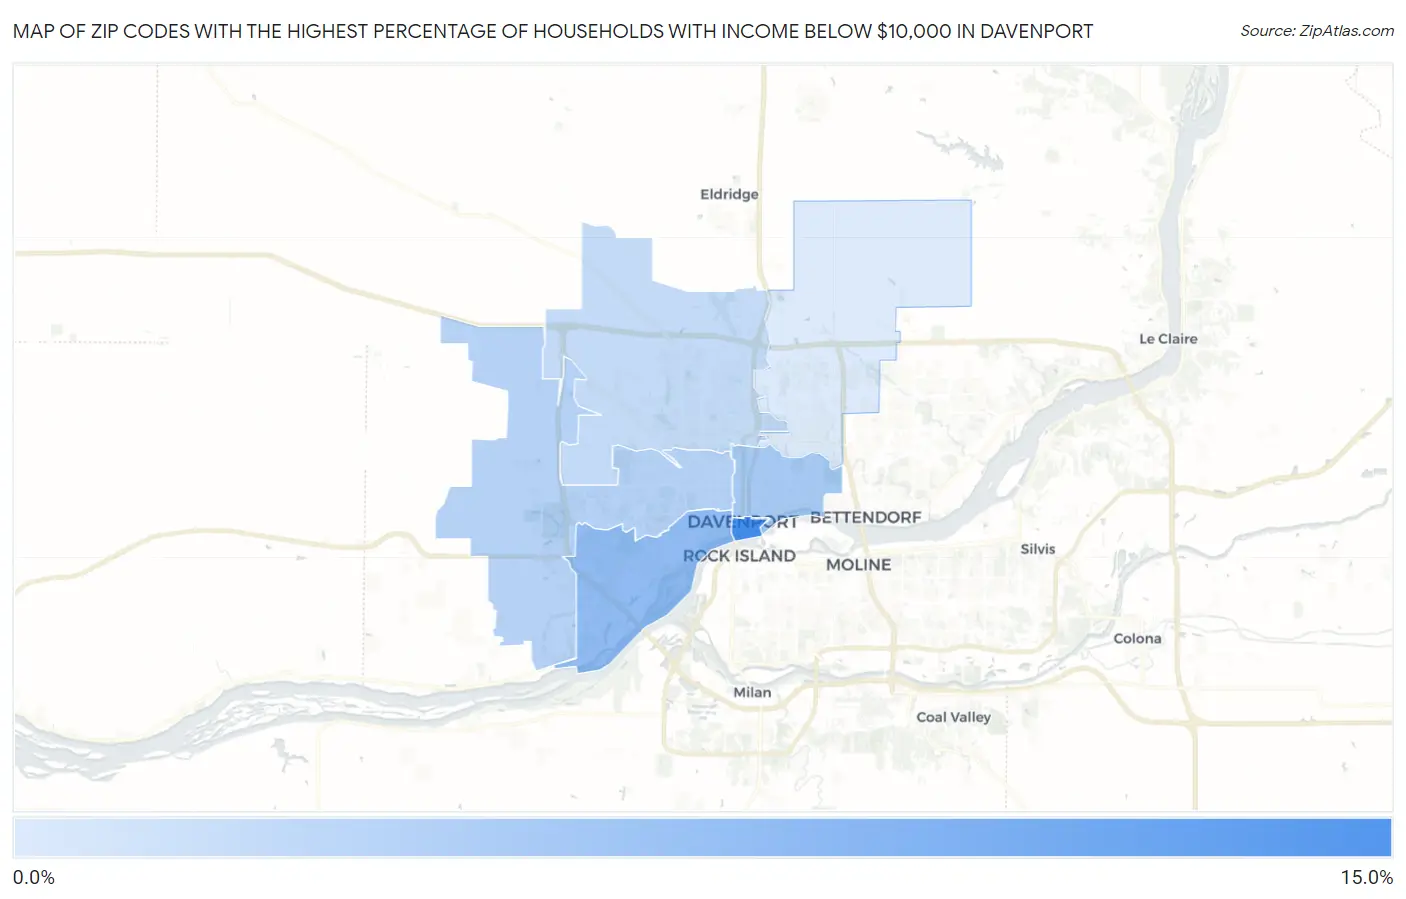
Map of Zip Codes with the Highest Percentage of Households with Income Below $10,000 in Davenport
3.6%
13.6%
Zip Codes with the Highest Percentage of Households with Income Below $10,000 in Davenport, IA
| Zip Code | Households with Income < $10k | vs State | vs National | |
| 1. | 52801 | 13.6% | 4.2%(+9.40)#35 | 4.9%(+8.70)#1,892 |
| 2. | 52802 | 8.5% | 4.2%(+4.30)#88 | 4.9%(+3.60)#4,944 |
| 3. | 52803 | 7.1% | 4.2%(+2.90)#118 | 4.9%(+2.20)#6,798 |
| 4. | 52804 | 6.2% | 4.2%(+2.00)#163 | 4.9%(+1.30)#8,544 |
| 5. | 52806 | 5.2% | 4.2%(+1.00)#217 | 4.9%(+0.300)#11,075 |
| 6. | 52807 | 3.6% | 4.2%(-0.600)#354 | 4.9%(-1.30)#16,899 |
1
Common Questions
What are the Top 5 Zip Codes with the Highest Percentage of Households with Income Below $10,000 in Davenport, IA?
Top 5 Zip Codes with the Highest Percentage of Households with Income Below $10,000 in Davenport, IA are:
What zip code has the Highest Percentage of Households with Income Below $10,000 in Davenport, IA?
52801 has the Highest Percentage of Households with Income Below $10,000 in Davenport, IA with 13.6%.
What is the Percentage of Households with Income Below $10,000 in Davenport, IA?
Percentage of Households with Income Below $10,000 in Davenport is 6.2%.
What is the Percentage of Households with Income Below $10,000 in Iowa?
Percentage of Households with Income Below $10,000 in Iowa is 4.2%.
What is the Percentage of Households with Income Below $10,000 in the United States?
Percentage of Households with Income Below $10,000 in the United States is 4.9%.