Britt, IA Map & Demographics
Britt Map
Britt Overview
$31,410
PER CAPITA INCOME
$70,417
AVG FAMILY INCOME
$59,805
AVG HOUSEHOLD INCOME
30.3%
WAGE / INCOME GAP [ % ]
69.7¢/ $1
WAGE / INCOME GAP [ $ ]
0.42
INEQUALITY / GINI INDEX
1,921
TOTAL POPULATION
933
MALE POPULATION
988
FEMALE POPULATION
94.43
MALES / 100 FEMALES
105.89
FEMALES / 100 MALES
45.3
MEDIAN AGE
2.7
AVG FAMILY SIZE
2.2
AVG HOUSEHOLD SIZE
925
LABOR FORCE [ PEOPLE ]
57.8%
PERCENT IN LABOR FORCE
3.5%
UNEMPLOYMENT RATE
Britt Zip Codes
Britt Area Codes
Income in Britt
Income Overview in Britt
Per Capita Income in Britt is $31,410, while median incomes of families and households are $70,417 and $59,805 respectively.
| Characteristic | Number | Measure |
| Per Capita Income | 1,921 | $31,410 |
| Median Family Income | 529 | $70,417 |
| Mean Family Income | 529 | $83,469 |
| Median Household Income | 831 | $59,805 |
| Mean Household Income | 831 | $71,325 |
| Income Deficit | 529 | $0 |
| Wage / Income Gap (%) | 1,921 | 30.33% |
| Wage / Income Gap ($) | 1,921 | 69.67¢ per $1 |
| Gini / Inequality Index | 1,921 | 0.42 |
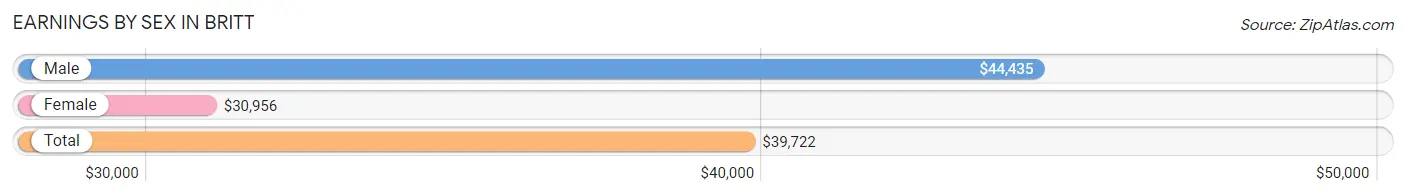
Earnings by Sex in Britt
Average Earnings in Britt are $39,722, $44,435 for men and $30,956 for women, a difference of 30.3%.
| Sex | Number | Average Earnings |
| Male | 539 (55.8%) | $44,435 |
| Female | 427 (44.2%) | $30,956 |
| Total | 966 (100.0%) | $39,722 |
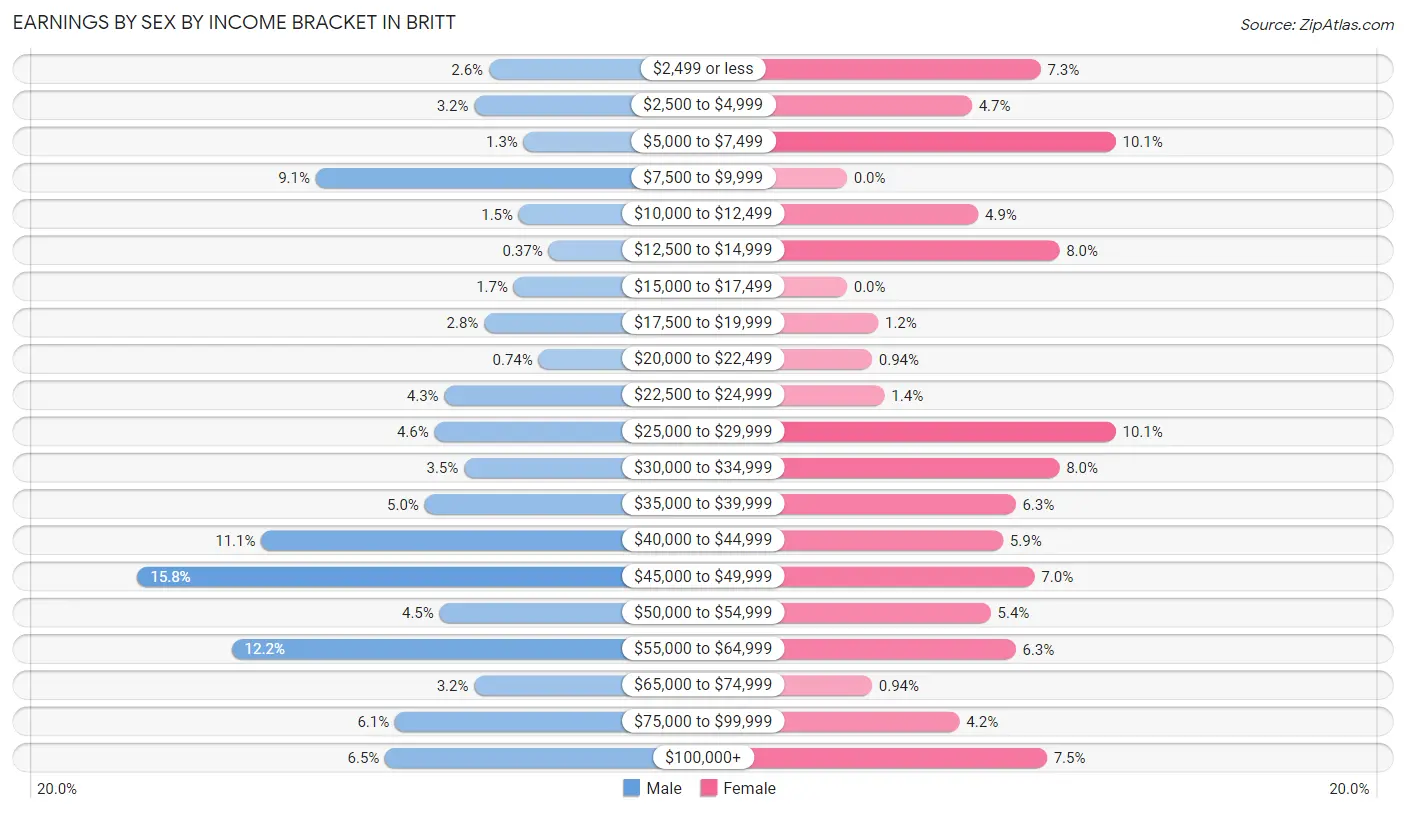
Earnings by Sex by Income Bracket in Britt
The most common earnings brackets in Britt are $45,000 to $49,999 for men (85 | 15.8%) and $5,000 to $7,499 for women (43 | 10.1%).
| Income | Male | Female |
| $2,499 or less | 14 (2.6%) | 31 (7.3%) |
| $2,500 to $4,999 | 17 (3.2%) | 20 (4.7%) |
| $5,000 to $7,499 | 7 (1.3%) | 43 (10.1%) |
| $7,500 to $9,999 | 49 (9.1%) | 0 (0.0%) |
| $10,000 to $12,499 | 8 (1.5%) | 21 (4.9%) |
| $12,500 to $14,999 | 2 (0.4%) | 34 (8.0%) |
| $15,000 to $17,499 | 9 (1.7%) | 0 (0.0%) |
| $17,500 to $19,999 | 15 (2.8%) | 5 (1.2%) |
| $20,000 to $22,499 | 4 (0.7%) | 4 (0.9%) |
| $22,500 to $24,999 | 23 (4.3%) | 6 (1.4%) |
| $25,000 to $29,999 | 25 (4.6%) | 43 (10.1%) |
| $30,000 to $34,999 | 19 (3.5%) | 34 (8.0%) |
| $35,000 to $39,999 | 27 (5.0%) | 27 (6.3%) |
| $40,000 to $44,999 | 60 (11.1%) | 25 (5.9%) |
| $45,000 to $49,999 | 85 (15.8%) | 30 (7.0%) |
| $50,000 to $54,999 | 24 (4.4%) | 23 (5.4%) |
| $55,000 to $64,999 | 66 (12.2%) | 27 (6.3%) |
| $65,000 to $74,999 | 17 (3.2%) | 4 (0.9%) |
| $75,000 to $99,999 | 33 (6.1%) | 18 (4.2%) |
| $100,000+ | 35 (6.5%) | 32 (7.5%) |
| Total | 539 (100.0%) | 427 (100.0%) |
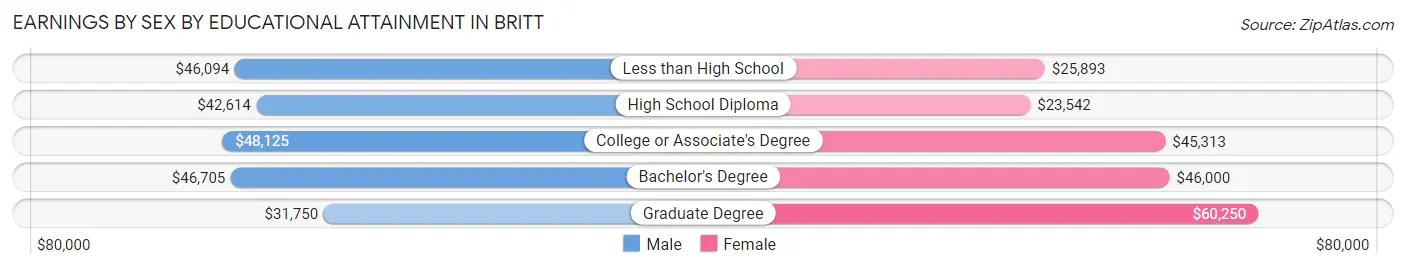
Earnings by Sex by Educational Attainment in Britt
Average earnings in Britt are $46,054 for men and $36,477 for women, a difference of 20.8%. Men with an educational attainment of college or associate's degree enjoy the highest average annual earnings of $48,125, while those with graduate degree education earn the least with $31,750. Women with an educational attainment of graduate degree earn the most with the average annual earnings of $60,250, while those with high school diploma education have the smallest earnings of $23,542.
| Educational Attainment | Male Income | Female Income |
| Less than High School | $46,094 | $25,893 |
| High School Diploma | $42,614 | $23,542 |
| College or Associate's Degree | $48,125 | $45,313 |
| Bachelor's Degree | $46,705 | $46,000 |
| Graduate Degree | $31,750 | $60,250 |
| Total | $46,054 | $36,477 |
Family Income in Britt
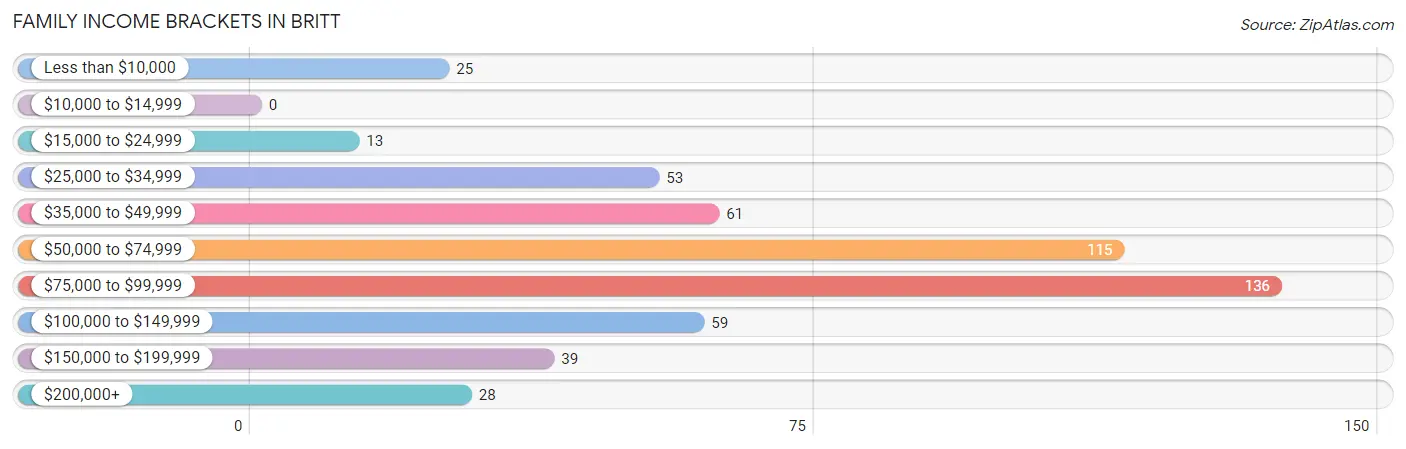
Family Income Brackets in Britt
According to the Britt family income data, there are 136 families falling into the $75,000 to $99,999 income range, which is the most common income bracket and makes up 25.7% of all families.
| Income Bracket | # Families | % Families |
| Less than $10,000 | 25 | 4.7% |
| $10,000 to $14,999 | 0 | 0.0% |
| $15,000 to $24,999 | 13 | 2.5% |
| $25,000 to $34,999 | 53 | 10.0% |
| $35,000 to $49,999 | 61 | 11.5% |
| $50,000 to $74,999 | 115 | 21.7% |
| $75,000 to $99,999 | 136 | 25.7% |
| $100,000 to $149,999 | 59 | 11.2% |
| $150,000 to $199,999 | 39 | 7.4% |
| $200,000+ | 28 | 5.3% |
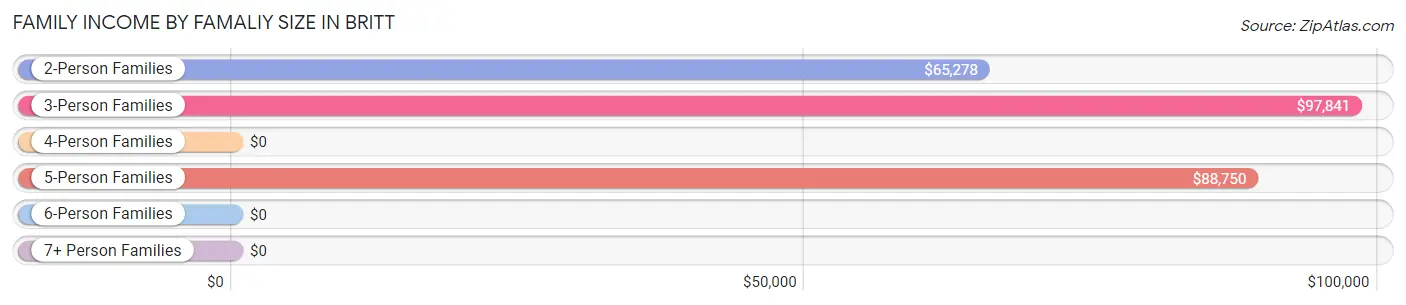
Family Income by Famaliy Size in Britt
3-person families (83 | 15.7%) account for the highest median family income in Britt with $97,841 per family, while 2-person families (342 | 64.6%) have the highest median income of $32,639 per family member.
| Income Bracket | # Families | Median Income |
| 2-Person Families | 342 (64.6%) | $65,278 |
| 3-Person Families | 83 (15.7%) | $97,841 |
| 4-Person Families | 54 (10.2%) | $0 |
| 5-Person Families | 47 (8.9%) | $88,750 |
| 6-Person Families | 0 (0.0%) | $0 |
| 7+ Person Families | 3 (0.6%) | $0 |
| Total | 529 (100.0%) | $70,417 |
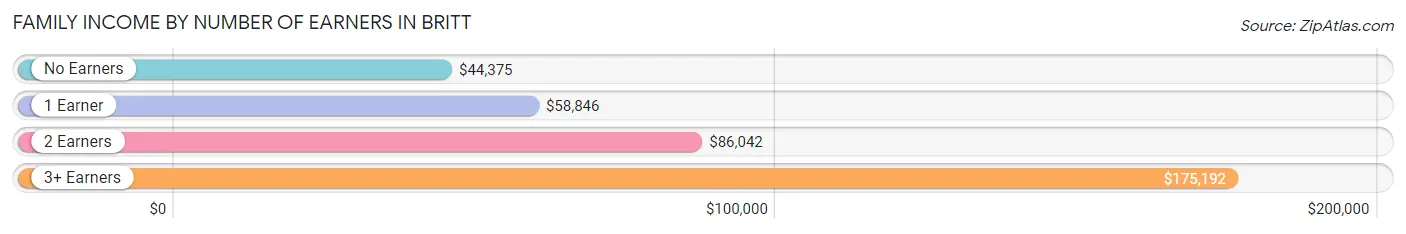
Family Income by Number of Earners in Britt
The median family income in Britt is $70,417, with families comprising 3+ earners (40) having the highest median family income of $175,192, while families with no earners (131) have the lowest median family income of $44,375, accounting for 7.6% and 24.8% of families, respectively.
| Number of Earners | # Families | Median Income |
| No Earners | 131 (24.8%) | $44,375 |
| 1 Earner | 100 (18.9%) | $58,846 |
| 2 Earners | 258 (48.8%) | $86,042 |
| 3+ Earners | 40 (7.6%) | $175,192 |
| Total | 529 (100.0%) | $70,417 |
Household Income in Britt
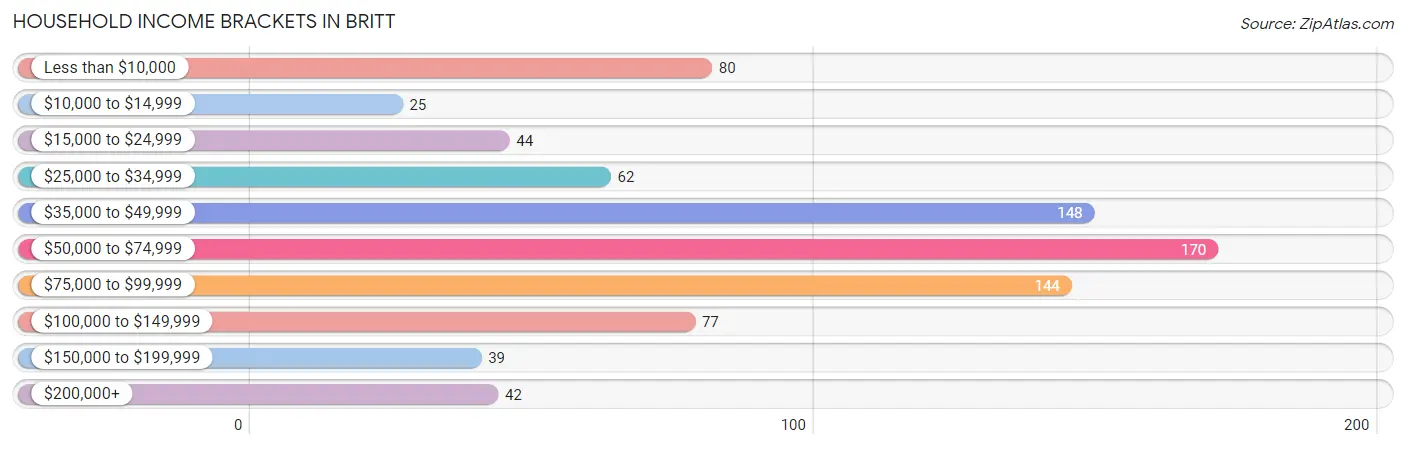
Household Income Brackets in Britt
With 170 households falling in the category, the $50,000 to $74,999 income range is the most frequent in Britt, accounting for 20.5% of all households. In contrast, only 25 households (3.0%) fall into the $10,000 to $14,999 income bracket, making it the least populous group.
| Income Bracket | # Households | % Households |
| Less than $10,000 | 80 | 9.6% |
| $10,000 to $14,999 | 25 | 3.0% |
| $15,000 to $24,999 | 44 | 5.3% |
| $25,000 to $34,999 | 62 | 7.5% |
| $35,000 to $49,999 | 148 | 17.8% |
| $50,000 to $74,999 | 170 | 20.5% |
| $75,000 to $99,999 | 144 | 17.3% |
| $100,000 to $149,999 | 77 | 9.3% |
| $150,000 to $199,999 | 39 | 4.7% |
| $200,000+ | 42 | 5.1% |
Household Income by Householder Age in Britt
The median household income in Britt is $59,805, with the highest median household income of $83,750 found in the 45 to 64 years age bracket for the primary householder. A total of 240 households (28.9%) fall into this category. Meanwhile, the 15 to 24 years age bracket for the primary householder has the lowest median household income of $0, with 52 households (6.3%) in this group.
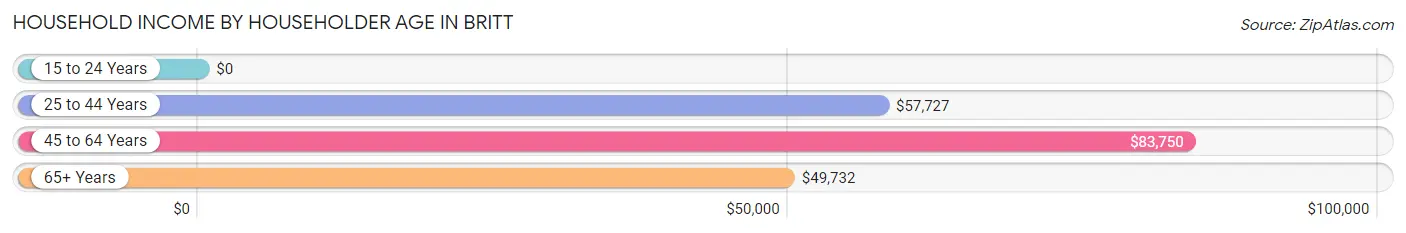
| Income Bracket | # Households | Median Income |
| 15 to 24 Years | 52 (6.3%) | $0 |
| 25 to 44 Years | 234 (28.2%) | $57,727 |
| 45 to 64 Years | 240 (28.9%) | $83,750 |
| 65+ Years | 305 (36.7%) | $49,732 |
| Total | 831 (100.0%) | $59,805 |
Poverty in Britt
Income Below Poverty by Sex and Age in Britt
With 10.8% poverty level for males and 15.2% for females among the residents of Britt, 6 to 11 year old males and 18 to 24 year old females are the most vulnerable to poverty, with 23 males (74.2%) and 58 females (76.3%) in their respective age groups living below the poverty level.
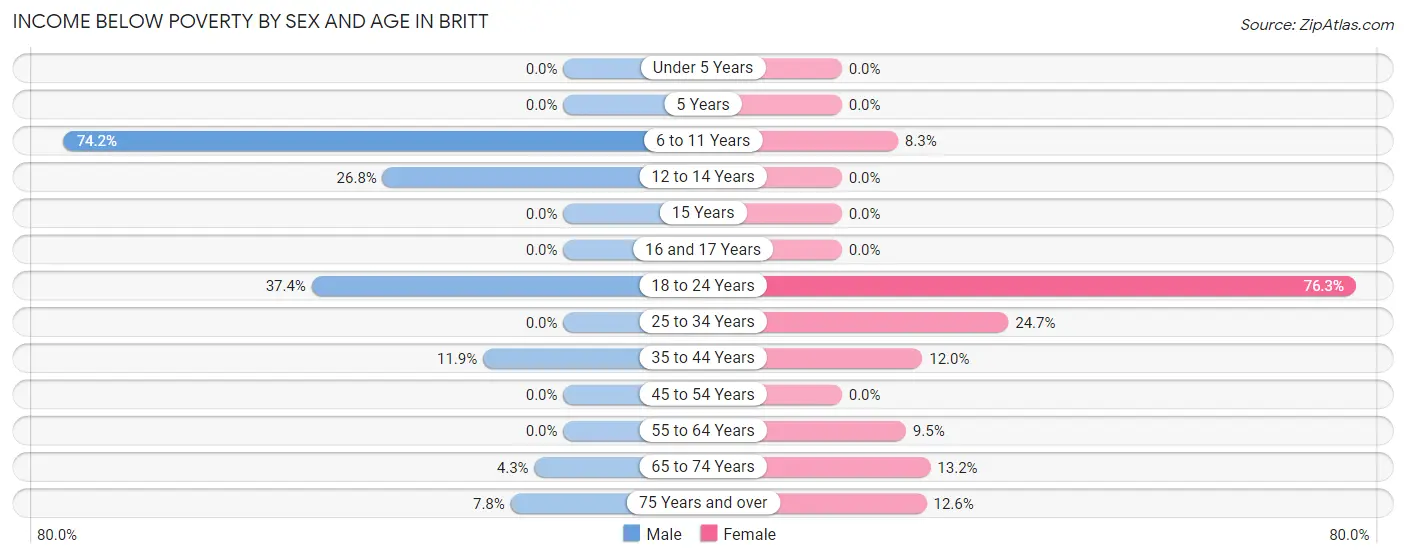
| Age Bracket | Male | Female |
| Under 5 Years | 0 (0.0%) | 0 (0.0%) |
| 5 Years | 0 (0.0%) | 0 (0.0%) |
| 6 to 11 Years | 23 (74.2%) | 7 (8.3%) |
| 12 to 14 Years | 11 (26.8%) | 0 (0.0%) |
| 15 Years | 0 (0.0%) | 0 (0.0%) |
| 16 and 17 Years | 0 (0.0%) | 0 (0.0%) |
| 18 to 24 Years | 37 (37.4%) | 58 (76.3%) |
| 25 to 34 Years | 0 (0.0%) | 22 (24.7%) |
| 35 to 44 Years | 13 (11.9%) | 11 (12.0%) |
| 45 to 54 Years | 0 (0.0%) | 0 (0.0%) |
| 55 to 64 Years | 0 (0.0%) | 8 (9.5%) |
| 65 to 74 Years | 3 (4.3%) | 15 (13.2%) |
| 75 Years and over | 9 (7.8%) | 20 (12.6%) |
| Total | 96 (10.8%) | 141 (15.2%) |
Income Above Poverty by Sex and Age in Britt
According to the poverty statistics in Britt, males aged under 5 years and females aged under 5 years are the age groups that are most secure financially, with 100.0% of males and 100.0% of females in these age groups living above the poverty line.
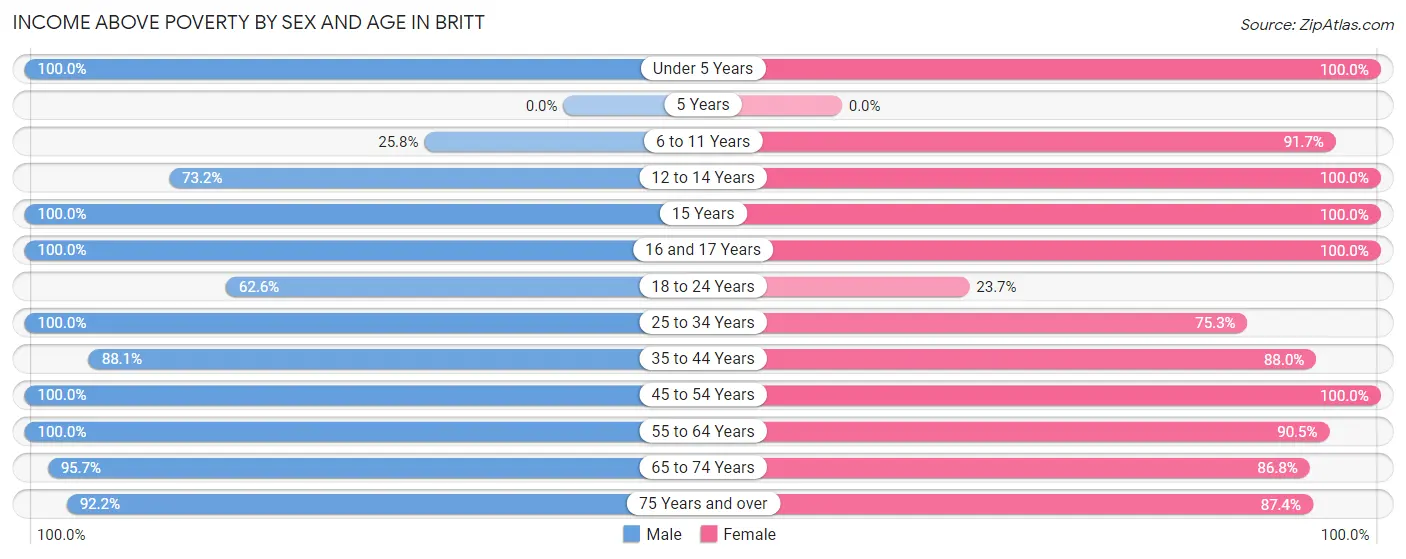
| Age Bracket | Male | Female |
| Under 5 Years | 48 (100.0%) | 33 (100.0%) |
| 5 Years | 0 (0.0%) | 0 (0.0%) |
| 6 to 11 Years | 8 (25.8%) | 77 (91.7%) |
| 12 to 14 Years | 30 (73.2%) | 42 (100.0%) |
| 15 Years | 7 (100.0%) | 35 (100.0%) |
| 16 and 17 Years | 22 (100.0%) | 39 (100.0%) |
| 18 to 24 Years | 62 (62.6%) | 18 (23.7%) |
| 25 to 34 Years | 102 (100.0%) | 67 (75.3%) |
| 35 to 44 Years | 96 (88.1%) | 81 (88.0%) |
| 45 to 54 Years | 111 (100.0%) | 81 (100.0%) |
| 55 to 64 Years | 130 (100.0%) | 76 (90.5%) |
| 65 to 74 Years | 67 (95.7%) | 99 (86.8%) |
| 75 Years and over | 106 (92.2%) | 139 (87.4%) |
| Total | 789 (89.1%) | 787 (84.8%) |
Income Below Poverty Among Married-Couple Families in Britt
The poverty statistics for married-couple families in Britt show that 0.7% or 3 of the total 418 families live below the poverty line. Families with no children have the highest poverty rate of 1.1%, comprising of 3 families. On the other hand, families with 1 or 2 children have the lowest poverty rate of 0.0%, which includes 0 families.
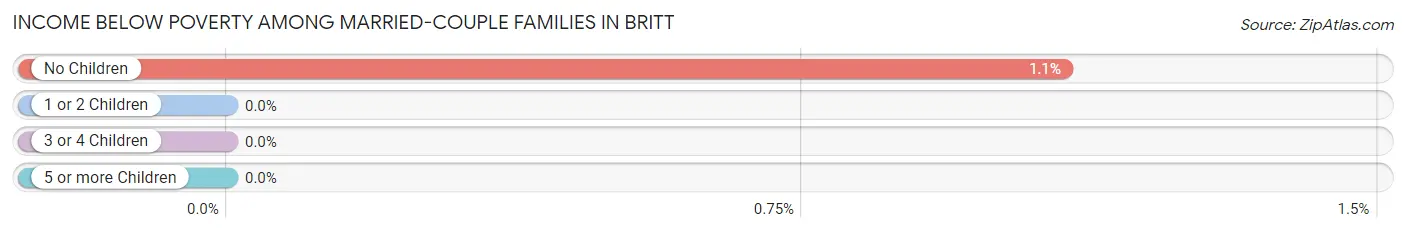
| Children | Above Poverty | Below Poverty |
| No Children | 271 (98.9%) | 3 (1.1%) |
| 1 or 2 Children | 115 (100.0%) | 0 (0.0%) |
| 3 or 4 Children | 29 (100.0%) | 0 (0.0%) |
| 5 or more Children | 0 (0.0%) | 0 (0.0%) |
| Total | 415 (99.3%) | 3 (0.7%) |
Income Below Poverty Among Single-Parent Households in Britt
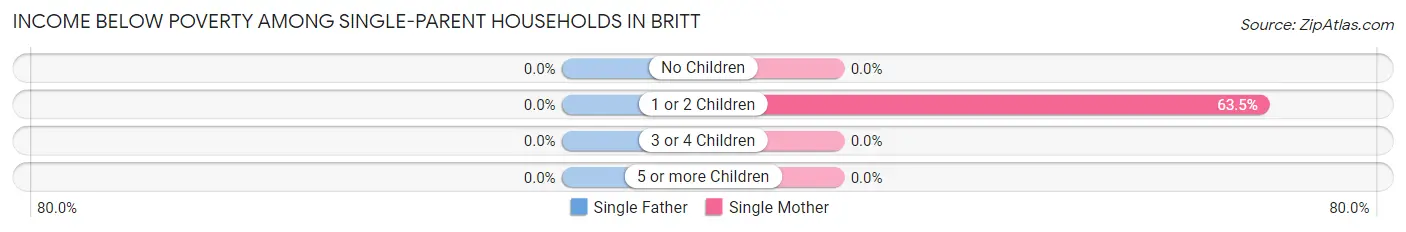
| Children | Single Father | Single Mother |
| No Children | 0 (0.0%) | 0 (0.0%) |
| 1 or 2 Children | 0 (0.0%) | 33 (63.5%) |
| 3 or 4 Children | 0 (0.0%) | 0 (0.0%) |
| 5 or more Children | 0 (0.0%) | 0 (0.0%) |
| Total | 0 (0.0%) | 33 (50.0%) |
Income Below Poverty Among Married-Couple vs Single-Parent Households in Britt
The poverty data for Britt shows that 3 of the married-couple family households (0.7%) and 33 of the single-parent households (29.7%) are living below the poverty level. Within the married-couple family households, those with no children have the highest poverty rate, with 3 households (1.1%) falling below the poverty line. Among the single-parent households, those with 1 or 2 children have the highest poverty rate, with 33 household (43.4%) living below poverty.
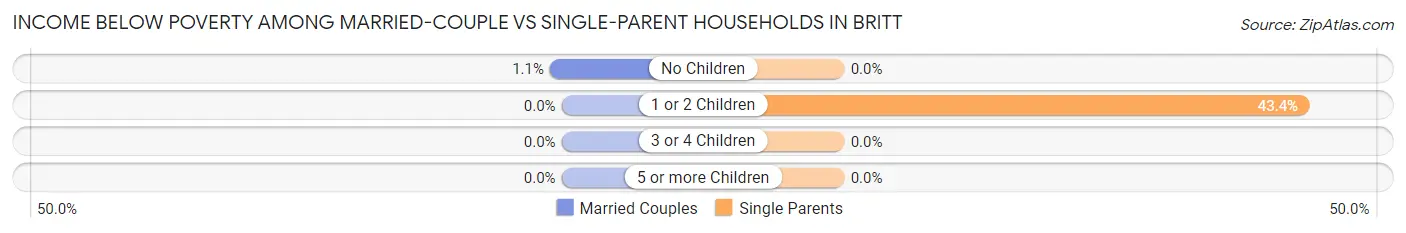
| Children | Married-Couple Families | Single-Parent Households |
| No Children | 3 (1.1%) | 0 (0.0%) |
| 1 or 2 Children | 0 (0.0%) | 33 (43.4%) |
| 3 or 4 Children | 0 (0.0%) | 0 (0.0%) |
| 5 or more Children | 0 (0.0%) | 0 (0.0%) |
| Total | 3 (0.7%) | 33 (29.7%) |
Race in Britt
The most populous races in Britt are White / Caucasian (1,848 | 96.2%), Hispanic or Latino (161 | 8.4%), and Some other Race (29 | 1.5%).
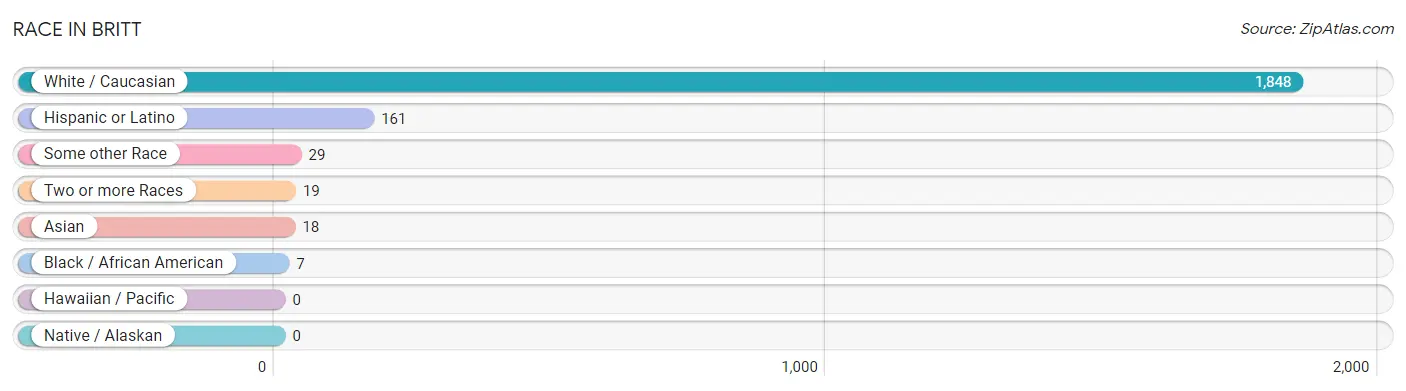
| Race | # Population | % Population |
| Asian | 18 | 0.9% |
| Black / African American | 7 | 0.4% |
| Hawaiian / Pacific | 0 | 0.0% |
| Hispanic or Latino | 161 | 8.4% |
| Native / Alaskan | 0 | 0.0% |
| White / Caucasian | 1,848 | 96.2% |
| Two or more Races | 19 | 1.0% |
| Some other Race | 29 | 1.5% |
| Total | 1,921 | 100.0% |
Ancestry in Britt
The most populous ancestries reported in Britt are German (638 | 33.2%), Norwegian (178 | 9.3%), Mexican (161 | 8.4%), Irish (140 | 7.3%), and English (119 | 6.2%), together accounting for 64.3% of all Britt residents.
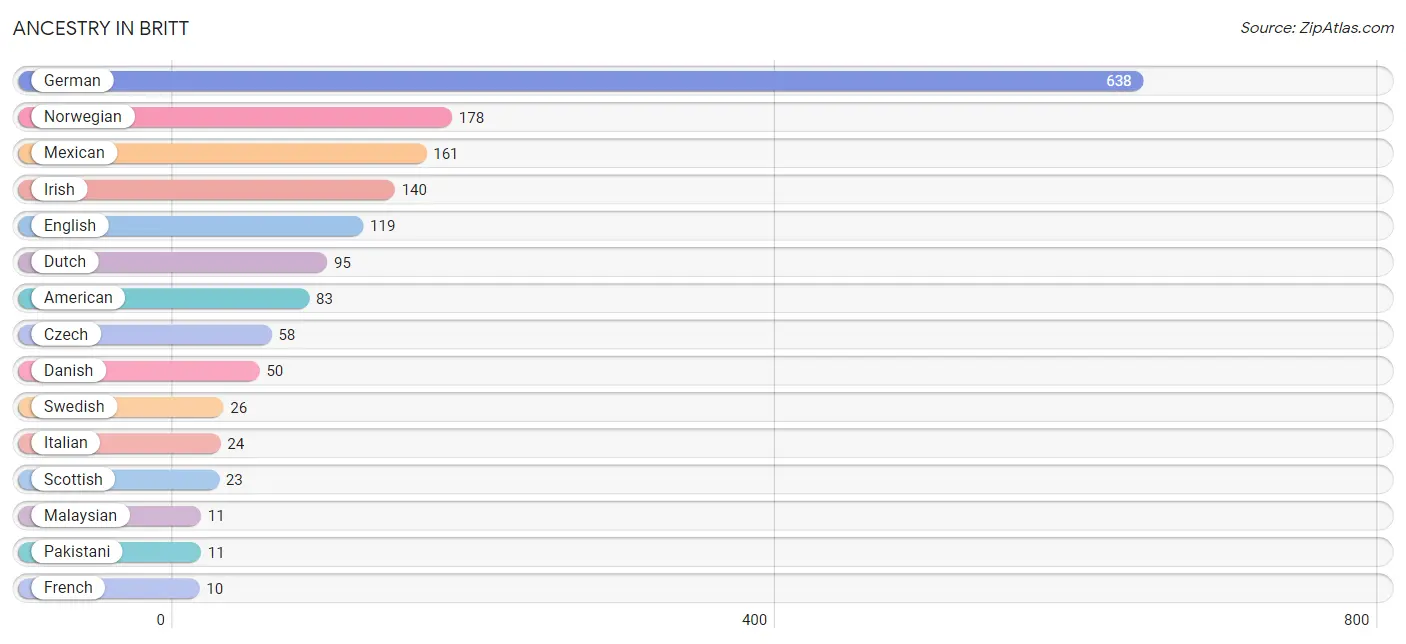
| Ancestry | # Population | % Population |
| African | 7 | 0.4% |
| American | 83 | 4.3% |
| Belgian | 8 | 0.4% |
| Czech | 58 | 3.0% |
| Danish | 50 | 2.6% |
| Dutch | 95 | 5.0% |
| English | 119 | 6.2% |
| French | 10 | 0.5% |
| French Canadian | 4 | 0.2% |
| German | 638 | 33.2% |
| Irish | 140 | 7.3% |
| Italian | 24 | 1.3% |
| Latvian | 5 | 0.3% |
| Malaysian | 11 | 0.6% |
| Mexican | 161 | 8.4% |
| Norwegian | 178 | 9.3% |
| Pakistani | 11 | 0.6% |
| Polish | 2 | 0.1% |
| Scandinavian | 2 | 0.1% |
| Scottish | 23 | 1.2% |
| Subsaharan African | 7 | 0.4% |
| Swedish | 26 | 1.3% |
| Swiss | 4 | 0.2% | View All 23 Rows |
Immigrants in Britt
The most numerous immigrant groups reported in Britt came from Central America (25 | 1.3%), Latin America (25 | 1.3%), Mexico (24 | 1.3%), Asia (19 | 1.0%), and Laos (14 | 0.7%), together accounting for 5.6% of all Britt residents.
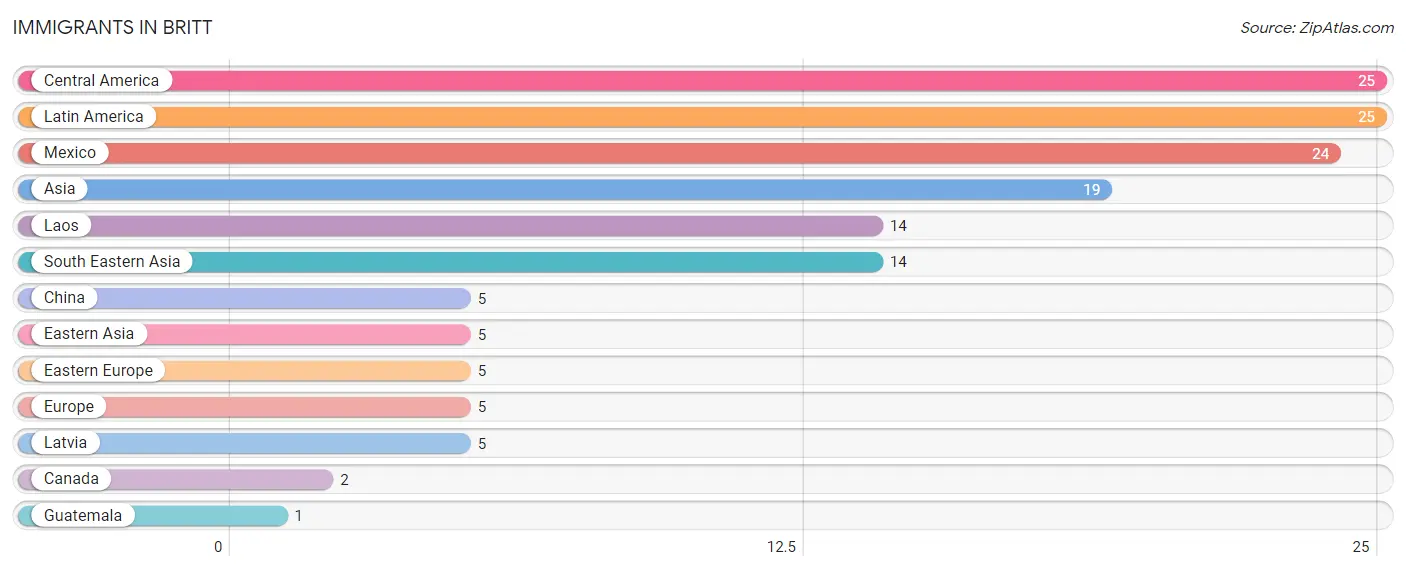
| Immigration Origin | # Population | % Population |
| Asia | 19 | 1.0% |
| Canada | 2 | 0.1% |
| Central America | 25 | 1.3% |
| China | 5 | 0.3% |
| Eastern Asia | 5 | 0.3% |
| Eastern Europe | 5 | 0.3% |
| Europe | 5 | 0.3% |
| Guatemala | 1 | 0.1% |
| Laos | 14 | 0.7% |
| Latin America | 25 | 1.3% |
| Latvia | 5 | 0.3% |
| Mexico | 24 | 1.3% |
| South Eastern Asia | 14 | 0.7% | View All 13 Rows |
Sex and Age in Britt
Sex and Age in Britt
The most populous age groups in Britt are 45 to 49 Years (87 | 9.3%) for men and 85 Years and over (106 | 10.7%) for women.
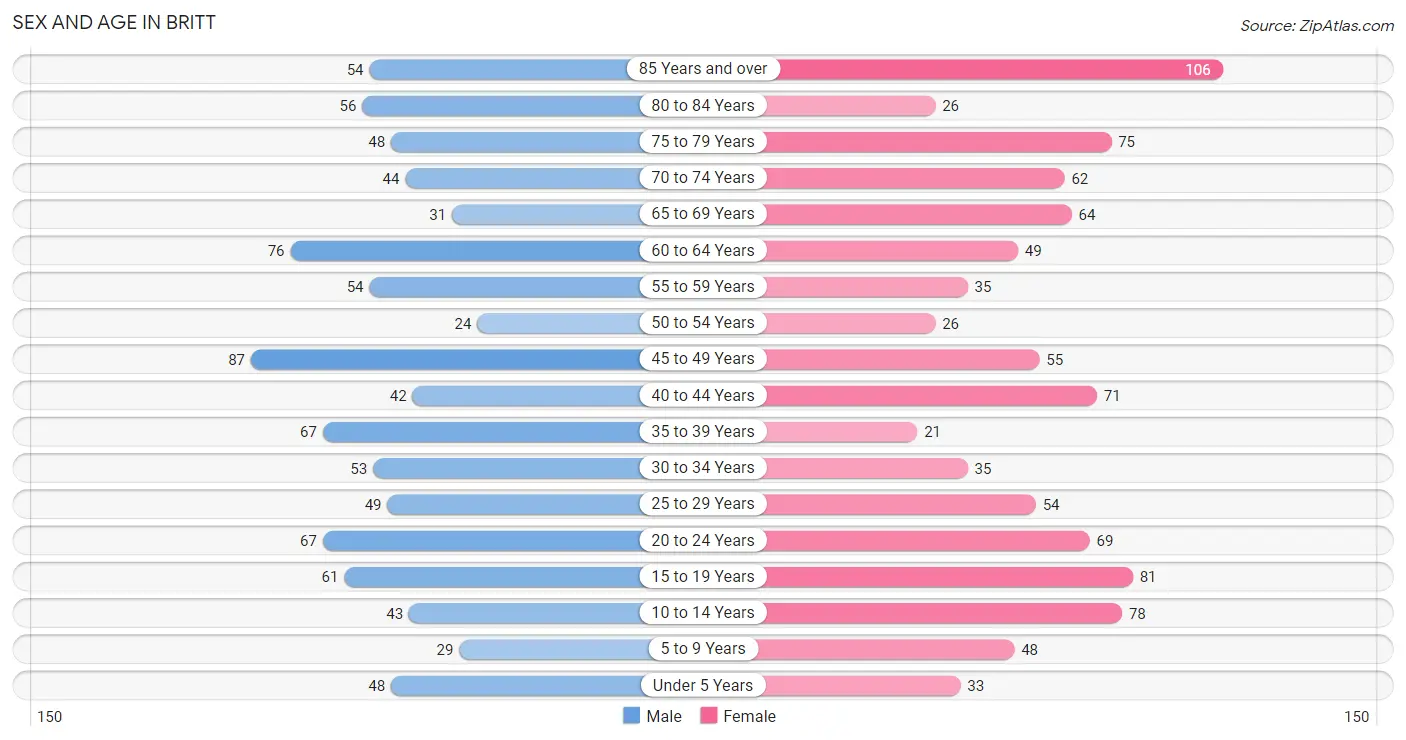
| Age Bracket | Male | Female |
| Under 5 Years | 48 (5.1%) | 33 (3.3%) |
| 5 to 9 Years | 29 (3.1%) | 48 (4.9%) |
| 10 to 14 Years | 43 (4.6%) | 78 (7.9%) |
| 15 to 19 Years | 61 (6.5%) | 81 (8.2%) |
| 20 to 24 Years | 67 (7.2%) | 69 (7.0%) |
| 25 to 29 Years | 49 (5.2%) | 54 (5.5%) |
| 30 to 34 Years | 53 (5.7%) | 35 (3.5%) |
| 35 to 39 Years | 67 (7.2%) | 21 (2.1%) |
| 40 to 44 Years | 42 (4.5%) | 71 (7.2%) |
| 45 to 49 Years | 87 (9.3%) | 55 (5.6%) |
| 50 to 54 Years | 24 (2.6%) | 26 (2.6%) |
| 55 to 59 Years | 54 (5.8%) | 35 (3.5%) |
| 60 to 64 Years | 76 (8.2%) | 49 (5.0%) |
| 65 to 69 Years | 31 (3.3%) | 64 (6.5%) |
| 70 to 74 Years | 44 (4.7%) | 62 (6.3%) |
| 75 to 79 Years | 48 (5.1%) | 75 (7.6%) |
| 80 to 84 Years | 56 (6.0%) | 26 (2.6%) |
| 85 Years and over | 54 (5.8%) | 106 (10.7%) |
| Total | 933 (100.0%) | 988 (100.0%) |
Families and Households in Britt
Median Family Size in Britt
The median family size in Britt is 2.72 persons per family, with single female/mother families (66 | 12.5%) accounting for the largest median family size of 2.88 persons per family. On the other hand, single male/father families (45 | 8.5%) represent the smallest median family size with 1.82 persons per family.
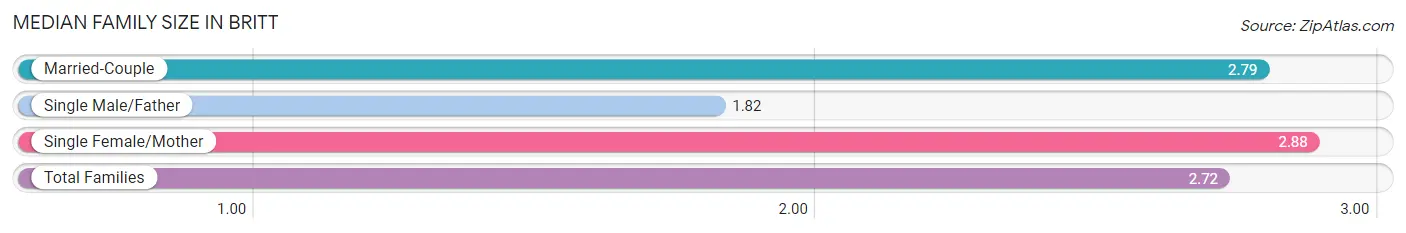
| Family Type | # Families | Family Size |
| Married-Couple | 418 (79.0%) | 2.79 |
| Single Male/Father | 45 (8.5%) | 1.82 |
| Single Female/Mother | 66 (12.5%) | 2.88 |
| Total Families | 529 (100.0%) | 2.72 |
Median Household Size in Britt
The median household size in Britt is 2.18 persons per household, with single female/mother households (66 | 7.9%) accounting for the largest median household size of 3.15 persons per household. non-family households (302 | 36.3%) represent the smallest median household size with 1.04 persons per household.
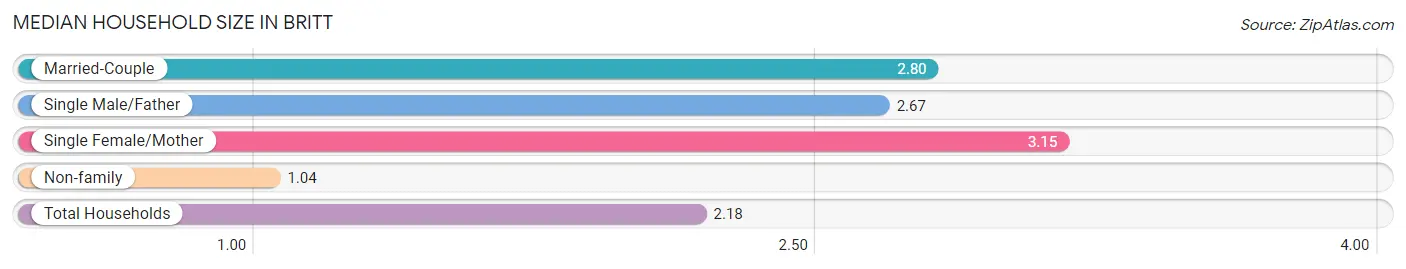
| Household Type | # Households | Household Size |
| Married-Couple | 418 (50.3%) | 2.80 |
| Single Male/Father | 45 (5.4%) | 2.67 |
| Single Female/Mother | 66 (7.9%) | 3.15 |
| Non-family | 302 (36.3%) | 1.04 |
| Total Households | 831 (100.0%) | 2.18 |
Household Size by Marriage Status in Britt
Out of a total of 831 households in Britt, 529 (63.7%) are family households, while 302 (36.3%) are nonfamily households. The most numerous type of family households are 2-person households, comprising 316, and the most common type of nonfamily households are 1-person households, comprising 284.
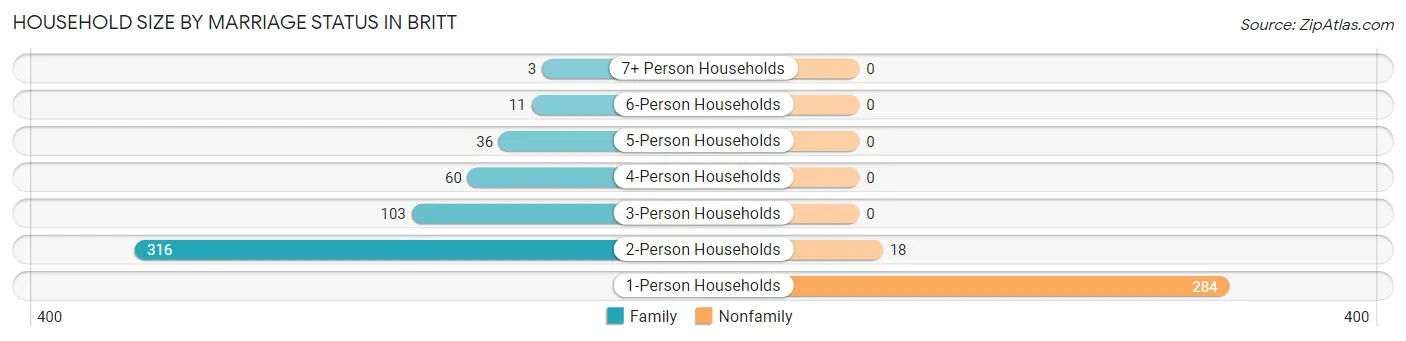
| Household Size | Family Households | Nonfamily Households |
| 1-Person Households | - | 284 (34.2%) |
| 2-Person Households | 316 (38.0%) | 18 (2.2%) |
| 3-Person Households | 103 (12.4%) | 0 (0.0%) |
| 4-Person Households | 60 (7.2%) | 0 (0.0%) |
| 5-Person Households | 36 (4.3%) | 0 (0.0%) |
| 6-Person Households | 11 (1.3%) | 0 (0.0%) |
| 7+ Person Households | 3 (0.4%) | 0 (0.0%) |
| Total | 529 (63.7%) | 302 (36.3%) |
Female Fertility in Britt
Fertility by Age in Britt
Average fertility rate in Britt is 36.0 births per 1,000 women. Women in the age bracket of 20 to 34 years have the highest fertility rate with 89.0 births per 1,000 women. Women in the age bracket of 20 to 34 years acount for 100.0% of all women with births.
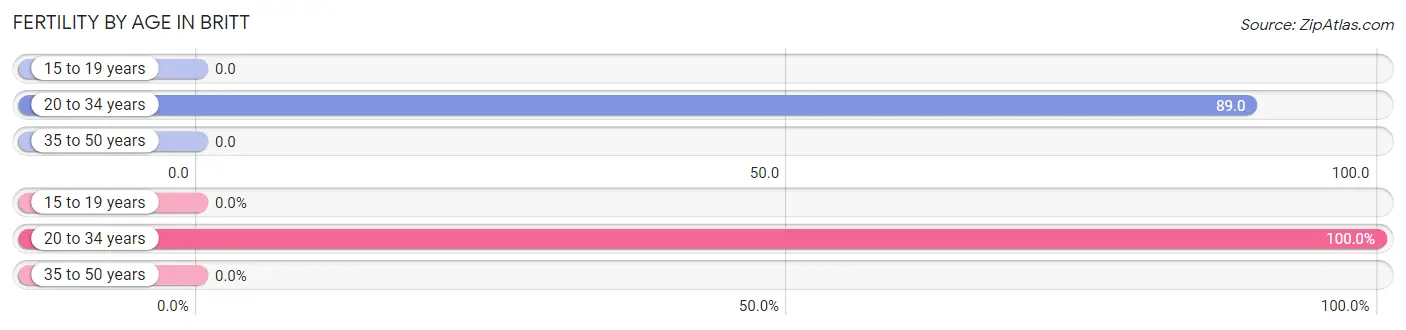
| Age Bracket | Women with Births | Births / 1,000 Women |
| 15 to 19 years | 0 (0.0%) | 0.0 |
| 20 to 34 years | 14 (100.0%) | 89.0 |
| 35 to 50 years | 0 (0.0%) | 0.0 |
| Total | 14 (100.0%) | 36.0 |
Fertility by Age by Marriage Status in Britt
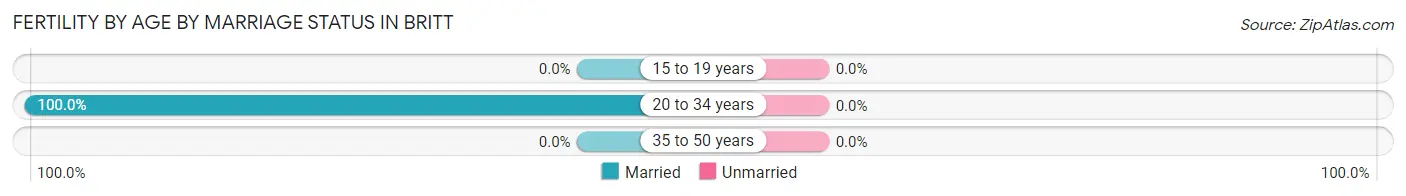
| Age Bracket | Married | Unmarried |
| 15 to 19 years | 0 (0.0%) | 0 (0.0%) |
| 20 to 34 years | 14 (100.0%) | 0 (0.0%) |
| 35 to 50 years | 0 (0.0%) | 0 (0.0%) |
| Total | 14 (100.0%) | 0 (0.0%) |
Fertility by Education in Britt
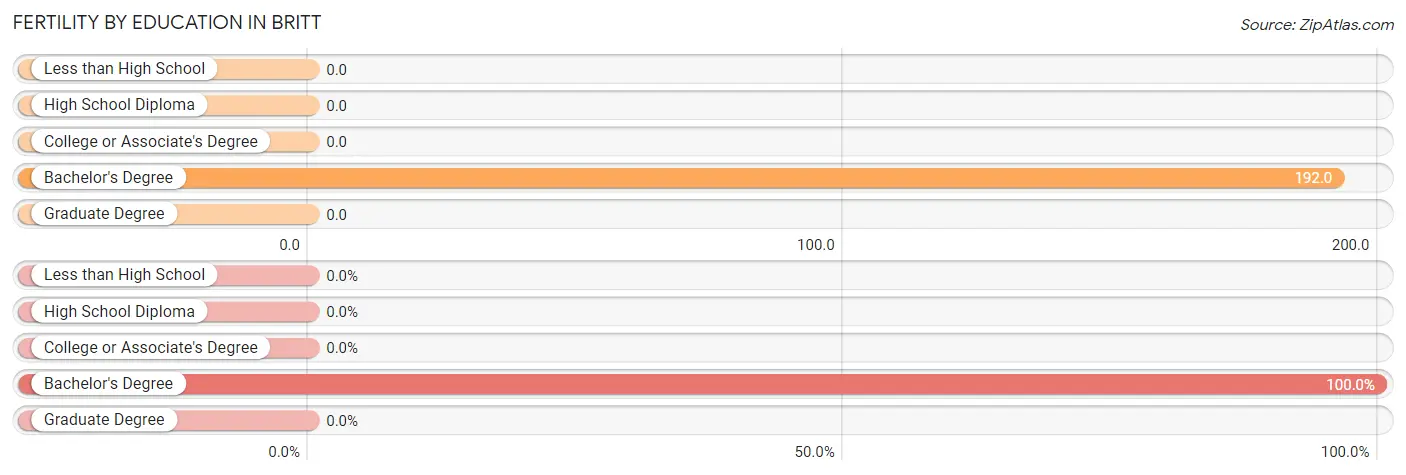
| Educational Attainment | Women with Births | Births / 1,000 Women |
| Less than High School | 0 (0.0%) | 0.0 |
| High School Diploma | 0 (0.0%) | 0.0 |
| College or Associate's Degree | 0 (0.0%) | 0.0 |
| Bachelor's Degree | 14 (100.0%) | 192.0 |
| Graduate Degree | 0 (0.0%) | 0.0 |
| Total | 14 (100.0%) | 36.0 |
Fertility by Education by Marriage Status in Britt
| Educational Attainment | Married | Unmarried |
| Less than High School | 0 (0.0%) | 0 (0.0%) |
| High School Diploma | 0 (0.0%) | 0 (0.0%) |
| College or Associate's Degree | 0 (0.0%) | 0 (0.0%) |
| Bachelor's Degree | 14 (100.0%) | 0 (0.0%) |
| Graduate Degree | 0 (0.0%) | 0 (0.0%) |
| Total | 14 (100.0%) | 0 (0.0%) |
Employment Characteristics in Britt
Employment by Class of Employer in Britt
Among the 890 employed individuals in Britt, private company employees (641 | 72.0%), not-for-profit organizations (80 | 9.0%), and self-employed (not incorporated) (61 | 6.9%) make up the most common classes of employment.
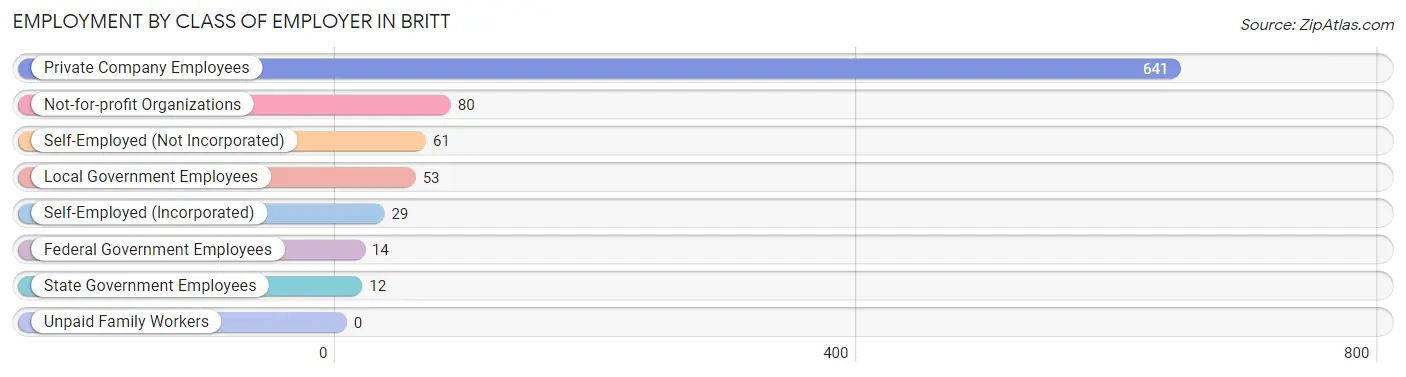
| Employer Class | # Employees | % Employees |
| Private Company Employees | 641 | 72.0% |
| Self-Employed (Incorporated) | 29 | 3.3% |
| Self-Employed (Not Incorporated) | 61 | 6.9% |
| Not-for-profit Organizations | 80 | 9.0% |
| Local Government Employees | 53 | 6.0% |
| State Government Employees | 12 | 1.3% |
| Federal Government Employees | 14 | 1.6% |
| Unpaid Family Workers | 0 | 0.0% |
| Total | 890 | 100.0% |
Employment Status by Age in Britt
According to the labor force statistics for Britt, out of the total population over 16 years of age (1,600), 57.8% or 925 individuals are in the labor force, with 3.5% or 32 of them unemployed. The age group with the highest labor force participation rate is 45 to 54 years, with 95.8% or 184 individuals in the labor force. Within the labor force, the 20 to 24 years age range has the highest percentage of unemployed individuals, with 14.4% or 16 of them being unemployed.
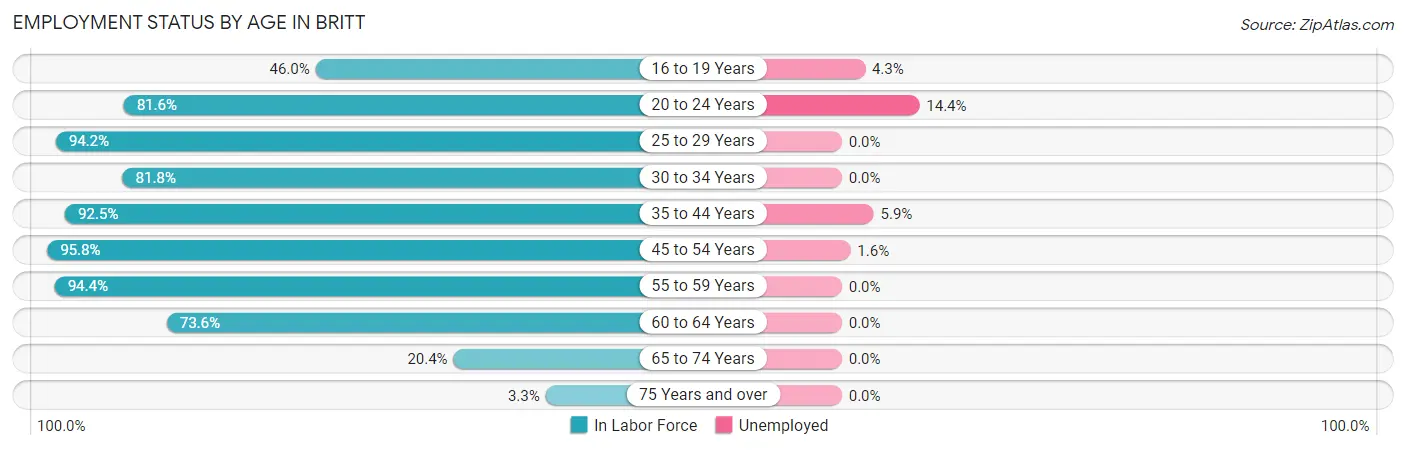
| Age Bracket | In Labor Force | Unemployed |
| 16 to 19 Years | 46 (46.0%) | 2 (4.3%) |
| 20 to 24 Years | 111 (81.6%) | 16 (14.4%) |
| 25 to 29 Years | 97 (94.2%) | 0 (0.0%) |
| 30 to 34 Years | 72 (81.8%) | 0 (0.0%) |
| 35 to 44 Years | 186 (92.5%) | 11 (5.9%) |
| 45 to 54 Years | 184 (95.8%) | 3 (1.6%) |
| 55 to 59 Years | 84 (94.4%) | 0 (0.0%) |
| 60 to 64 Years | 92 (73.6%) | 0 (0.0%) |
| 65 to 74 Years | 41 (20.4%) | 0 (0.0%) |
| 75 Years and over | 12 (3.3%) | 0 (0.0%) |
| Total | 925 (57.8%) | 32 (3.5%) |
Employment Status by Educational Attainment in Britt
According to labor force statistics for Britt, 89.6% of individuals (715) out of the total population between 25 and 64 years of age (798) are in the labor force, with 2.0% or 14 of them being unemployed. The group with the highest labor force participation rate are those with the educational attainment of bachelor's degree or higher, with 99.1% or 221 individuals in the labor force. Within the labor force, individuals with less than high school education have the highest percentage of unemployment, with 14.1% or 14 of them being unemployed.
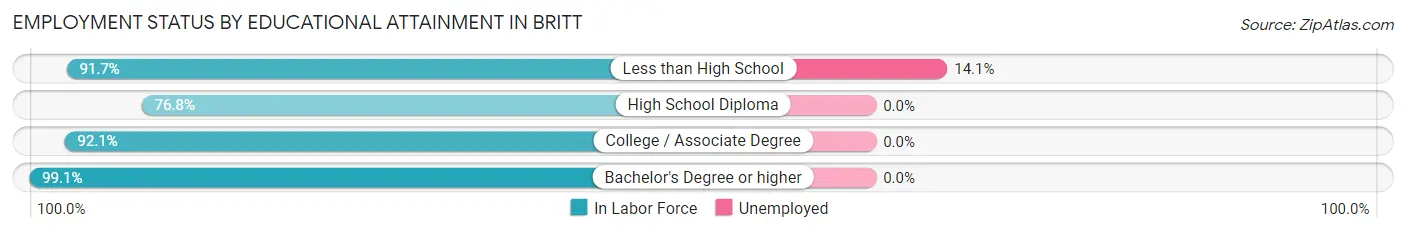
| Educational Attainment | In Labor Force | Unemployed |
| Less than High School | 99 (91.7%) | 15 (14.1%) |
| High School Diploma | 175 (76.8%) | 0 (0.0%) |
| College / Associate Degree | 220 (92.1%) | 0 (0.0%) |
| Bachelor's Degree or higher | 221 (99.1%) | 0 (0.0%) |
| Total | 715 (89.6%) | 16 (2.0%) |
Employment Occupations by Sex in Britt
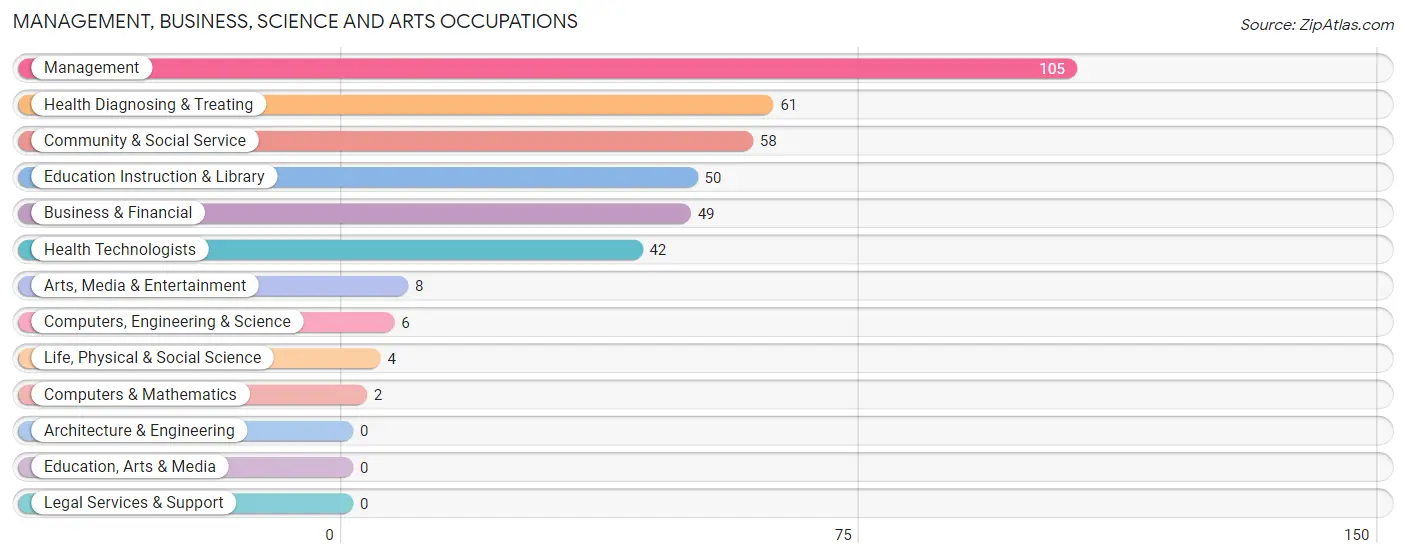
Management, Business, Science and Arts Occupations
The most common Management, Business, Science and Arts occupations in Britt are Management (105 | 11.8%), Health Diagnosing & Treating (61 | 6.8%), Community & Social Service (58 | 6.5%), Education Instruction & Library (50 | 5.6%), and Business & Financial (49 | 5.5%).
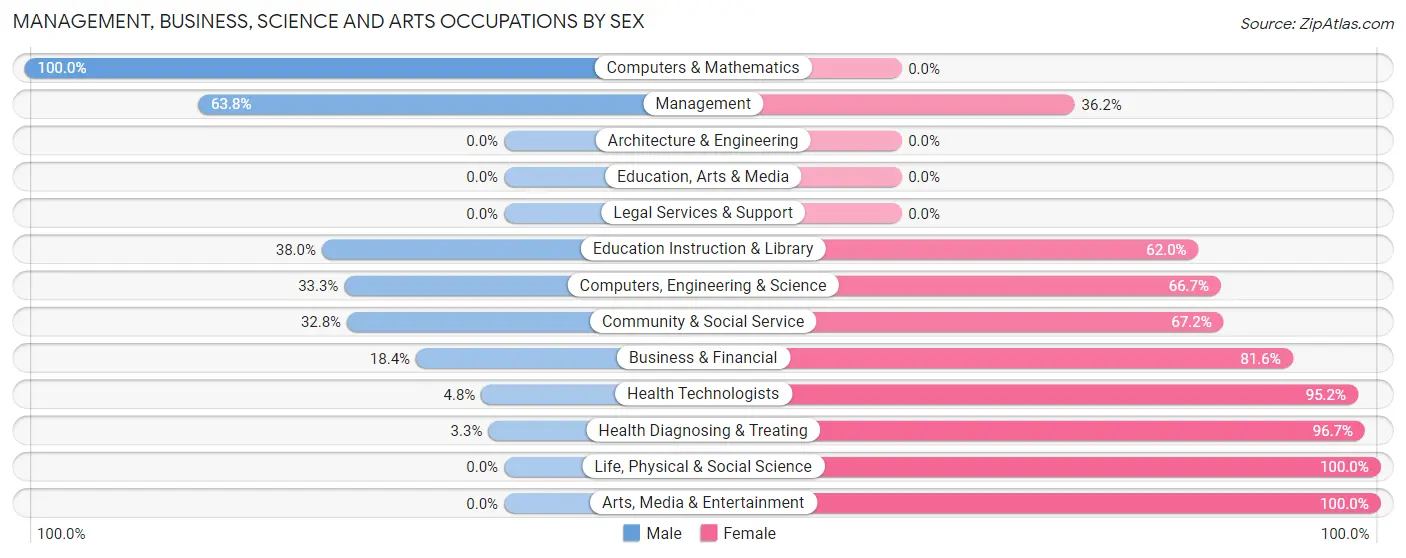
Management, Business, Science and Arts Occupations by Sex
Within the Management, Business, Science and Arts occupations in Britt, the most male-oriented occupations are Computers & Mathematics (100.0%), Management (63.8%), and Education Instruction & Library (38.0%), while the most female-oriented occupations are Life, Physical & Social Science (100.0%), Arts, Media & Entertainment (100.0%), and Health Diagnosing & Treating (96.7%).
| Occupation | Male | Female |
| Management | 67 (63.8%) | 38 (36.2%) |
| Business & Financial | 9 (18.4%) | 40 (81.6%) |
| Computers, Engineering & Science | 2 (33.3%) | 4 (66.7%) |
| Computers & Mathematics | 2 (100.0%) | 0 (0.0%) |
| Architecture & Engineering | 0 (0.0%) | 0 (0.0%) |
| Life, Physical & Social Science | 0 (0.0%) | 4 (100.0%) |
| Community & Social Service | 19 (32.8%) | 39 (67.2%) |
| Education, Arts & Media | 0 (0.0%) | 0 (0.0%) |
| Legal Services & Support | 0 (0.0%) | 0 (0.0%) |
| Education Instruction & Library | 19 (38.0%) | 31 (62.0%) |
| Arts, Media & Entertainment | 0 (0.0%) | 8 (100.0%) |
| Health Diagnosing & Treating | 2 (3.3%) | 59 (96.7%) |
| Health Technologists | 2 (4.8%) | 40 (95.2%) |
| Total (Category) | 99 (35.5%) | 180 (64.5%) |
| Total (Overall) | 513 (57.5%) | 380 (42.5%) |
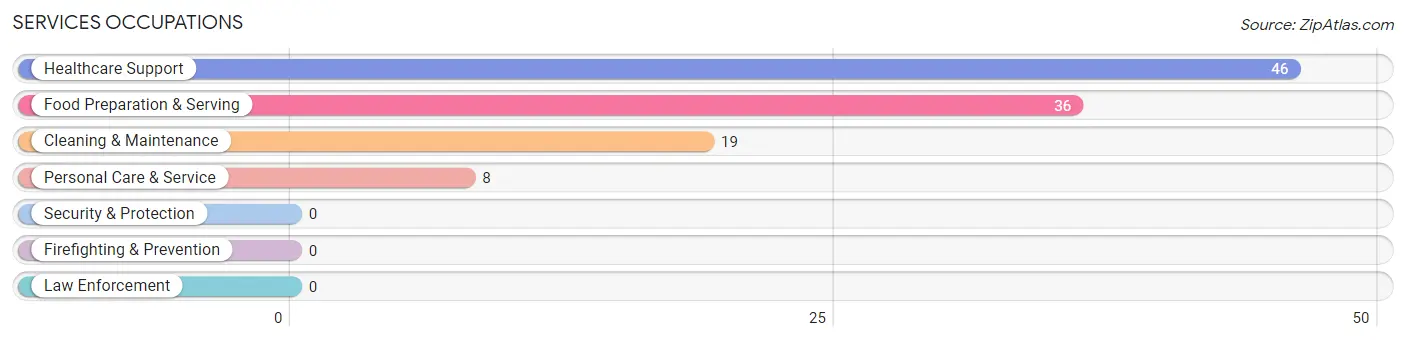
Services Occupations
The most common Services occupations in Britt are Healthcare Support (46 | 5.1%), Food Preparation & Serving (36 | 4.0%), Cleaning & Maintenance (19 | 2.1%), and Personal Care & Service (8 | 0.9%).
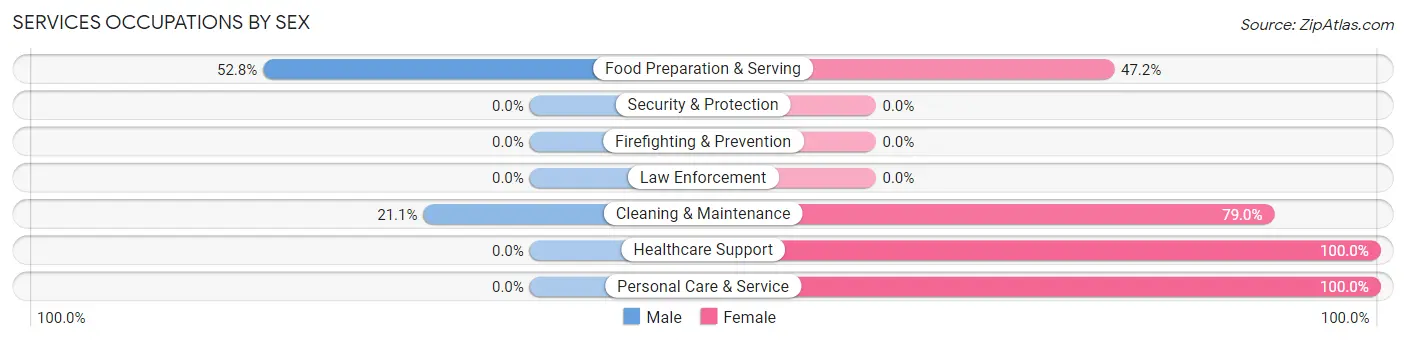
Services Occupations by Sex
Within the Services occupations in Britt, the most male-oriented occupations are Food Preparation & Serving (52.8%), and Cleaning & Maintenance (21.0%), while the most female-oriented occupations are Healthcare Support (100.0%), Personal Care & Service (100.0%), and Cleaning & Maintenance (78.9%).
| Occupation | Male | Female |
| Healthcare Support | 0 (0.0%) | 46 (100.0%) |
| Security & Protection | 0 (0.0%) | 0 (0.0%) |
| Firefighting & Prevention | 0 (0.0%) | 0 (0.0%) |
| Law Enforcement | 0 (0.0%) | 0 (0.0%) |
| Food Preparation & Serving | 19 (52.8%) | 17 (47.2%) |
| Cleaning & Maintenance | 4 (21.0%) | 15 (78.9%) |
| Personal Care & Service | 0 (0.0%) | 8 (100.0%) |
| Total (Category) | 23 (21.1%) | 86 (78.9%) |
| Total (Overall) | 513 (57.5%) | 380 (42.5%) |
Sales and Office Occupations
The most common Sales and Office occupations in Britt are Sales & Related (118 | 13.2%), and Office & Administration (25 | 2.8%).
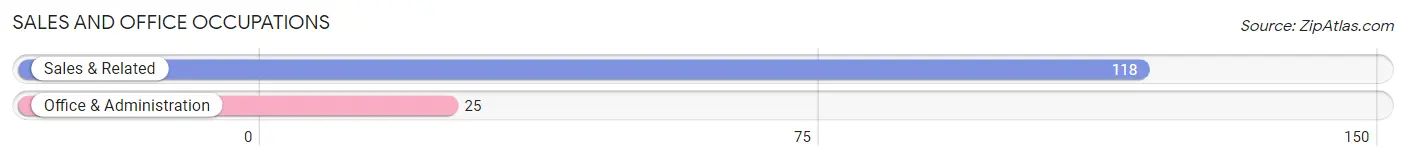
Sales and Office Occupations by Sex
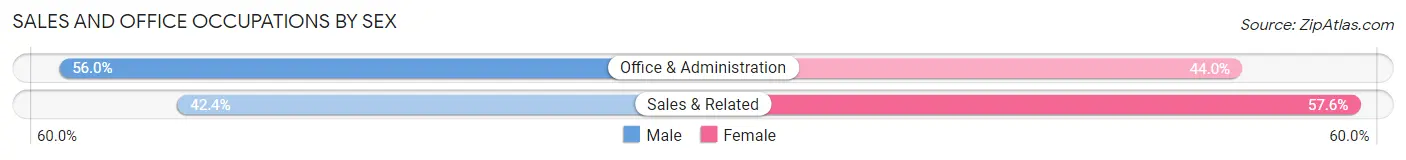
| Occupation | Male | Female |
| Sales & Related | 50 (42.4%) | 68 (57.6%) |
| Office & Administration | 14 (56.0%) | 11 (44.0%) |
| Total (Category) | 64 (44.8%) | 79 (55.2%) |
| Total (Overall) | 513 (57.5%) | 380 (42.5%) |
Natural Resources, Construction and Maintenance Occupations
The most common Natural Resources, Construction and Maintenance occupations in Britt are Farming, Fishing & Forestry (56 | 6.3%), Construction & Extraction (47 | 5.3%), and Installation, Maintenance & Repair (41 | 4.6%).
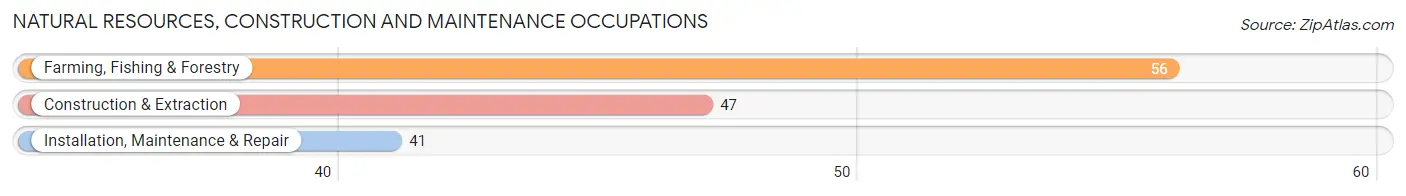
Natural Resources, Construction and Maintenance Occupations by Sex
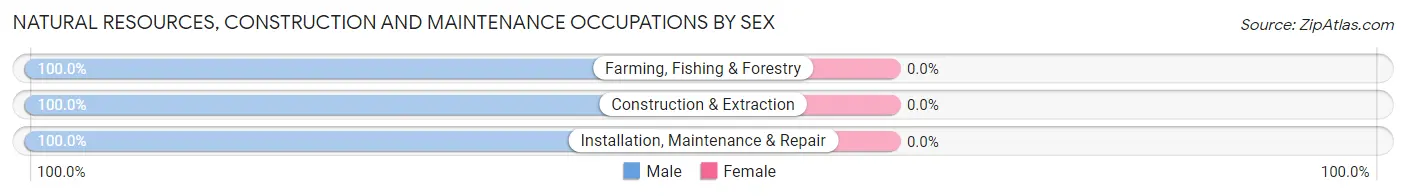
| Occupation | Male | Female |
| Farming, Fishing & Forestry | 56 (100.0%) | 0 (0.0%) |
| Construction & Extraction | 47 (100.0%) | 0 (0.0%) |
| Installation, Maintenance & Repair | 41 (100.0%) | 0 (0.0%) |
| Total (Category) | 144 (100.0%) | 0 (0.0%) |
| Total (Overall) | 513 (57.5%) | 380 (42.5%) |
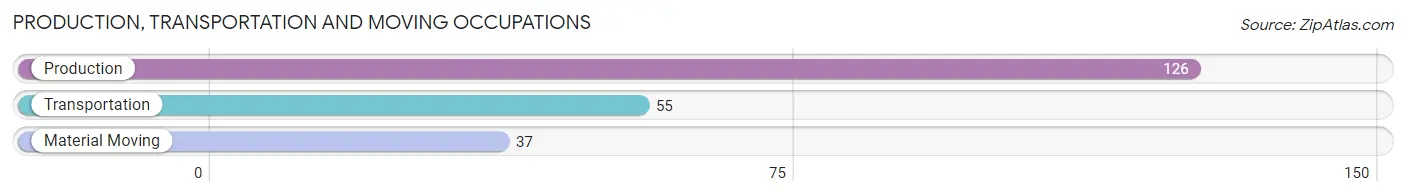
Production, Transportation and Moving Occupations
The most common Production, Transportation and Moving occupations in Britt are Production (126 | 14.1%), Transportation (55 | 6.2%), and Material Moving (37 | 4.1%).
Production, Transportation and Moving Occupations by Sex
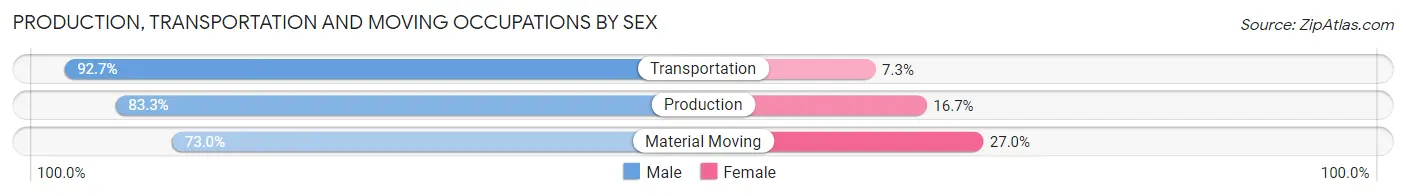
| Occupation | Male | Female |
| Production | 105 (83.3%) | 21 (16.7%) |
| Transportation | 51 (92.7%) | 4 (7.3%) |
| Material Moving | 27 (73.0%) | 10 (27.0%) |
| Total (Category) | 183 (83.9%) | 35 (16.1%) |
| Total (Overall) | 513 (57.5%) | 380 (42.5%) |
Employment Industries by Sex in Britt
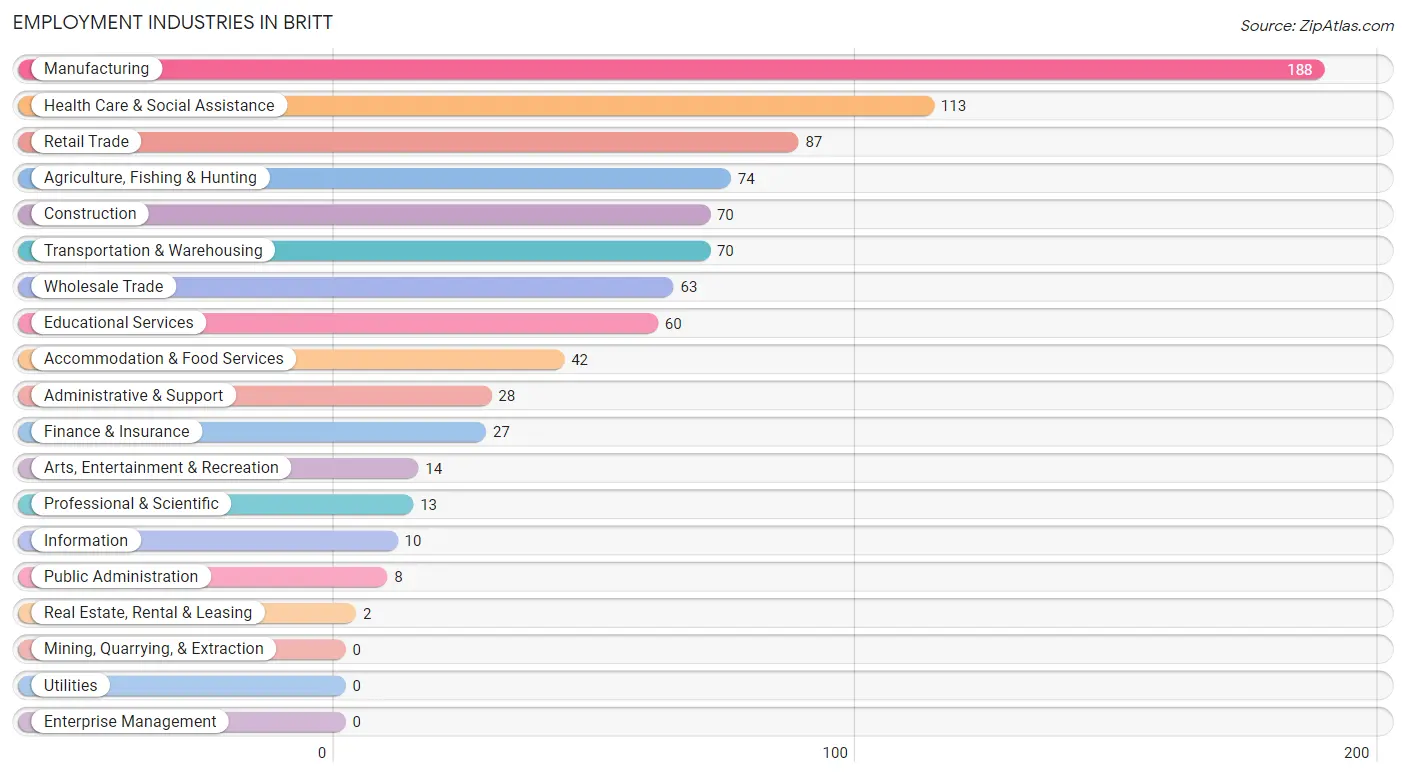
Employment Industries in Britt
The major employment industries in Britt include Manufacturing (188 | 21.0%), Health Care & Social Assistance (113 | 12.7%), Retail Trade (87 | 9.7%), Agriculture, Fishing & Hunting (74 | 8.3%), and Construction (70 | 7.8%).
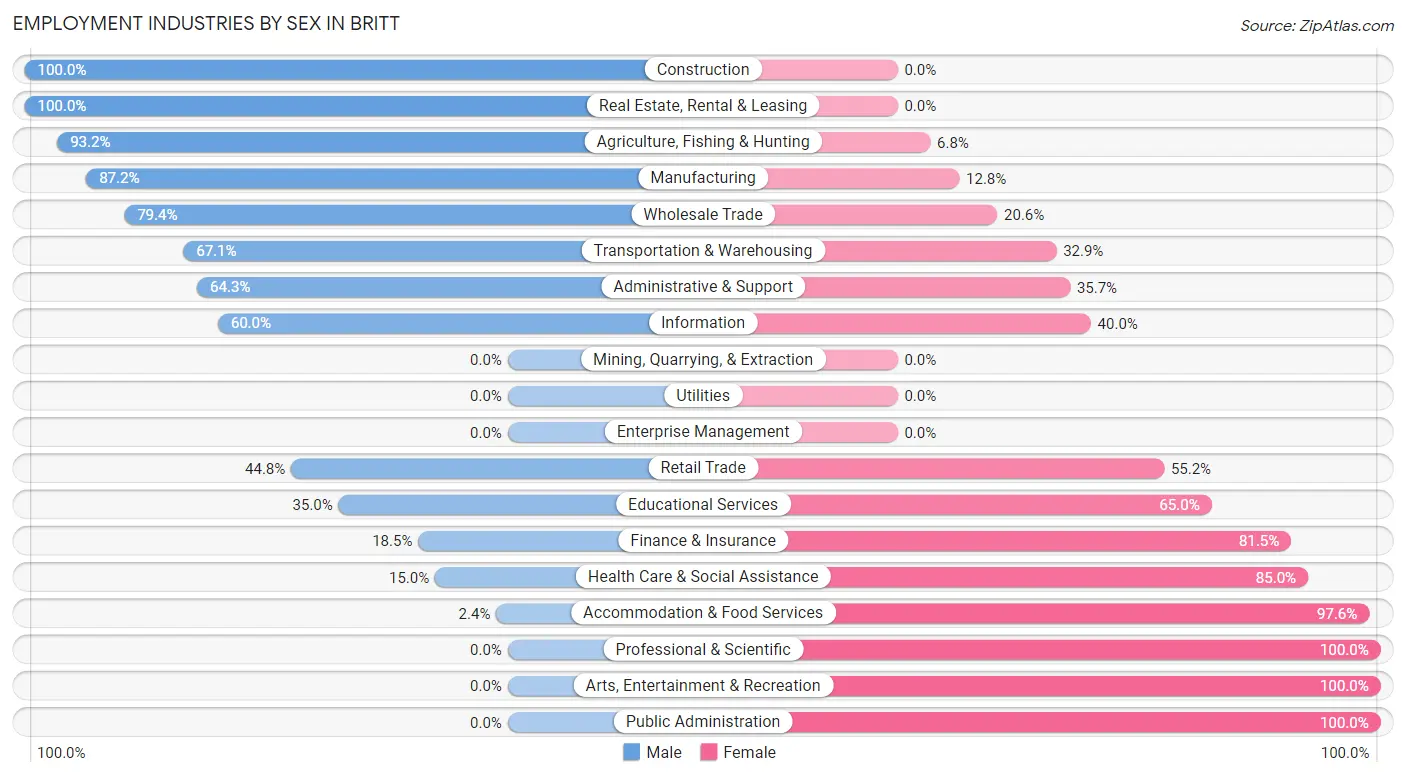
Employment Industries by Sex in Britt
The Britt industries that see more men than women are Construction (100.0%), Real Estate, Rental & Leasing (100.0%), and Agriculture, Fishing & Hunting (93.2%), whereas the industries that tend to have a higher number of women are Professional & Scientific (100.0%), Arts, Entertainment & Recreation (100.0%), and Public Administration (100.0%).
| Industry | Male | Female |
| Agriculture, Fishing & Hunting | 69 (93.2%) | 5 (6.8%) |
| Mining, Quarrying, & Extraction | 0 (0.0%) | 0 (0.0%) |
| Construction | 70 (100.0%) | 0 (0.0%) |
| Manufacturing | 164 (87.2%) | 24 (12.8%) |
| Wholesale Trade | 50 (79.4%) | 13 (20.6%) |
| Retail Trade | 39 (44.8%) | 48 (55.2%) |
| Transportation & Warehousing | 47 (67.1%) | 23 (32.9%) |
| Utilities | 0 (0.0%) | 0 (0.0%) |
| Information | 6 (60.0%) | 4 (40.0%) |
| Finance & Insurance | 5 (18.5%) | 22 (81.5%) |
| Real Estate, Rental & Leasing | 2 (100.0%) | 0 (0.0%) |
| Professional & Scientific | 0 (0.0%) | 13 (100.0%) |
| Enterprise Management | 0 (0.0%) | 0 (0.0%) |
| Administrative & Support | 18 (64.3%) | 10 (35.7%) |
| Educational Services | 21 (35.0%) | 39 (65.0%) |
| Health Care & Social Assistance | 17 (15.0%) | 96 (85.0%) |
| Arts, Entertainment & Recreation | 0 (0.0%) | 14 (100.0%) |
| Accommodation & Food Services | 1 (2.4%) | 41 (97.6%) |
| Public Administration | 0 (0.0%) | 8 (100.0%) |
| Total | 513 (57.5%) | 380 (42.5%) |
Education in Britt
School Enrollment in Britt
The most common levels of schooling among the 373 students in Britt are high school (157 | 42.1%), elementary school (91 | 24.4%), and middle school (73 | 19.6%).
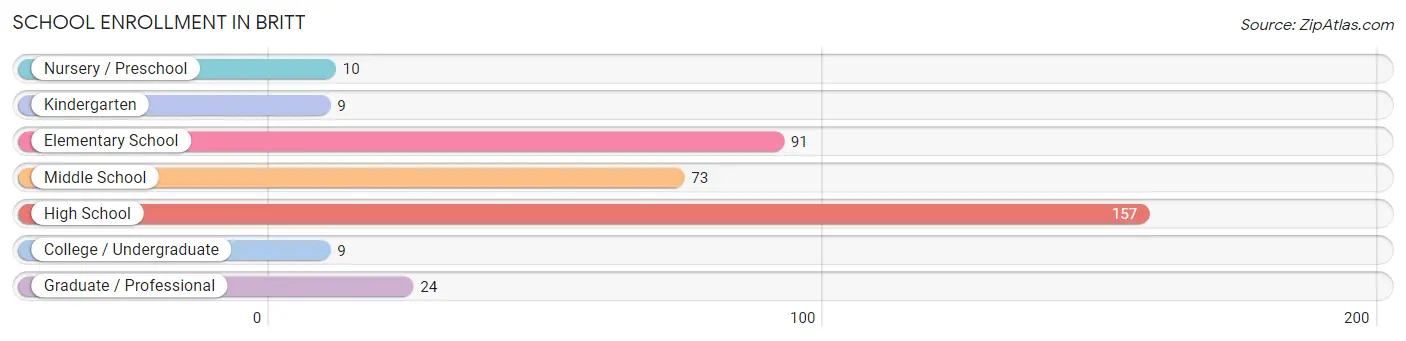
| School Level | # Students | % Students |
| Nursery / Preschool | 10 | 2.7% |
| Kindergarten | 9 | 2.4% |
| Elementary School | 91 | 24.4% |
| Middle School | 73 | 19.6% |
| High School | 157 | 42.1% |
| College / Undergraduate | 9 | 2.4% |
| Graduate / Professional | 24 | 6.4% |
| Total | 373 | 100.0% |
School Enrollment by Age by Funding Source in Britt
Out of a total of 373 students who are enrolled in schools in Britt, 41 (11.0%) attend a private institution, while the remaining 332 (89.0%) are enrolled in public schools. The age group of 18 to 19 year olds has the highest likelihood of being enrolled in private schools, with 17 (70.8% in the age bracket) enrolled. Conversely, the age group of 3 to 4 year olds has the lowest likelihood of being enrolled in a private school, with 10 (100.0% in the age bracket) attending a public institution.
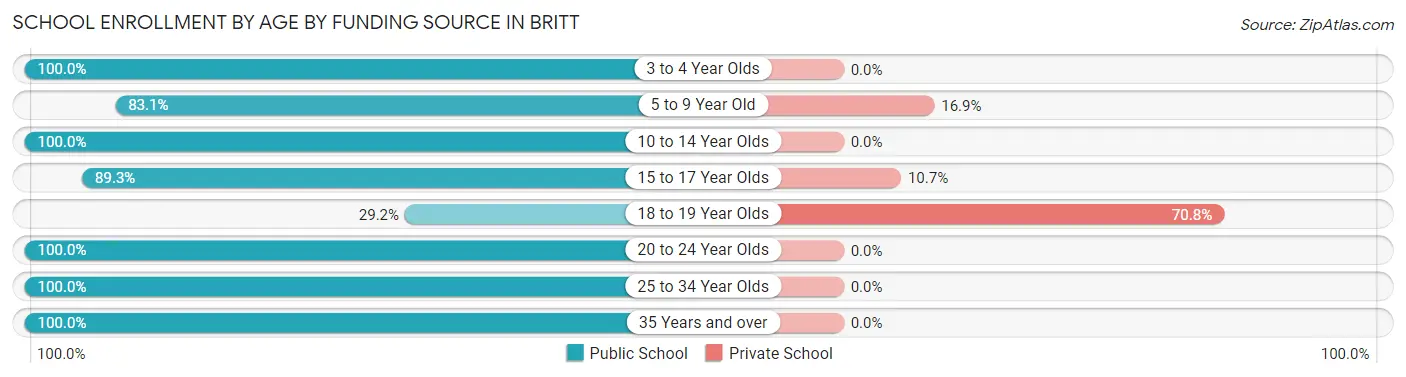
| Age Bracket | Public School | Private School |
| 3 to 4 Year Olds | 10 (100.0%) | 0 (0.0%) |
| 5 to 9 Year Old | 64 (83.1%) | 13 (16.9%) |
| 10 to 14 Year Olds | 116 (100.0%) | 0 (0.0%) |
| 15 to 17 Year Olds | 92 (89.3%) | 11 (10.7%) |
| 18 to 19 Year Olds | 7 (29.2%) | 17 (70.8%) |
| 20 to 24 Year Olds | 13 (100.0%) | 0 (0.0%) |
| 25 to 34 Year Olds | 24 (100.0%) | 0 (0.0%) |
| 35 Years and over | 6 (100.0%) | 0 (0.0%) |
| Total | 332 (89.0%) | 41 (11.0%) |
Educational Attainment by Field of Study in Britt
Education (123 | 36.3%), business (74 | 21.8%), science & technology (23 | 6.8%), arts & humanities (20 | 5.9%), and communications (19 | 5.6%) are the most common fields of study among 339 individuals in Britt who have obtained a bachelor's degree or higher.
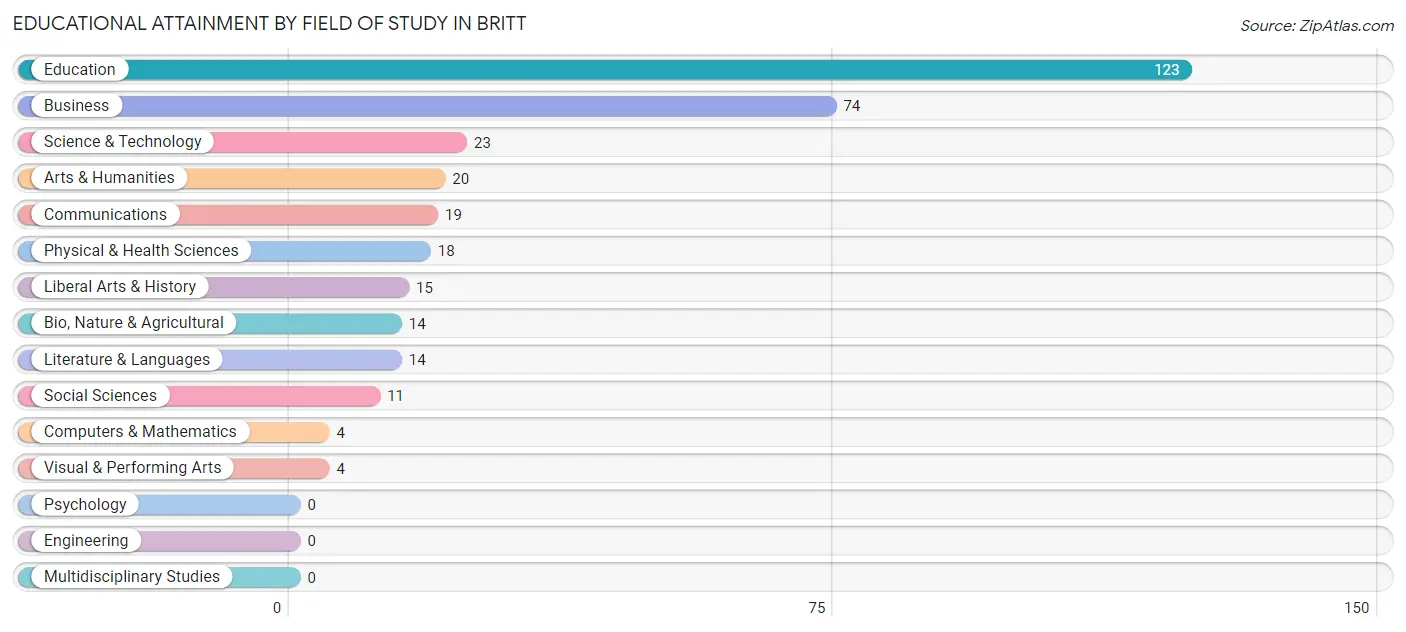
| Field of Study | # Graduates | % Graduates |
| Computers & Mathematics | 4 | 1.2% |
| Bio, Nature & Agricultural | 14 | 4.1% |
| Physical & Health Sciences | 18 | 5.3% |
| Psychology | 0 | 0.0% |
| Social Sciences | 11 | 3.2% |
| Engineering | 0 | 0.0% |
| Multidisciplinary Studies | 0 | 0.0% |
| Science & Technology | 23 | 6.8% |
| Business | 74 | 21.8% |
| Education | 123 | 36.3% |
| Literature & Languages | 14 | 4.1% |
| Liberal Arts & History | 15 | 4.4% |
| Visual & Performing Arts | 4 | 1.2% |
| Communications | 19 | 5.6% |
| Arts & Humanities | 20 | 5.9% |
| Total | 339 | 100.0% |
Transportation & Commute in Britt
Vehicle Availability by Sex in Britt
The most prevalent vehicle ownership categories in Britt are males with 2 vehicles (189, accounting for 36.8%) and females with 2 vehicles (174, making up 50.1%).
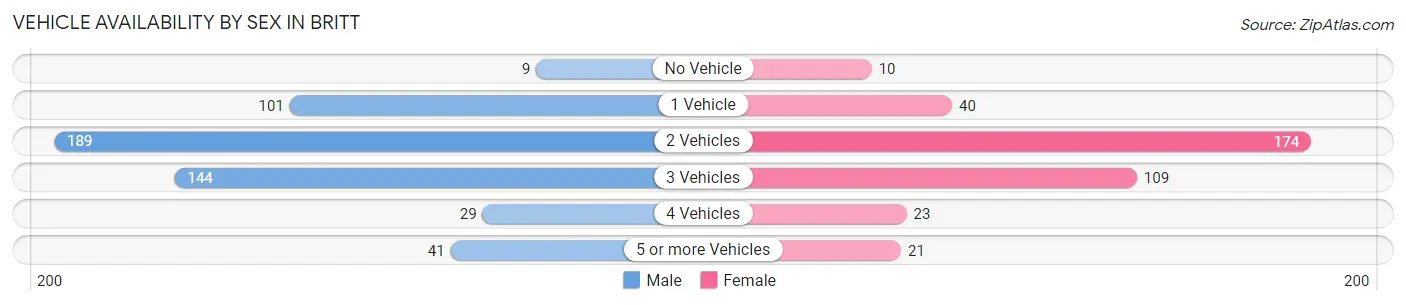
| Vehicles Available | Male | Female |
| No Vehicle | 9 (1.8%) | 10 (2.6%) |
| 1 Vehicle | 101 (19.7%) | 40 (10.6%) |
| 2 Vehicles | 189 (36.8%) | 174 (46.2%) |
| 3 Vehicles | 144 (28.1%) | 109 (28.9%) |
| 4 Vehicles | 29 (5.7%) | 23 (6.1%) |
| 5 or more Vehicles | 41 (8.0%) | 21 (5.6%) |
| Total | 513 (100.0%) | 377 (100.0%) |
Commute Time in Britt
The most frequently occuring commute durations in Britt are 5 to 9 minutes (158 commuters, 19.4%), 10 to 14 minutes (146 commuters, 18.0%), and 15 to 19 minutes (120 commuters, 14.8%).
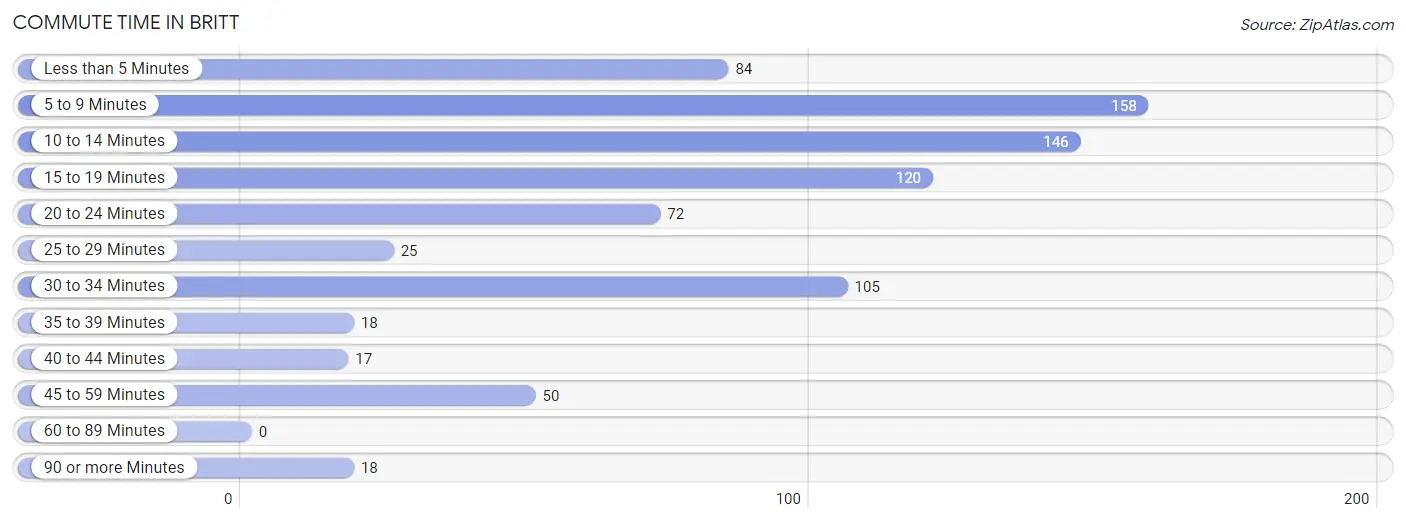
| Commute Time | # Commuters | % Commuters |
| Less than 5 Minutes | 84 | 10.3% |
| 5 to 9 Minutes | 158 | 19.4% |
| 10 to 14 Minutes | 146 | 18.0% |
| 15 to 19 Minutes | 120 | 14.8% |
| 20 to 24 Minutes | 72 | 8.9% |
| 25 to 29 Minutes | 25 | 3.1% |
| 30 to 34 Minutes | 105 | 12.9% |
| 35 to 39 Minutes | 18 | 2.2% |
| 40 to 44 Minutes | 17 | 2.1% |
| 45 to 59 Minutes | 50 | 6.1% |
| 60 to 89 Minutes | 0 | 0.0% |
| 90 or more Minutes | 18 | 2.2% |
Commute Time by Sex in Britt
The most common commute times in Britt are 10 to 14 minutes (88 commuters, 18.7%) for males and 5 to 9 minutes (83 commuters, 24.2%) for females.
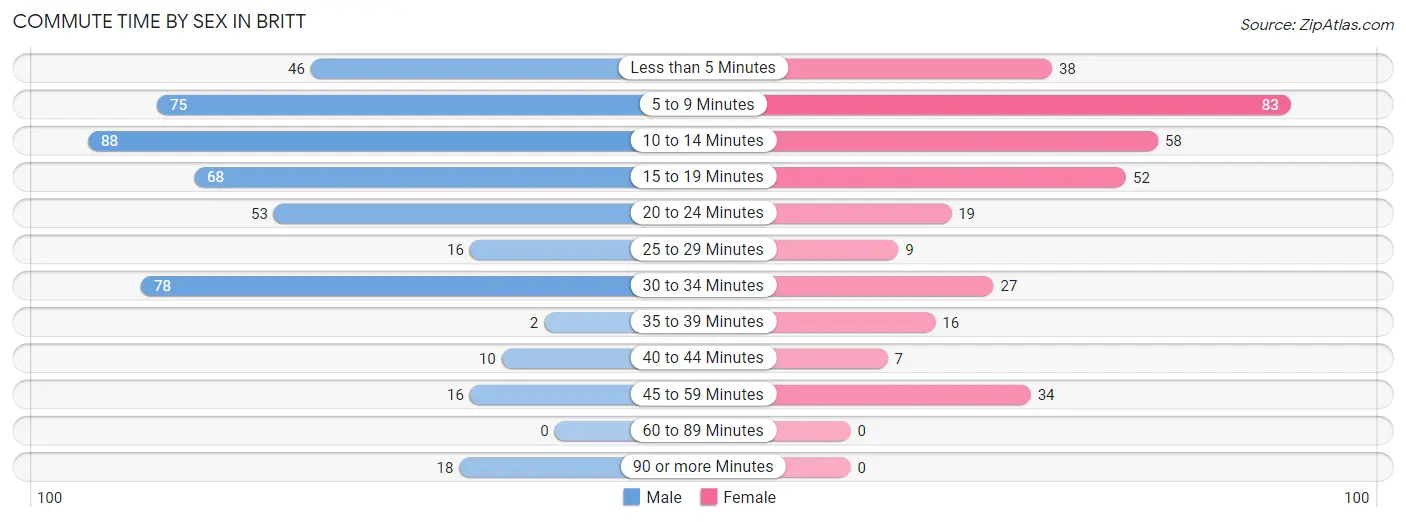
| Commute Time | Male | Female |
| Less than 5 Minutes | 46 (9.8%) | 38 (11.1%) |
| 5 to 9 Minutes | 75 (16.0%) | 83 (24.2%) |
| 10 to 14 Minutes | 88 (18.7%) | 58 (16.9%) |
| 15 to 19 Minutes | 68 (14.5%) | 52 (15.2%) |
| 20 to 24 Minutes | 53 (11.3%) | 19 (5.5%) |
| 25 to 29 Minutes | 16 (3.4%) | 9 (2.6%) |
| 30 to 34 Minutes | 78 (16.6%) | 27 (7.9%) |
| 35 to 39 Minutes | 2 (0.4%) | 16 (4.7%) |
| 40 to 44 Minutes | 10 (2.1%) | 7 (2.0%) |
| 45 to 59 Minutes | 16 (3.4%) | 34 (9.9%) |
| 60 to 89 Minutes | 0 (0.0%) | 0 (0.0%) |
| 90 or more Minutes | 18 (3.8%) | 0 (0.0%) |
Time of Departure to Work by Sex in Britt
The most frequent times of departure to work in Britt are 7:00 AM to 7:29 AM (118, 25.1%) for males and 7:00 AM to 7:29 AM (75, 21.9%) for females.
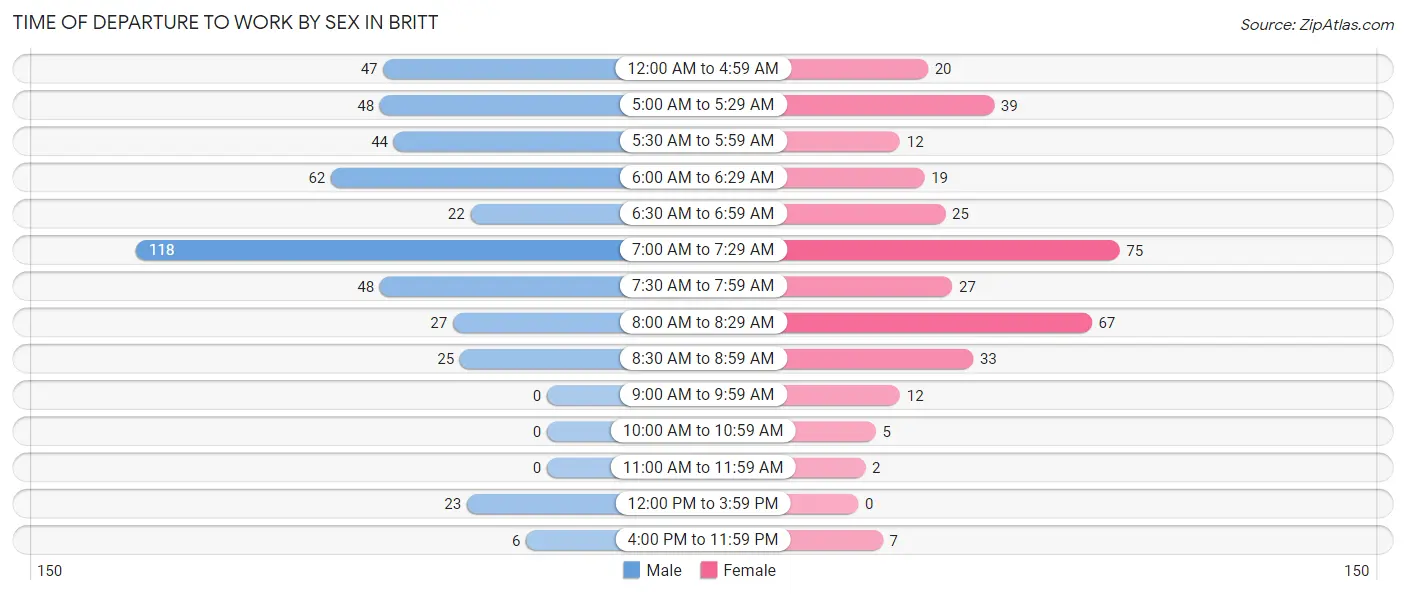
| Time of Departure | Male | Female |
| 12:00 AM to 4:59 AM | 47 (10.0%) | 20 (5.8%) |
| 5:00 AM to 5:29 AM | 48 (10.2%) | 39 (11.4%) |
| 5:30 AM to 5:59 AM | 44 (9.4%) | 12 (3.5%) |
| 6:00 AM to 6:29 AM | 62 (13.2%) | 19 (5.5%) |
| 6:30 AM to 6:59 AM | 22 (4.7%) | 25 (7.3%) |
| 7:00 AM to 7:29 AM | 118 (25.1%) | 75 (21.9%) |
| 7:30 AM to 7:59 AM | 48 (10.2%) | 27 (7.9%) |
| 8:00 AM to 8:29 AM | 27 (5.7%) | 67 (19.5%) |
| 8:30 AM to 8:59 AM | 25 (5.3%) | 33 (9.6%) |
| 9:00 AM to 9:59 AM | 0 (0.0%) | 12 (3.5%) |
| 10:00 AM to 10:59 AM | 0 (0.0%) | 5 (1.5%) |
| 11:00 AM to 11:59 AM | 0 (0.0%) | 2 (0.6%) |
| 12:00 PM to 3:59 PM | 23 (4.9%) | 0 (0.0%) |
| 4:00 PM to 11:59 PM | 6 (1.3%) | 7 (2.0%) |
| Total | 470 (100.0%) | 343 (100.0%) |
Housing Occupancy in Britt
Occupancy by Ownership in Britt
Of the total 831 dwellings in Britt, owner-occupied units account for 699 (84.1%), while renter-occupied units make up 132 (15.9%).
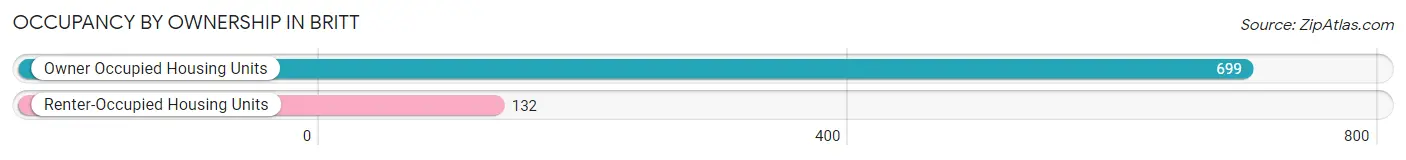
| Occupancy | # Housing Units | % Housing Units |
| Owner Occupied Housing Units | 699 | 84.1% |
| Renter-Occupied Housing Units | 132 | 15.9% |
| Total Occupied Housing Units | 831 | 100.0% |
Occupancy by Household Size in Britt
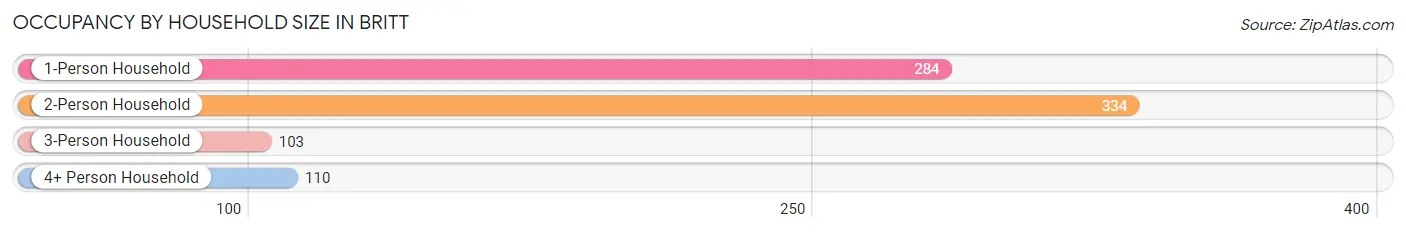
| Household Size | # Housing Units | % Housing Units |
| 1-Person Household | 284 | 34.2% |
| 2-Person Household | 334 | 40.2% |
| 3-Person Household | 103 | 12.4% |
| 4+ Person Household | 110 | 13.2% |
| Total Housing Units | 831 | 100.0% |
Occupancy by Ownership by Household Size in Britt
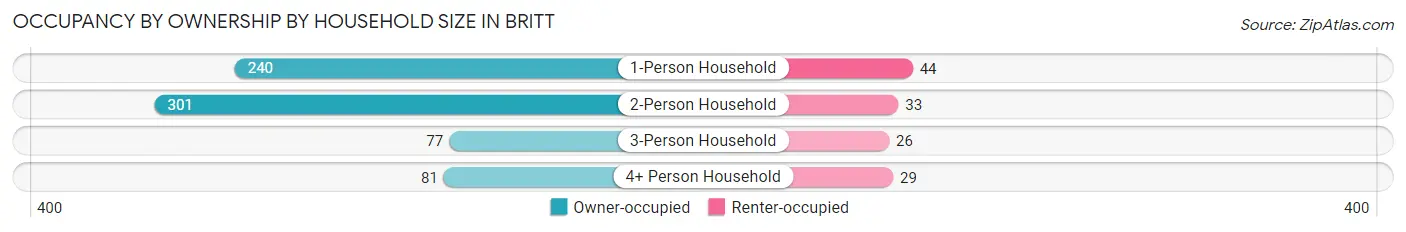
| Household Size | Owner-occupied | Renter-occupied |
| 1-Person Household | 240 (84.5%) | 44 (15.5%) |
| 2-Person Household | 301 (90.1%) | 33 (9.9%) |
| 3-Person Household | 77 (74.8%) | 26 (25.2%) |
| 4+ Person Household | 81 (73.6%) | 29 (26.4%) |
| Total Housing Units | 699 (84.1%) | 132 (15.9%) |
Occupancy by Educational Attainment in Britt
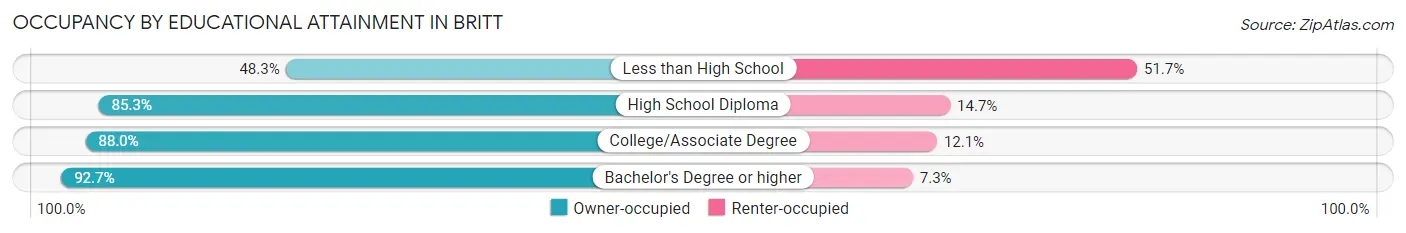
| Household Size | Owner-occupied | Renter-occupied |
| Less than High School | 42 (48.3%) | 45 (51.7%) |
| High School Diploma | 256 (85.3%) | 44 (14.7%) |
| College/Associate Degree | 197 (87.9%) | 27 (12.0%) |
| Bachelor's Degree or higher | 204 (92.7%) | 16 (7.3%) |
Occupancy by Age of Householder in Britt
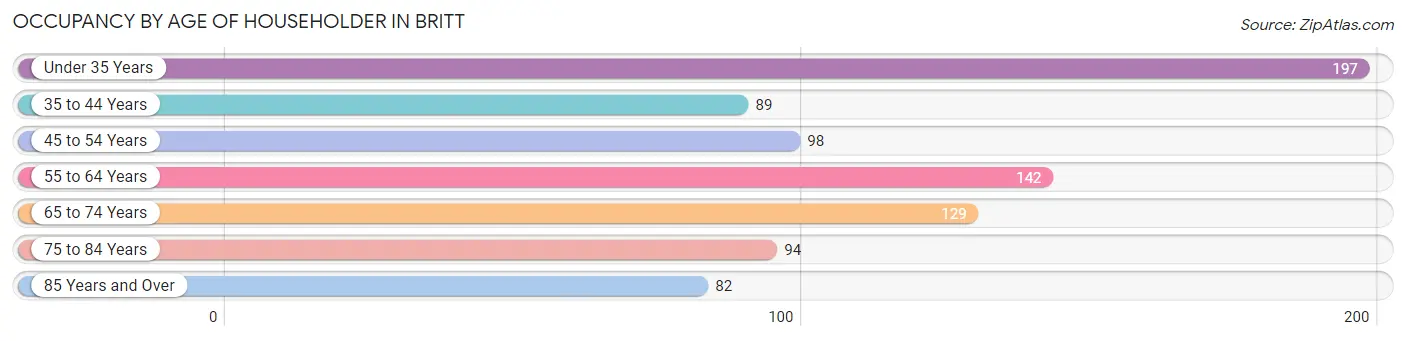
| Age Bracket | # Households | % Households |
| Under 35 Years | 197 | 23.7% |
| 35 to 44 Years | 89 | 10.7% |
| 45 to 54 Years | 98 | 11.8% |
| 55 to 64 Years | 142 | 17.1% |
| 65 to 74 Years | 129 | 15.5% |
| 75 to 84 Years | 94 | 11.3% |
| 85 Years and Over | 82 | 9.9% |
| Total | 831 | 100.0% |
Housing Finances in Britt
Median Income by Occupancy in Britt
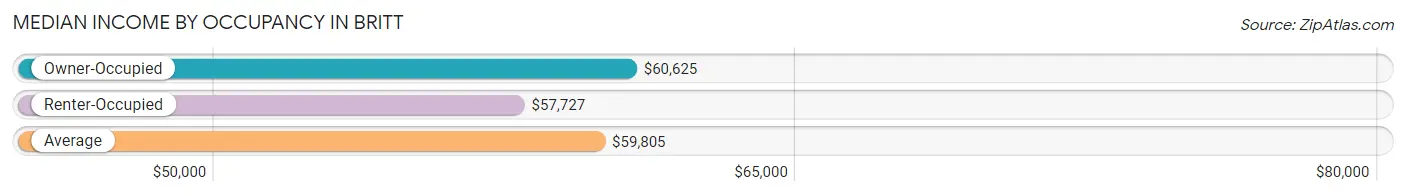
| Occupancy Type | # Households | Median Income |
| Owner-Occupied | 699 (84.1%) | $60,625 |
| Renter-Occupied | 132 (15.9%) | $57,727 |
| Average | 831 (100.0%) | $59,805 |
Occupancy by Householder Income Bracket in Britt
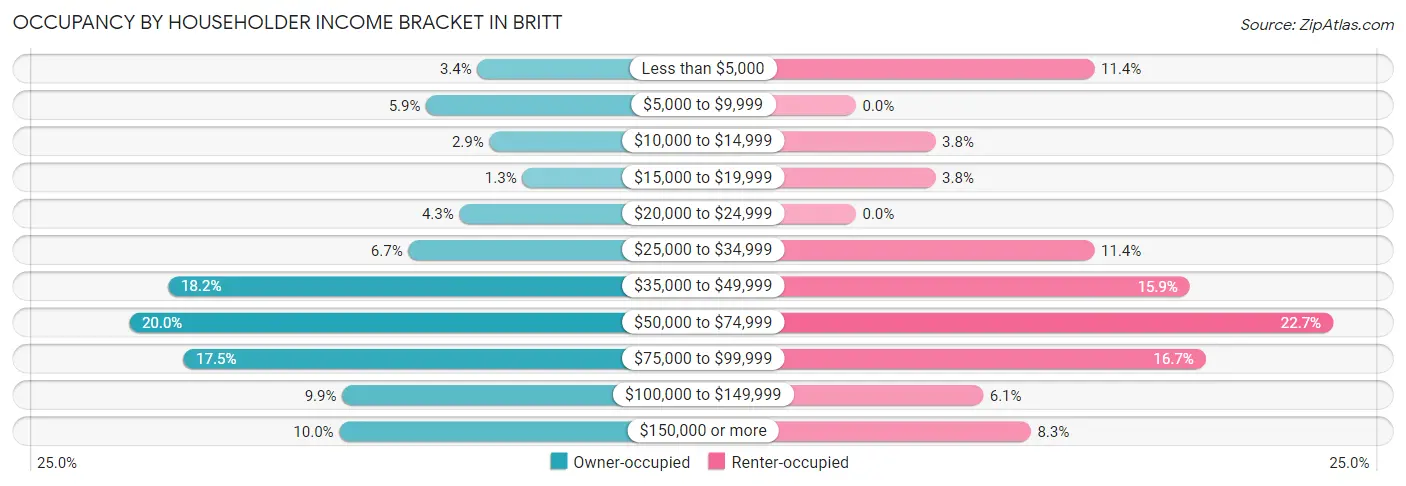
| Income Bracket | Owner-occupied | Renter-occupied |
| Less than $5,000 | 24 (3.4%) | 15 (11.4%) |
| $5,000 to $9,999 | 41 (5.9%) | 0 (0.0%) |
| $10,000 to $14,999 | 20 (2.9%) | 5 (3.8%) |
| $15,000 to $19,999 | 9 (1.3%) | 5 (3.8%) |
| $20,000 to $24,999 | 30 (4.3%) | 0 (0.0%) |
| $25,000 to $34,999 | 47 (6.7%) | 15 (11.4%) |
| $35,000 to $49,999 | 127 (18.2%) | 21 (15.9%) |
| $50,000 to $74,999 | 140 (20.0%) | 30 (22.7%) |
| $75,000 to $99,999 | 122 (17.4%) | 22 (16.7%) |
| $100,000 to $149,999 | 69 (9.9%) | 8 (6.1%) |
| $150,000 or more | 70 (10.0%) | 11 (8.3%) |
| Total | 699 (100.0%) | 132 (100.0%) |
Monthly Housing Cost Tiers in Britt
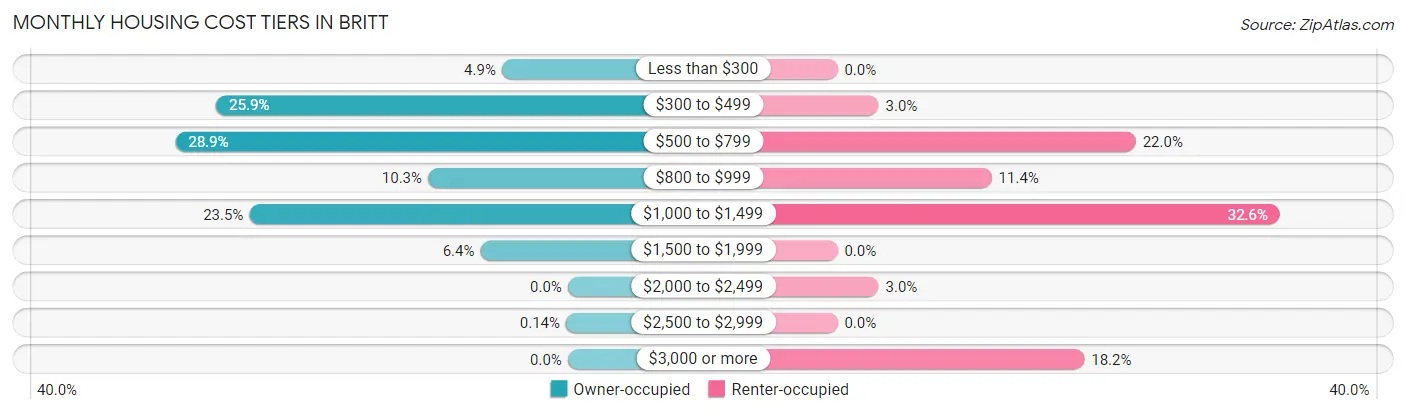
| Monthly Cost | Owner-occupied | Renter-occupied |
| Less than $300 | 34 (4.9%) | 0 (0.0%) |
| $300 to $499 | 181 (25.9%) | 4 (3.0%) |
| $500 to $799 | 202 (28.9%) | 29 (22.0%) |
| $800 to $999 | 72 (10.3%) | 15 (11.4%) |
| $1,000 to $1,499 | 164 (23.5%) | 43 (32.6%) |
| $1,500 to $1,999 | 45 (6.4%) | 0 (0.0%) |
| $2,000 to $2,499 | 0 (0.0%) | 4 (3.0%) |
| $2,500 to $2,999 | 1 (0.1%) | 0 (0.0%) |
| $3,000 or more | 0 (0.0%) | 24 (18.2%) |
| Total | 699 (100.0%) | 132 (100.0%) |
Physical Housing Characteristics in Britt
Housing Structures in Britt
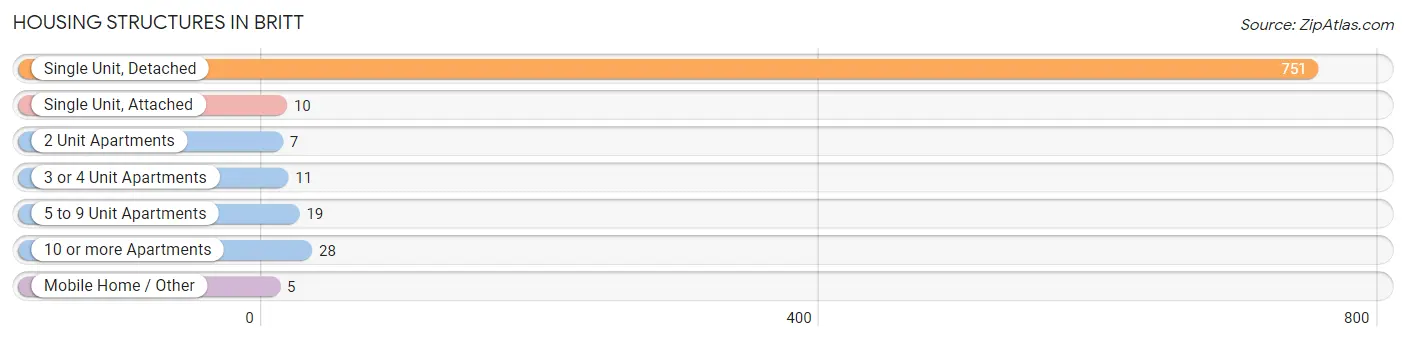
| Structure Type | # Housing Units | % Housing Units |
| Single Unit, Detached | 751 | 90.4% |
| Single Unit, Attached | 10 | 1.2% |
| 2 Unit Apartments | 7 | 0.8% |
| 3 or 4 Unit Apartments | 11 | 1.3% |
| 5 to 9 Unit Apartments | 19 | 2.3% |
| 10 or more Apartments | 28 | 3.4% |
| Mobile Home / Other | 5 | 0.6% |
| Total | 831 | 100.0% |
Housing Structures by Occupancy in Britt
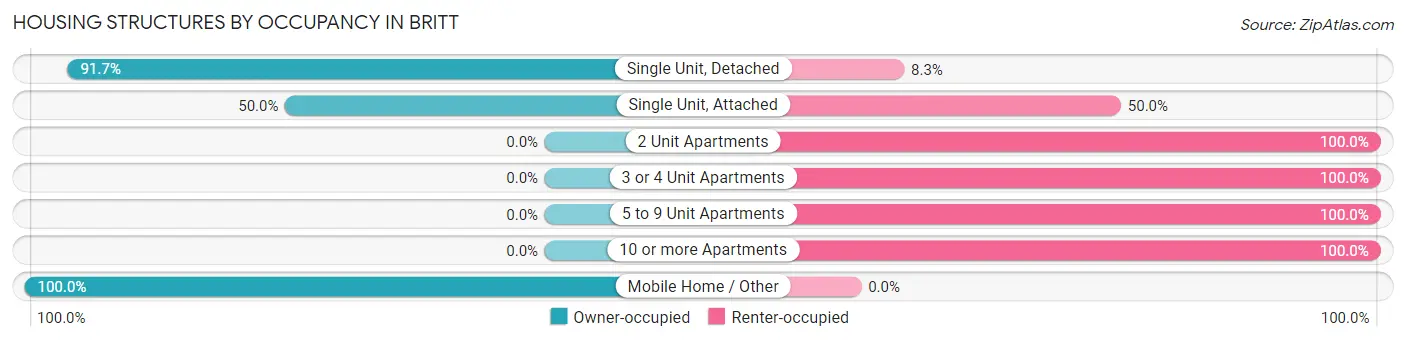
| Structure Type | Owner-occupied | Renter-occupied |
| Single Unit, Detached | 689 (91.7%) | 62 (8.3%) |
| Single Unit, Attached | 5 (50.0%) | 5 (50.0%) |
| 2 Unit Apartments | 0 (0.0%) | 7 (100.0%) |
| 3 or 4 Unit Apartments | 0 (0.0%) | 11 (100.0%) |
| 5 to 9 Unit Apartments | 0 (0.0%) | 19 (100.0%) |
| 10 or more Apartments | 0 (0.0%) | 28 (100.0%) |
| Mobile Home / Other | 5 (100.0%) | 0 (0.0%) |
| Total | 699 (84.1%) | 132 (15.9%) |
Housing Structures by Number of Rooms in Britt
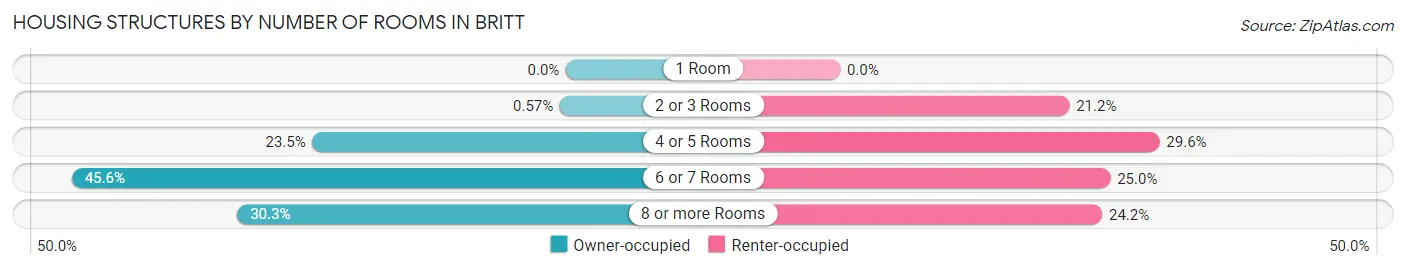
| Number of Rooms | Owner-occupied | Renter-occupied |
| 1 Room | 0 (0.0%) | 0 (0.0%) |
| 2 or 3 Rooms | 4 (0.6%) | 28 (21.2%) |
| 4 or 5 Rooms | 164 (23.5%) | 39 (29.5%) |
| 6 or 7 Rooms | 319 (45.6%) | 33 (25.0%) |
| 8 or more Rooms | 212 (30.3%) | 32 (24.2%) |
| Total | 699 (100.0%) | 132 (100.0%) |
Housing Structure by Heating Type in Britt
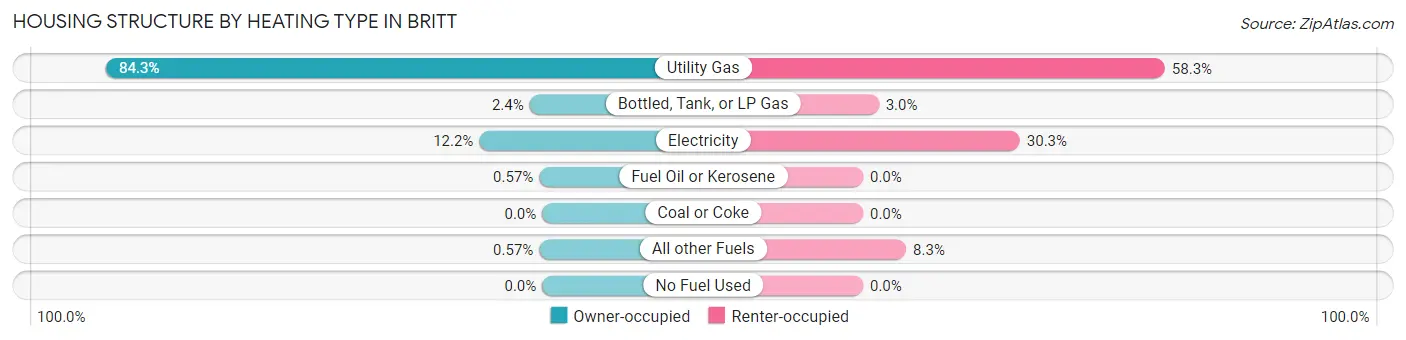
| Heating Type | Owner-occupied | Renter-occupied |
| Utility Gas | 589 (84.3%) | 77 (58.3%) |
| Bottled, Tank, or LP Gas | 17 (2.4%) | 4 (3.0%) |
| Electricity | 85 (12.2%) | 40 (30.3%) |
| Fuel Oil or Kerosene | 4 (0.6%) | 0 (0.0%) |
| Coal or Coke | 0 (0.0%) | 0 (0.0%) |
| All other Fuels | 4 (0.6%) | 11 (8.3%) |
| No Fuel Used | 0 (0.0%) | 0 (0.0%) |
| Total | 699 (100.0%) | 132 (100.0%) |
Household Vehicle Usage in Britt
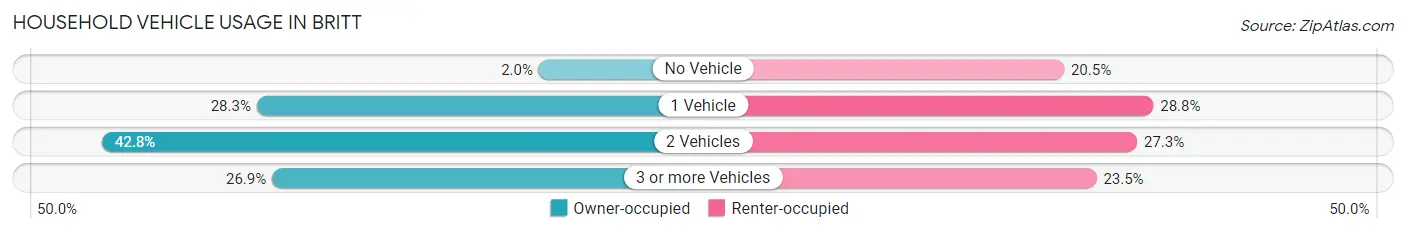
| Vehicles per Household | Owner-occupied | Renter-occupied |
| No Vehicle | 14 (2.0%) | 27 (20.4%) |
| 1 Vehicle | 198 (28.3%) | 38 (28.8%) |
| 2 Vehicles | 299 (42.8%) | 36 (27.3%) |
| 3 or more Vehicles | 188 (26.9%) | 31 (23.5%) |
| Total | 699 (100.0%) | 132 (100.0%) |
Real Estate & Mortgages in Britt
Real Estate and Mortgage Overview in Britt
| Characteristic | Without Mortgage | With Mortgage |
| Housing Units | 359 | 340 |
| Median Property Value | $93,500 | $104,000 |
| Median Household Income | $59,485 | $47 |
| Monthly Housing Costs | $456 | $0 |
| Real Estate Taxes | $1,454 | $19 |
Property Value by Mortgage Status in Britt
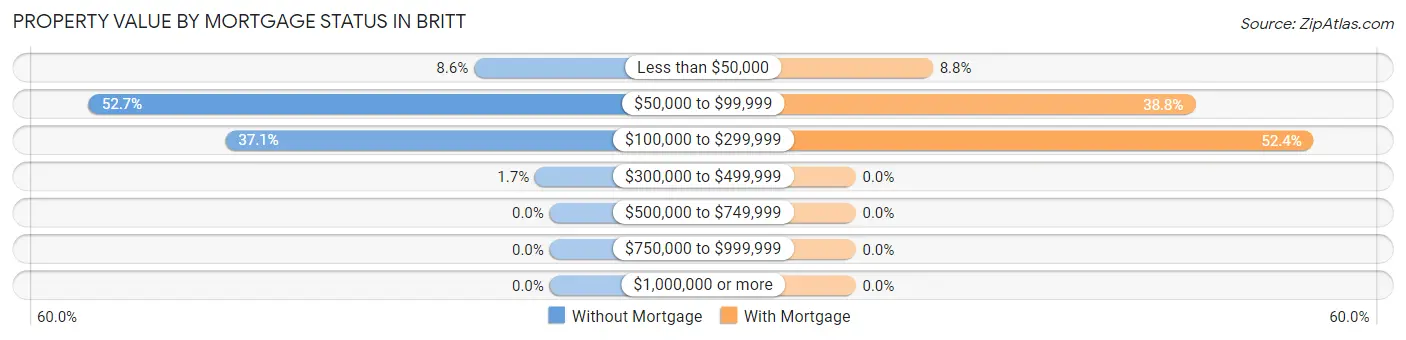
| Property Value | Without Mortgage | With Mortgage |
| Less than $50,000 | 31 (8.6%) | 30 (8.8%) |
| $50,000 to $99,999 | 189 (52.6%) | 132 (38.8%) |
| $100,000 to $299,999 | 133 (37.0%) | 178 (52.3%) |
| $300,000 to $499,999 | 6 (1.7%) | 0 (0.0%) |
| $500,000 to $749,999 | 0 (0.0%) | 0 (0.0%) |
| $750,000 to $999,999 | 0 (0.0%) | 0 (0.0%) |
| $1,000,000 or more | 0 (0.0%) | 0 (0.0%) |
| Total | 359 (100.0%) | 340 (100.0%) |
Household Income by Mortgage Status in Britt
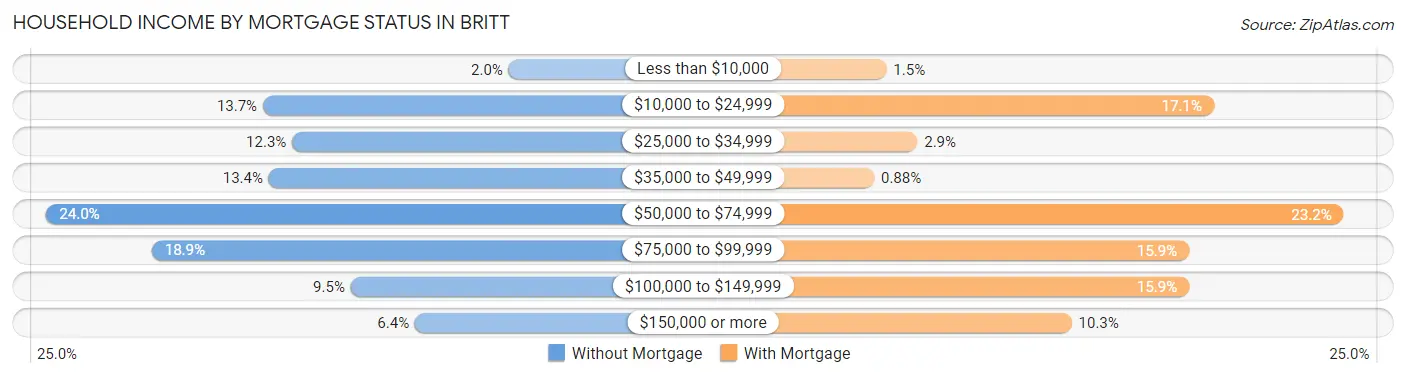
| Household Income | Without Mortgage | With Mortgage |
| Less than $10,000 | 7 (1.9%) | 5 (1.5%) |
| $10,000 to $24,999 | 49 (13.7%) | 58 (17.1%) |
| $25,000 to $34,999 | 44 (12.3%) | 10 (2.9%) |
| $35,000 to $49,999 | 48 (13.4%) | 3 (0.9%) |
| $50,000 to $74,999 | 86 (24.0%) | 79 (23.2%) |
| $75,000 to $99,999 | 68 (18.9%) | 54 (15.9%) |
| $100,000 to $149,999 | 34 (9.5%) | 54 (15.9%) |
| $150,000 or more | 23 (6.4%) | 35 (10.3%) |
| Total | 359 (100.0%) | 340 (100.0%) |
Property Value to Household Income Ratio in Britt
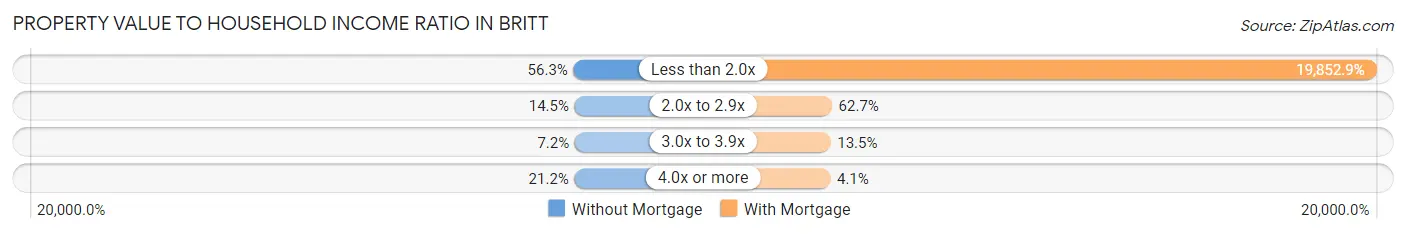
| Value-to-Income Ratio | Without Mortgage | With Mortgage |
| Less than 2.0x | 202 (56.3%) | 67,500 (19,852.9%) |
| 2.0x to 2.9x | 52 (14.5%) | 213 (62.6%) |
| 3.0x to 3.9x | 26 (7.2%) | 46 (13.5%) |
| 4.0x or more | 76 (21.2%) | 14 (4.1%) |
| Total | 359 (100.0%) | 340 (100.0%) |
Real Estate Taxes by Mortgage Status in Britt
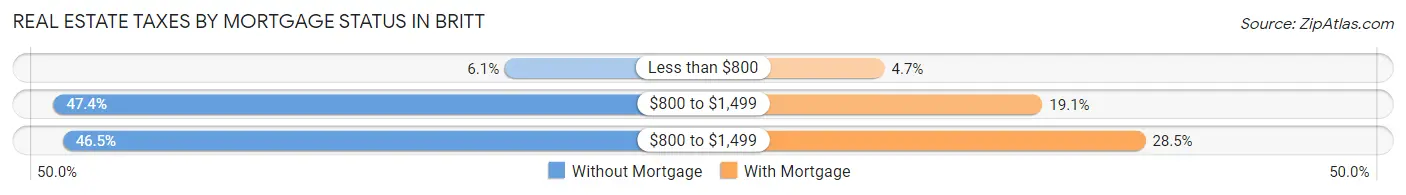
| Property Taxes | Without Mortgage | With Mortgage |
| Less than $800 | 22 (6.1%) | 16 (4.7%) |
| $800 to $1,499 | 170 (47.3%) | 65 (19.1%) |
| $800 to $1,499 | 167 (46.5%) | 97 (28.5%) |
| Total | 359 (100.0%) | 340 (100.0%) |
Health & Disability in Britt
Health Insurance Coverage by Age in Britt
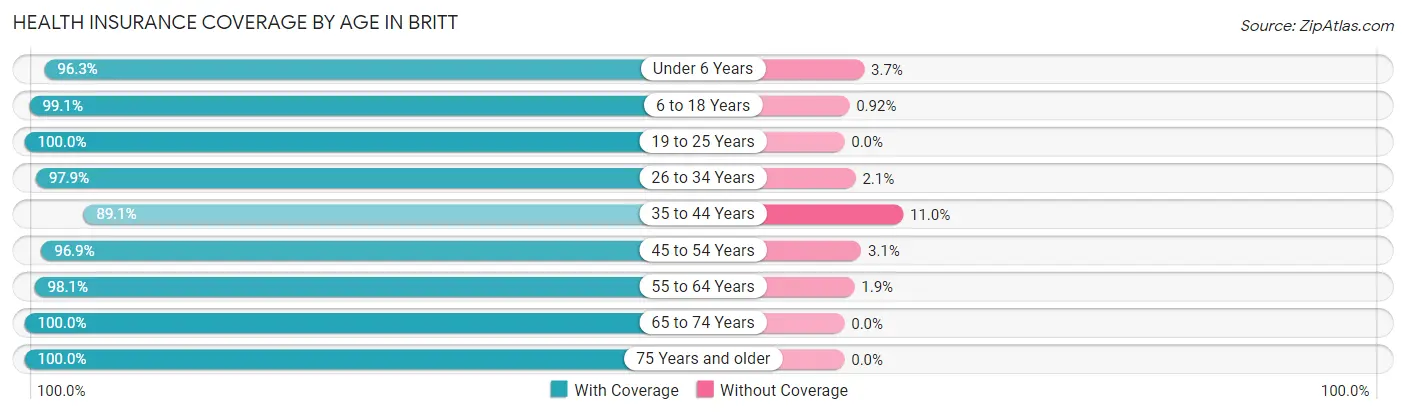
| Age Bracket | With Coverage | Without Coverage |
| Under 6 Years | 78 (96.3%) | 3 (3.7%) |
| 6 to 18 Years | 322 (99.1%) | 3 (0.9%) |
| 19 to 25 Years | 151 (100.0%) | 0 (0.0%) |
| 26 to 34 Years | 187 (97.9%) | 4 (2.1%) |
| 35 to 44 Years | 179 (89.0%) | 22 (11.0%) |
| 45 to 54 Years | 186 (96.9%) | 6 (3.1%) |
| 55 to 64 Years | 210 (98.1%) | 4 (1.9%) |
| 65 to 74 Years | 184 (100.0%) | 0 (0.0%) |
| 75 Years and older | 274 (100.0%) | 0 (0.0%) |
| Total | 1,771 (97.7%) | 42 (2.3%) |
Health Insurance Coverage by Citizenship Status in Britt
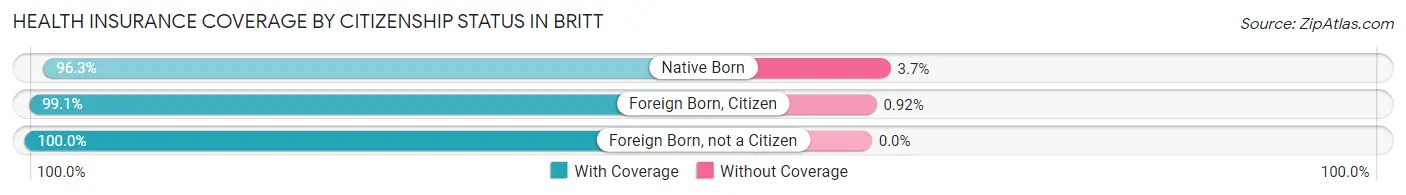
| Citizenship Status | With Coverage | Without Coverage |
| Native Born | 78 (96.3%) | 3 (3.7%) |
| Foreign Born, Citizen | 322 (99.1%) | 3 (0.9%) |
| Foreign Born, not a Citizen | 151 (100.0%) | 0 (0.0%) |
Health Insurance Coverage by Household Income in Britt
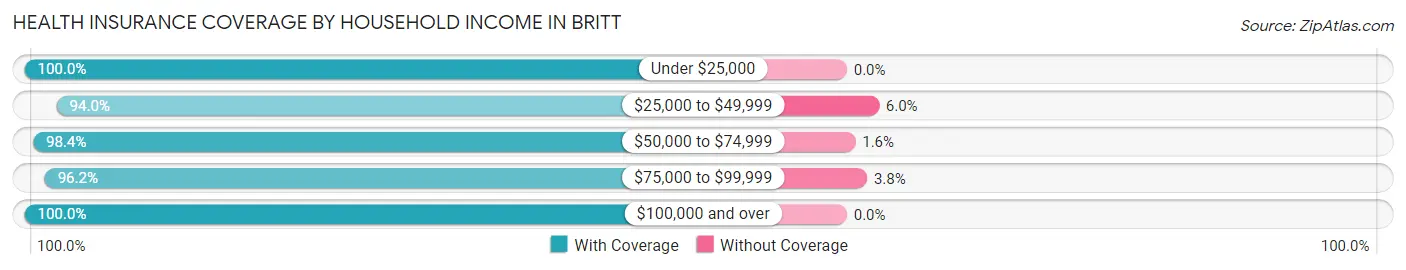
| Household Income | With Coverage | Without Coverage |
| Under $25,000 | 203 (100.0%) | 0 (0.0%) |
| $25,000 to $49,999 | 313 (94.0%) | 20 (6.0%) |
| $50,000 to $74,999 | 432 (98.4%) | 7 (1.6%) |
| $75,000 to $99,999 | 382 (96.2%) | 15 (3.8%) |
| $100,000 and over | 441 (100.0%) | 0 (0.0%) |
Public vs Private Health Insurance Coverage by Age in Britt
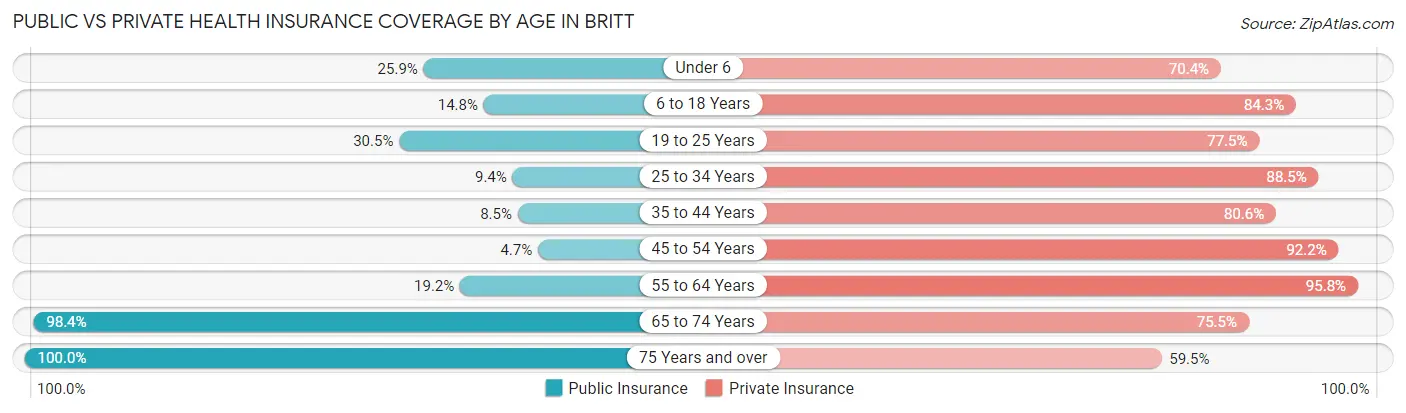
| Age Bracket | Public Insurance | Private Insurance |
| Under 6 | 21 (25.9%) | 57 (70.4%) |
| 6 to 18 Years | 48 (14.8%) | 274 (84.3%) |
| 19 to 25 Years | 46 (30.5%) | 117 (77.5%) |
| 25 to 34 Years | 18 (9.4%) | 169 (88.5%) |
| 35 to 44 Years | 17 (8.5%) | 162 (80.6%) |
| 45 to 54 Years | 9 (4.7%) | 177 (92.2%) |
| 55 to 64 Years | 41 (19.2%) | 205 (95.8%) |
| 65 to 74 Years | 181 (98.4%) | 139 (75.5%) |
| 75 Years and over | 274 (100.0%) | 163 (59.5%) |
| Total | 655 (36.1%) | 1,463 (80.7%) |
Disability Status by Sex by Age in Britt
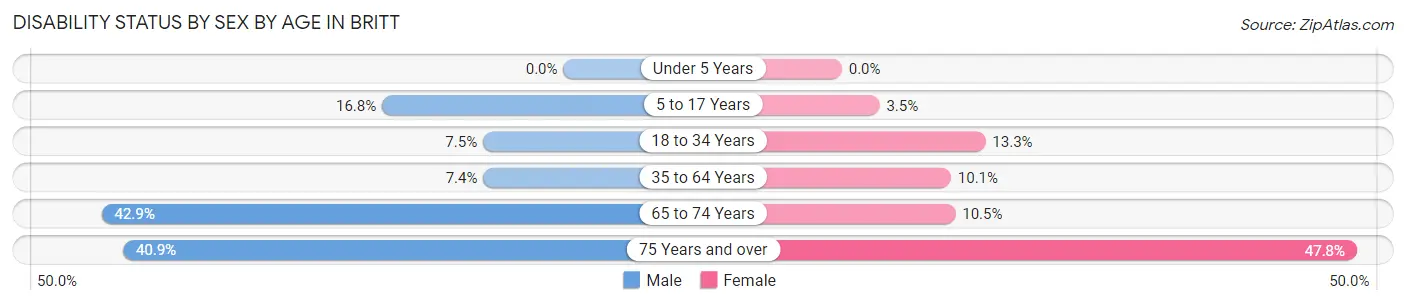
| Age Bracket | Male | Female |
| Under 5 Years | 0 (0.0%) | 0 (0.0%) |
| 5 to 17 Years | 17 (16.8%) | 7 (3.5%) |
| 18 to 34 Years | 15 (7.5%) | 22 (13.3%) |
| 35 to 64 Years | 26 (7.4%) | 26 (10.1%) |
| 65 to 74 Years | 30 (42.9%) | 12 (10.5%) |
| 75 Years and over | 47 (40.9%) | 76 (47.8%) |
Disability Class by Sex by Age in Britt
Disability Class: Hearing Difficulty
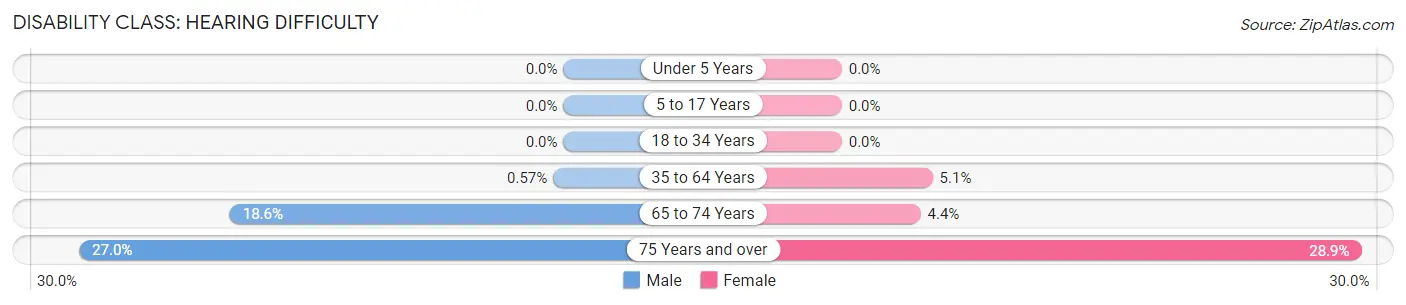
| Age Bracket | Male | Female |
| Under 5 Years | 0 (0.0%) | 0 (0.0%) |
| 5 to 17 Years | 0 (0.0%) | 0 (0.0%) |
| 18 to 34 Years | 0 (0.0%) | 0 (0.0%) |
| 35 to 64 Years | 2 (0.6%) | 13 (5.1%) |
| 65 to 74 Years | 13 (18.6%) | 5 (4.4%) |
| 75 Years and over | 31 (27.0%) | 46 (28.9%) |
Disability Class: Vision Difficulty
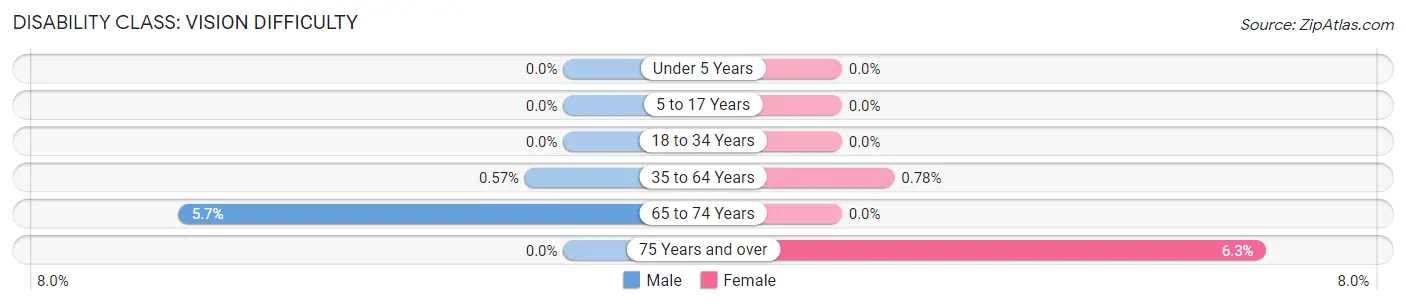
| Age Bracket | Male | Female |
| Under 5 Years | 0 (0.0%) | 0 (0.0%) |
| 5 to 17 Years | 0 (0.0%) | 0 (0.0%) |
| 18 to 34 Years | 0 (0.0%) | 0 (0.0%) |
| 35 to 64 Years | 2 (0.6%) | 2 (0.8%) |
| 65 to 74 Years | 4 (5.7%) | 0 (0.0%) |
| 75 Years and over | 0 (0.0%) | 10 (6.3%) |
Disability Class: Cognitive Difficulty
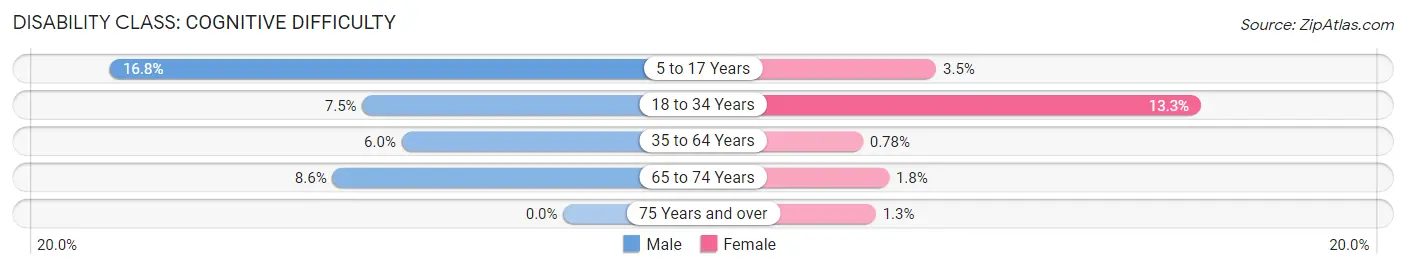
| Age Bracket | Male | Female |
| 5 to 17 Years | 17 (16.8%) | 7 (3.5%) |
| 18 to 34 Years | 15 (7.5%) | 22 (13.3%) |
| 35 to 64 Years | 21 (6.0%) | 2 (0.8%) |
| 65 to 74 Years | 6 (8.6%) | 2 (1.8%) |
| 75 Years and over | 0 (0.0%) | 2 (1.3%) |
Disability Class: Ambulatory Difficulty
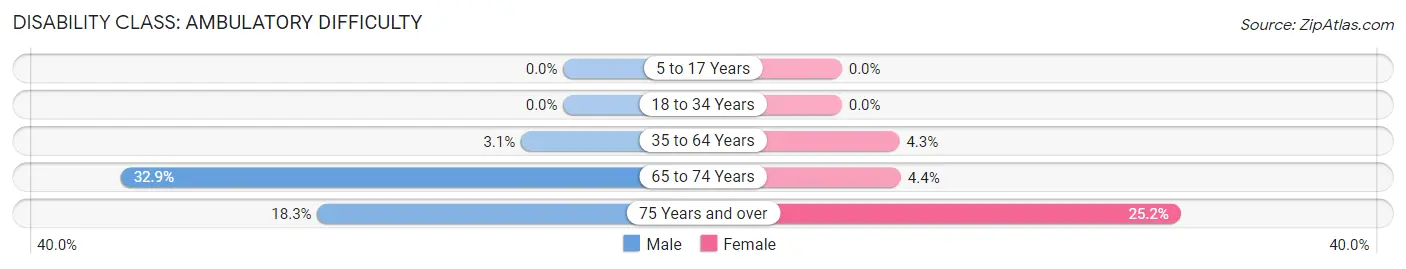
| Age Bracket | Male | Female |
| 5 to 17 Years | 0 (0.0%) | 0 (0.0%) |
| 18 to 34 Years | 0 (0.0%) | 0 (0.0%) |
| 35 to 64 Years | 11 (3.1%) | 11 (4.3%) |
| 65 to 74 Years | 23 (32.9%) | 5 (4.4%) |
| 75 Years and over | 21 (18.3%) | 40 (25.2%) |
Disability Class: Self-Care Difficulty
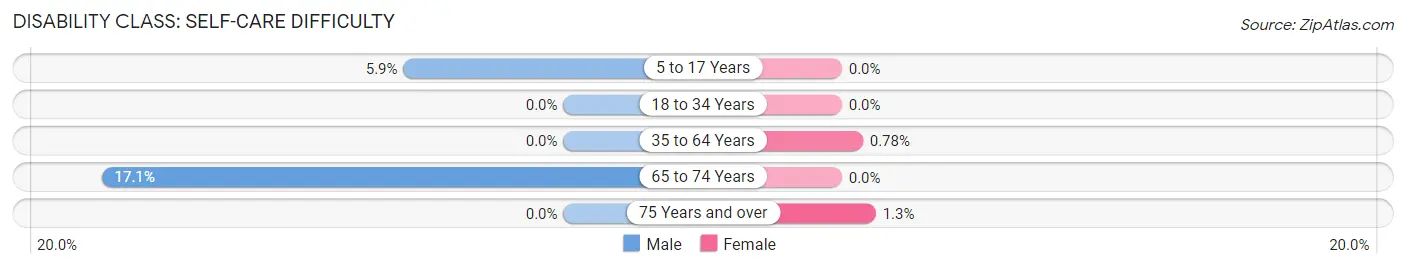
| Age Bracket | Male | Female |
| 5 to 17 Years | 6 (5.9%) | 0 (0.0%) |
| 18 to 34 Years | 0 (0.0%) | 0 (0.0%) |
| 35 to 64 Years | 0 (0.0%) | 2 (0.8%) |
| 65 to 74 Years | 12 (17.1%) | 0 (0.0%) |
| 75 Years and over | 0 (0.0%) | 2 (1.3%) |
Technology Access in Britt
Computing Device Access in Britt
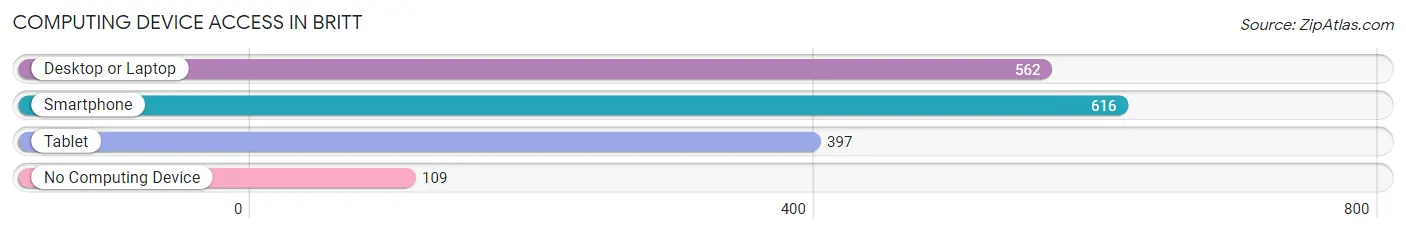
| Device Type | # Households | % Households |
| Desktop or Laptop | 562 | 67.6% |
| Smartphone | 616 | 74.1% |
| Tablet | 397 | 47.8% |
| No Computing Device | 109 | 13.1% |
| Total | 831 | 100.0% |
Internet Access in Britt
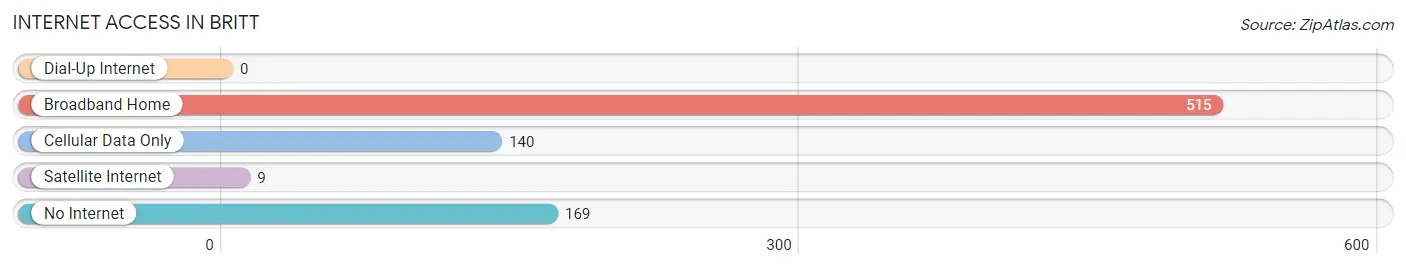
| Internet Type | # Households | % Households |
| Dial-Up Internet | 0 | 0.0% |
| Broadband Home | 515 | 62.0% |
| Cellular Data Only | 140 | 16.9% |
| Satellite Internet | 9 | 1.1% |
| No Internet | 169 | 20.3% |
| Total | 831 | 100.0% |
Britt Summary
Britt, Iowa is a small city located in Hancock County in the state of Iowa. It is situated on the banks of the Shell Rock River and is home to a population of approximately 2,000 people. The city is known for its rich history, diverse geography, and vibrant economy.
History
The city of Britt was founded in 1856 by a group of settlers from New York. The settlers were led by William Britt, who named the city after himself. The city was incorporated in 1872 and quickly grew to become a thriving agricultural center. The city was home to a variety of businesses, including a flour mill, a sawmill, and a brickyard.
In the late 19th century, the city was a major stop on the Chicago, Milwaukee, and St. Paul Railroad. This allowed the city to become a major shipping hub for the surrounding area. The railroad also helped to bring in new businesses and industries, such as a creamery, a canning factory, and a furniture factory.
The city experienced a period of growth in the early 20th century, with the construction of a new school, a library, and a hospital. The city also became a popular tourist destination, with the opening of a number of resorts and hotels.
Geography
Britt is located in the north-central part of Iowa, approximately 50 miles north of Des Moines. The city is situated on the banks of the Shell Rock River and is surrounded by rolling hills and farmland. The city is located in a temperate climate, with hot summers and cold winters.
The city is home to a variety of parks and recreational areas, including a golf course, a swimming pool, and a skate park. The city also has a number of historic sites, including the Britt Historical Museum and the Britt Opera House.
Economy
The economy of Britt is largely based on agriculture and manufacturing. The city is home to a number of agricultural businesses, including a feed mill, a grain elevator, and a dairy. The city is also home to a number of manufacturing businesses, including a furniture factory, a canning factory, and a printing company.
The city is also home to a number of retail businesses, including a grocery store, a hardware store, and a variety of restaurants. The city is also home to a number of service businesses, including a bank, a post office, and a number of medical offices.
Demographics
As of the 2010 census, the population of Britt was 2,000. The population is largely white, with a small percentage of African Americans, Hispanics, and Asians. The median household income is $41,000, and the median home value is $90,000. The city has a low unemployment rate of 3.5%.
The city is served by the Britt-Hancock County School District, which includes two elementary schools, a middle school, and a high school. The city is also home to a number of churches, including the First United Methodist Church and the St. Paul Lutheran Church.
Conclusion
Britt, Iowa is a small city located in Hancock County in the state of Iowa. It is situated on the banks of the Shell Rock River and is home to a population of approximately 2,000 people. The city is known for its rich history, diverse geography, and vibrant economy. The city is home to a variety of businesses, including agricultural businesses, manufacturing businesses, and retail businesses. The city is also home to a number of parks and recreational areas, as well as a number of historic sites. The city has a median household income of $41,000 and a median home value of $90,000. The city is served by the Britt-Hancock County School District and is home to a number of churches.
Common Questions
What is Per Capita Income in Britt?
Per Capita income in Britt is $31,410.
What is the Median Family Income in Britt?
Median Family Income in Britt is $70,417.
What is the Median Household income in Britt?
Median Household Income in Britt is $59,805.
What is Income or Wage Gap in Britt?
Income or Wage Gap in Britt is 30.3%.
Women in Britt earn 69.7 cents for every dollar earned by a man.
What is Inequality or Gini Index in Britt?
Inequality or Gini Index in Britt is 0.42.
What is the Total Population of Britt?
Total Population of Britt is 1,921.
What is the Total Male Population of Britt?
Total Male Population of Britt is 933.
What is the Total Female Population of Britt?
Total Female Population of Britt is 988.
What is the Ratio of Males per 100 Females in Britt?
There are 94.43 Males per 100 Females in Britt.
What is the Ratio of Females per 100 Males in Britt?
There are 105.89 Females per 100 Males in Britt.
What is the Median Population Age in Britt?
Median Population Age in Britt is 45.3 Years.
What is the Average Family Size in Britt
Average Family Size in Britt is 2.7 People.
What is the Average Household Size in Britt
Average Household Size in Britt is 2.2 People.
How Large is the Labor Force in Britt?
There are 925 People in the Labor Forcein in Britt.
What is the Percentage of People in the Labor Force in Britt?
57.8% of People are in the Labor Force in Britt.
What is the Unemployment Rate in Britt?
Unemployment Rate in Britt is 3.5%.