Randalia, IA Map & Demographics
Randalia Map
Randalia Overview
$20,371
PER CAPITA INCOME
$73,750
AVG FAMILY INCOME
$34,643
AVG HOUSEHOLD INCOME
11.8%
WAGE / INCOME GAP [ % ]
88.2¢/ $1
WAGE / INCOME GAP [ $ ]
0.41
INEQUALITY / GINI INDEX
65
TOTAL POPULATION
29
MALE POPULATION
36
FEMALE POPULATION
80.56
MALES / 100 FEMALES
124.14
FEMALES / 100 MALES
48.4
MEDIAN AGE
3.1
AVG FAMILY SIZE
2.0
AVG HOUSEHOLD SIZE
33
LABOR FORCE [ PEOPLE ]
68.8%
PERCENT IN LABOR FORCE
12.1%
UNEMPLOYMENT RATE
Randalia Zip Codes
Randalia Area Codes
Income in Randalia
Income Overview in Randalia
Per Capita Income in Randalia is $20,371, while median incomes of families and households are $73,750 and $34,643 respectively.
| Characteristic | Number | Measure |
| Per Capita Income | 65 | $20,371 |
| Median Family Income | 14 | $73,750 |
| Mean Family Income | 14 | $59,921 |
| Median Household Income | 32 | $34,643 |
| Mean Household Income | 32 | $41,769 |
| Income Deficit | 14 | $0 |
| Wage / Income Gap (%) | 65 | 11.83% |
| Wage / Income Gap ($) | 65 | 88.17¢ per $1 |
| Gini / Inequality Index | 65 | 0.41 |
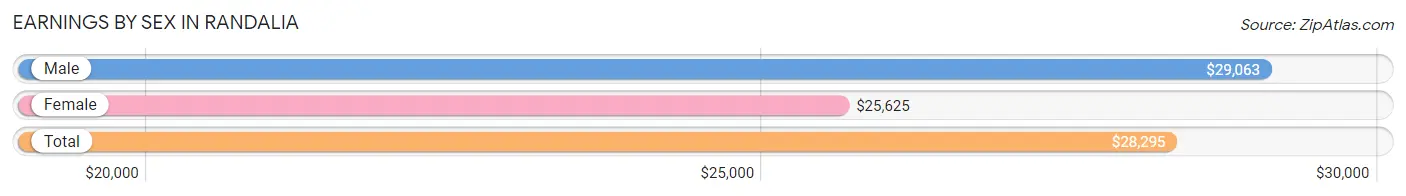
Earnings by Sex in Randalia
Average Earnings in Randalia are $28,295, $29,063 for men and $25,625 for women, a difference of 11.8%.
| Sex | Number | Average Earnings |
| Male | 22 (59.5%) | $29,063 |
| Female | 15 (40.5%) | $25,625 |
| Total | 37 (100.0%) | $28,295 |
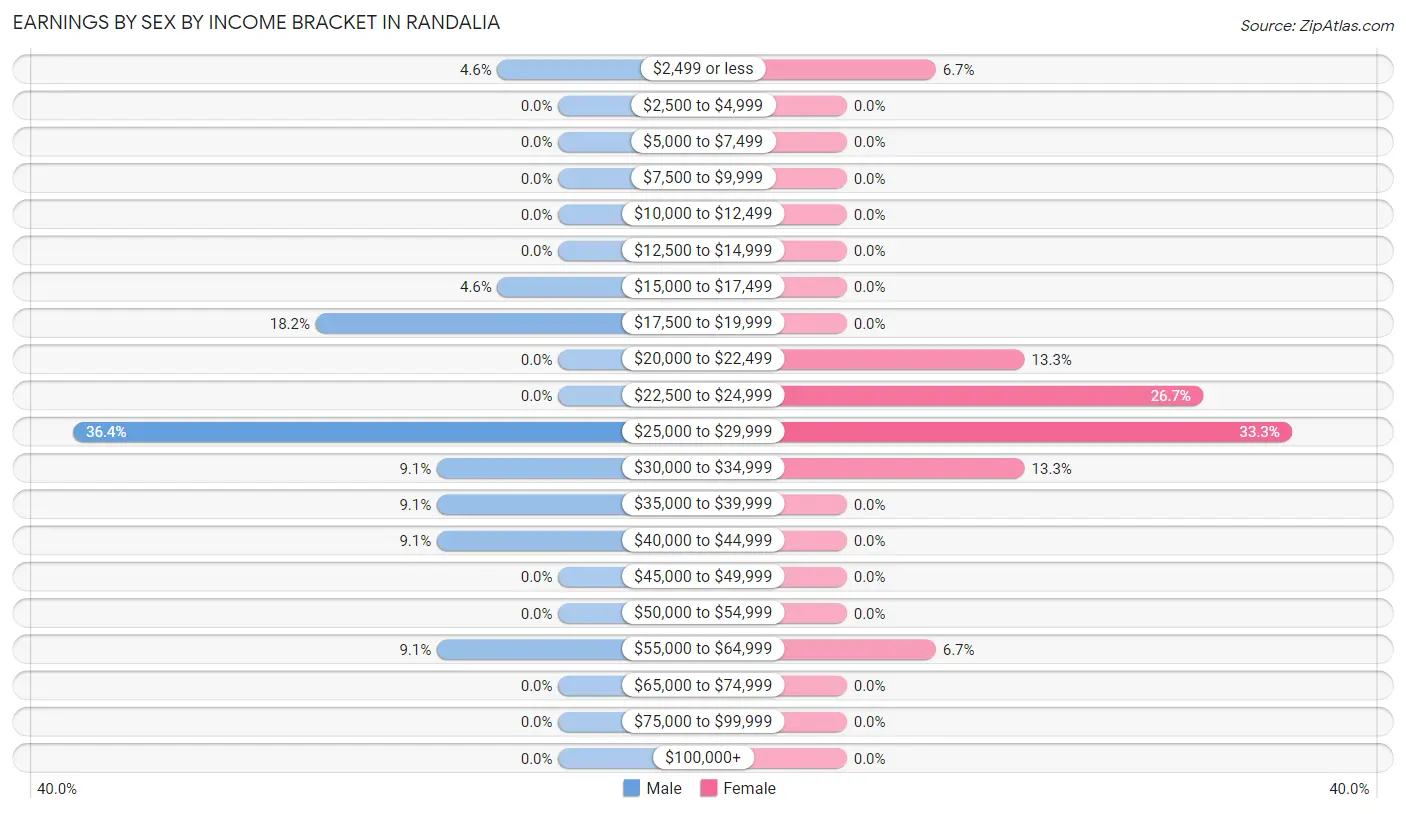
Earnings by Sex by Income Bracket in Randalia
The most common earnings brackets in Randalia are $25,000 to $29,999 for men (8 | 36.4%) and $25,000 to $29,999 for women (5 | 33.3%).
| Income | Male | Female |
| $2,499 or less | 1 (4.5%) | 1 (6.7%) |
| $2,500 to $4,999 | 0 (0.0%) | 0 (0.0%) |
| $5,000 to $7,499 | 0 (0.0%) | 0 (0.0%) |
| $7,500 to $9,999 | 0 (0.0%) | 0 (0.0%) |
| $10,000 to $12,499 | 0 (0.0%) | 0 (0.0%) |
| $12,500 to $14,999 | 0 (0.0%) | 0 (0.0%) |
| $15,000 to $17,499 | 1 (4.5%) | 0 (0.0%) |
| $17,500 to $19,999 | 4 (18.2%) | 0 (0.0%) |
| $20,000 to $22,499 | 0 (0.0%) | 2 (13.3%) |
| $22,500 to $24,999 | 0 (0.0%) | 4 (26.7%) |
| $25,000 to $29,999 | 8 (36.4%) | 5 (33.3%) |
| $30,000 to $34,999 | 2 (9.1%) | 2 (13.3%) |
| $35,000 to $39,999 | 2 (9.1%) | 0 (0.0%) |
| $40,000 to $44,999 | 2 (9.1%) | 0 (0.0%) |
| $45,000 to $49,999 | 0 (0.0%) | 0 (0.0%) |
| $50,000 to $54,999 | 0 (0.0%) | 0 (0.0%) |
| $55,000 to $64,999 | 2 (9.1%) | 1 (6.7%) |
| $65,000 to $74,999 | 0 (0.0%) | 0 (0.0%) |
| $75,000 to $99,999 | 0 (0.0%) | 0 (0.0%) |
| $100,000+ | 0 (0.0%) | 0 (0.0%) |
| Total | 22 (100.0%) | 15 (100.0%) |
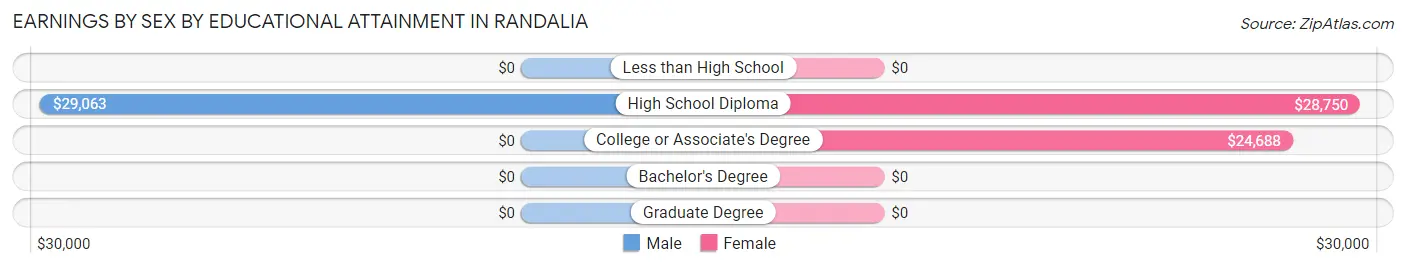
Earnings by Sex by Educational Attainment in Randalia
Average earnings in Randalia are $28,750 for men and $25,625 for women, a difference of 10.9%. Men with an educational attainment of high school diploma enjoy the highest average annual earnings of $29,063, while those with high school diploma education earn the least with $29,063. Women with an educational attainment of high school diploma earn the most with the average annual earnings of $28,750, while those with college or associate's degree education have the smallest earnings of $24,688.
| Educational Attainment | Male Income | Female Income |
| Less than High School | - | - |
| High School Diploma | $29,063 | $28,750 |
| College or Associate's Degree | - | - |
| Bachelor's Degree | - | - |
| Graduate Degree | - | - |
| Total | $28,750 | $25,625 |
Family Income in Randalia
Family Income Brackets in Randalia
According to the Randalia family income data, there are 6 families falling into the $75,000 to $99,999 income range, which is the most common income bracket and makes up 42.9% of all families.
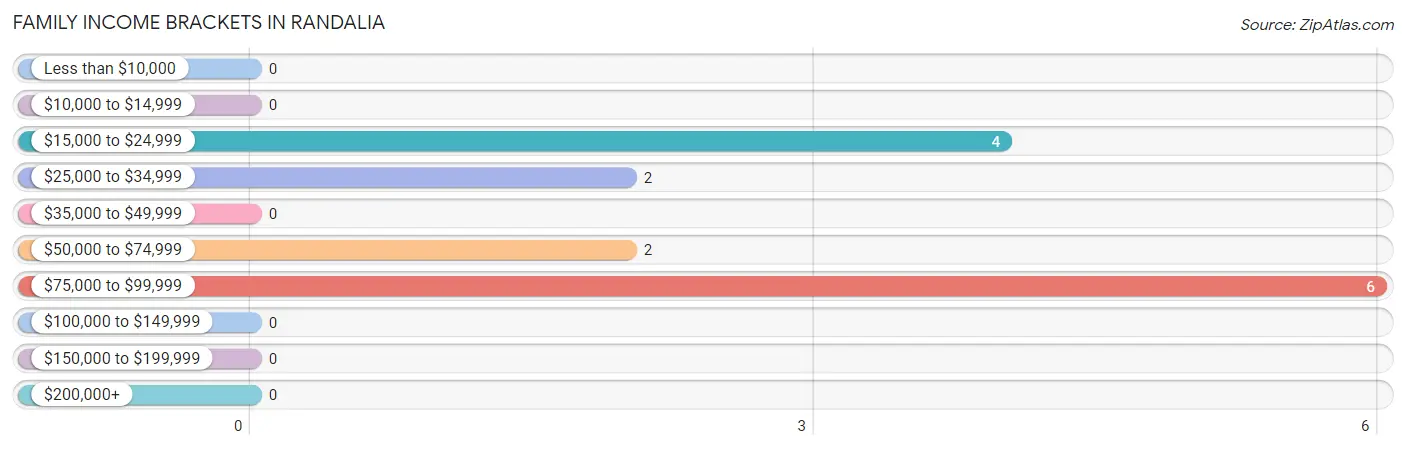
| Income Bracket | # Families | % Families |
| Less than $10,000 | 0 | 0.0% |
| $10,000 to $14,999 | 0 | 0.0% |
| $15,000 to $24,999 | 4 | 28.6% |
| $25,000 to $34,999 | 2 | 14.3% |
| $35,000 to $49,999 | 0 | 0.0% |
| $50,000 to $74,999 | 2 | 14.3% |
| $75,000 to $99,999 | 6 | 42.9% |
| $100,000 to $149,999 | 0 | 0.0% |
| $150,000 to $199,999 | 0 | 0.0% |
| $200,000+ | 0 | 0.0% |
Family Income by Famaliy Size in Randalia
3-person families (5 | 35.7%) account for the highest median family income in Randalia with $92,917 per family, while 2-person families (5 | 35.7%) have the highest median income of $40,625 per family member.
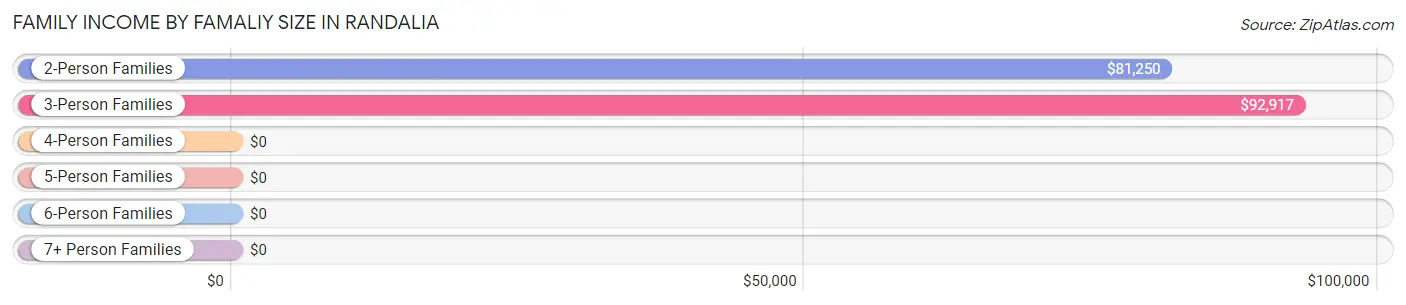
| Income Bracket | # Families | Median Income |
| 2-Person Families | 5 (35.7%) | $81,250 |
| 3-Person Families | 5 (35.7%) | $92,917 |
| 4-Person Families | 4 (28.6%) | $0 |
| 5-Person Families | 0 (0.0%) | $0 |
| 6-Person Families | 0 (0.0%) | $0 |
| 7+ Person Families | 0 (0.0%) | $0 |
| Total | 14 (100.0%) | $73,750 |
Family Income by Number of Earners in Randalia
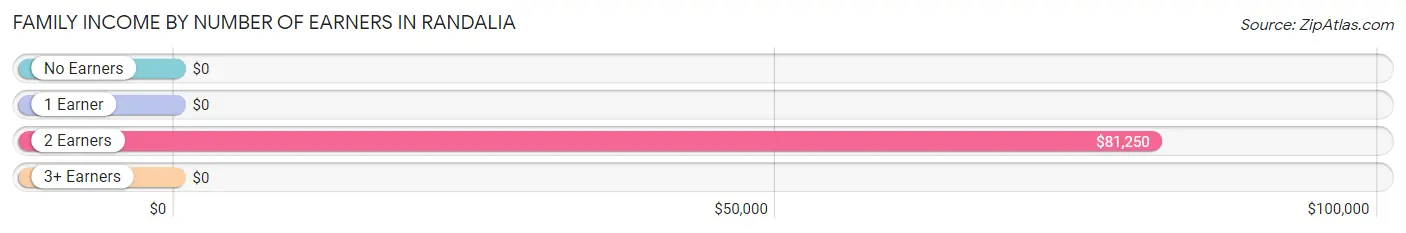
| Number of Earners | # Families | Median Income |
| No Earners | 0 (0.0%) | $0 |
| 1 Earner | 7 (50.0%) | $0 |
| 2 Earners | 5 (35.7%) | $81,250 |
| 3+ Earners | 2 (14.3%) | $0 |
| Total | 14 (100.0%) | $73,750 |
Household Income in Randalia
Household Income Brackets in Randalia
With 8 households falling in the category, the $25,000 to $34,999 income range is the most frequent in Randalia, accounting for 25.0% of all households.
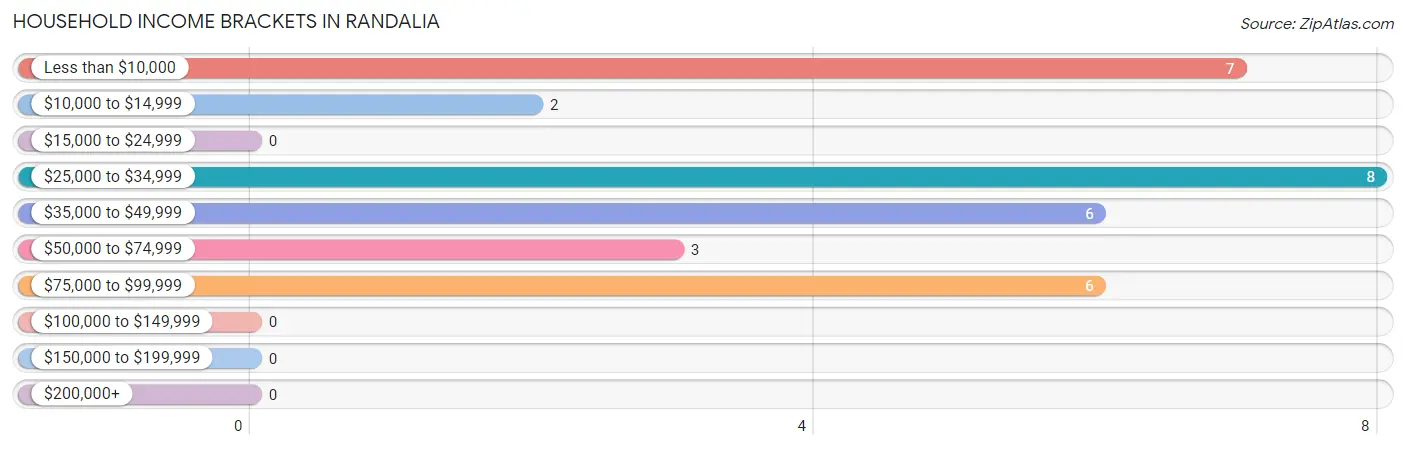
| Income Bracket | # Households | % Households |
| Less than $10,000 | 7 | 21.9% |
| $10,000 to $14,999 | 2 | 6.3% |
| $15,000 to $24,999 | 0 | 0.0% |
| $25,000 to $34,999 | 8 | 25.0% |
| $35,000 to $49,999 | 6 | 18.8% |
| $50,000 to $74,999 | 3 | 9.4% |
| $75,000 to $99,999 | 6 | 18.8% |
| $100,000 to $149,999 | 0 | 0.0% |
| $150,000 to $199,999 | 0 | 0.0% |
| $200,000+ | 0 | 0.0% |
Household Income by Householder Age in Randalia
| Income Bracket | # Households | Median Income |
| 15 to 24 Years | 0 (0.0%) | $0 |
| 25 to 44 Years | 6 (18.8%) | $0 |
| 45 to 64 Years | 14 (43.8%) | $0 |
| 65+ Years | 12 (37.5%) | $0 |
| Total | 32 (100.0%) | $34,643 |
Poverty in Randalia
Income Below Poverty by Sex and Age in Randalia
With 27.6% poverty level for males and 55.6% for females among the residents of Randalia, 25 to 34 year old males and under 5 year old females are the most vulnerable to poverty, with 4 males (100.0%) and 12 females (100.0%) in their respective age groups living below the poverty level.
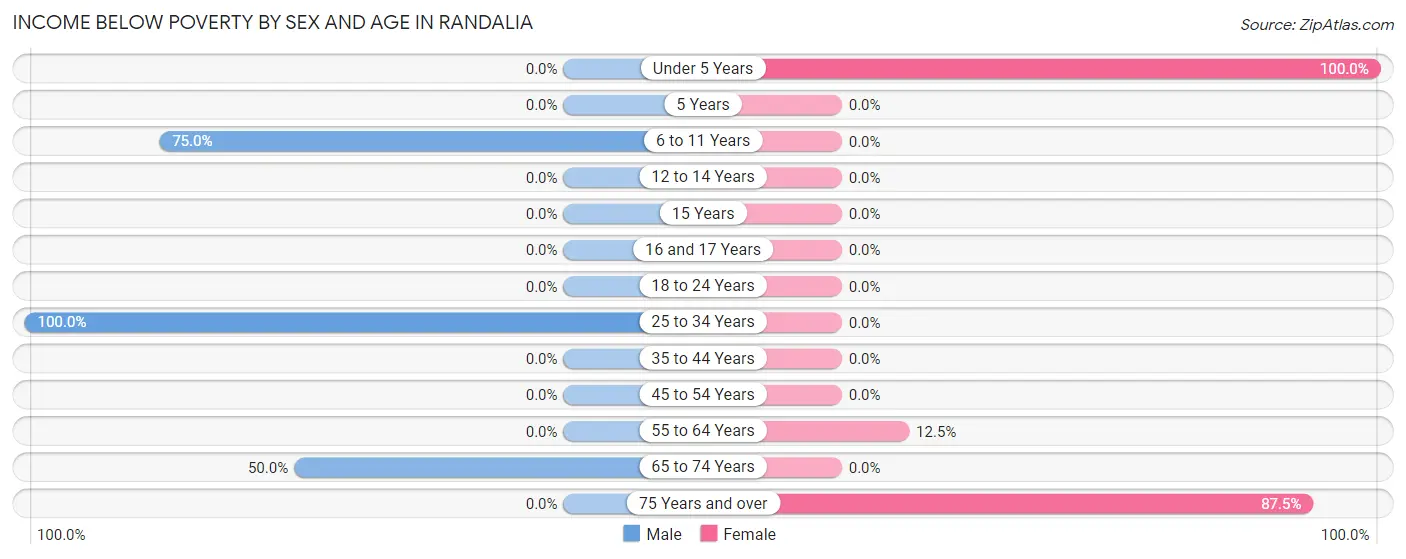
| Age Bracket | Male | Female |
| Under 5 Years | 0 (0.0%) | 12 (100.0%) |
| 5 Years | 0 (0.0%) | 0 (0.0%) |
| 6 to 11 Years | 3 (75.0%) | 0 (0.0%) |
| 12 to 14 Years | 0 (0.0%) | 0 (0.0%) |
| 15 Years | 0 (0.0%) | 0 (0.0%) |
| 16 and 17 Years | 0 (0.0%) | 0 (0.0%) |
| 18 to 24 Years | 0 (0.0%) | 0 (0.0%) |
| 25 to 34 Years | 4 (100.0%) | 0 (0.0%) |
| 35 to 44 Years | 0 (0.0%) | 0 (0.0%) |
| 45 to 54 Years | 0 (0.0%) | 0 (0.0%) |
| 55 to 64 Years | 0 (0.0%) | 1 (12.5%) |
| 65 to 74 Years | 1 (50.0%) | 0 (0.0%) |
| 75 Years and over | 0 (0.0%) | 7 (87.5%) |
| Total | 8 (27.6%) | 20 (55.6%) |
Income Above Poverty by Sex and Age in Randalia
According to the poverty statistics in Randalia, males aged 12 to 14 years and females aged 25 to 34 years are the age groups that are most secure financially, with 100.0% of males and 100.0% of females in these age groups living above the poverty line.
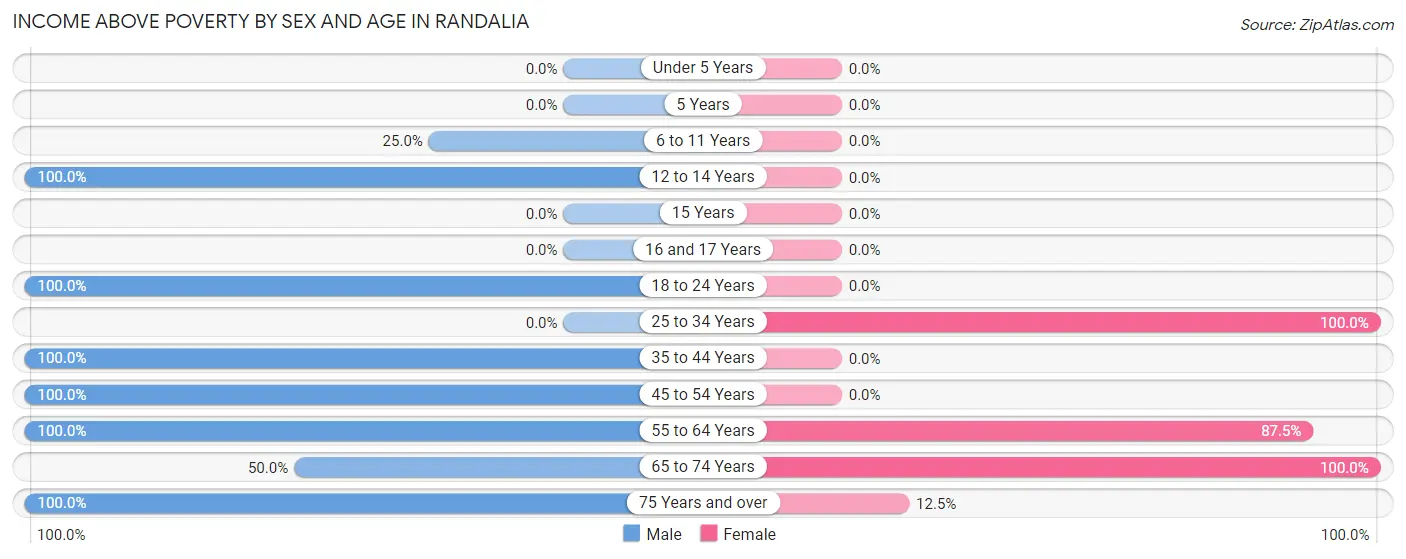
| Age Bracket | Male | Female |
| Under 5 Years | 0 (0.0%) | 0 (0.0%) |
| 5 Years | 0 (0.0%) | 0 (0.0%) |
| 6 to 11 Years | 1 (25.0%) | 0 (0.0%) |
| 12 to 14 Years | 1 (100.0%) | 0 (0.0%) |
| 15 Years | 0 (0.0%) | 0 (0.0%) |
| 16 and 17 Years | 0 (0.0%) | 0 (0.0%) |
| 18 to 24 Years | 2 (100.0%) | 0 (0.0%) |
| 25 to 34 Years | 0 (0.0%) | 5 (100.0%) |
| 35 to 44 Years | 2 (100.0%) | 0 (0.0%) |
| 45 to 54 Years | 7 (100.0%) | 0 (0.0%) |
| 55 to 64 Years | 6 (100.0%) | 7 (87.5%) |
| 65 to 74 Years | 1 (50.0%) | 3 (100.0%) |
| 75 Years and over | 1 (100.0%) | 1 (12.5%) |
| Total | 21 (72.4%) | 16 (44.4%) |
Income Below Poverty Among Married-Couple Families in Randalia
| Children | Above Poverty | Below Poverty |
| No Children | 8 (100.0%) | 0 (0.0%) |
| 1 or 2 Children | 0 (0.0%) | 0 (0.0%) |
| 3 or 4 Children | 0 (0.0%) | 0 (0.0%) |
| 5 or more Children | 0 (0.0%) | 0 (0.0%) |
| Total | 8 (100.0%) | 0 (0.0%) |
Income Below Poverty Among Single-Parent Households in Randalia
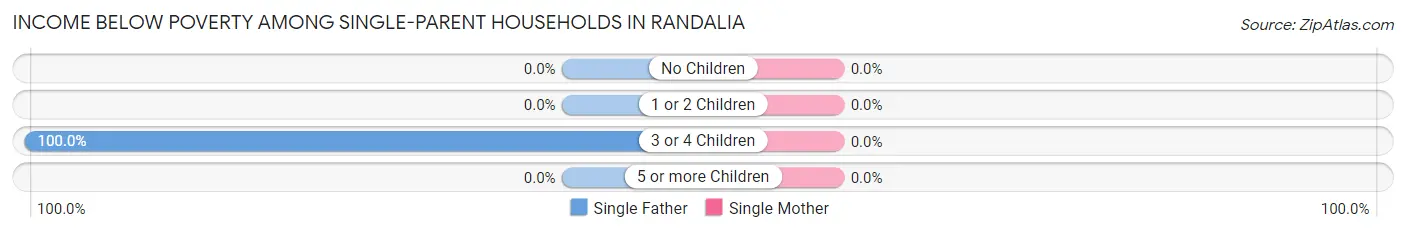
| Children | Single Father | Single Mother |
| No Children | 0 (0.0%) | 0 (0.0%) |
| 1 or 2 Children | 0 (0.0%) | 0 (0.0%) |
| 3 or 4 Children | 4 (100.0%) | 0 (0.0%) |
| 5 or more Children | 0 (0.0%) | 0 (0.0%) |
| Total | 4 (100.0%) | 0 (0.0%) |
Income Below Poverty Among Married-Couple vs Single-Parent Households in Randalia
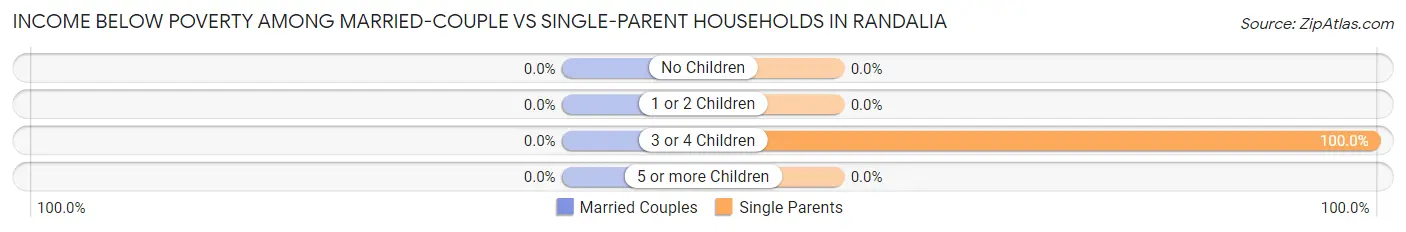
| Children | Married-Couple Families | Single-Parent Households |
| No Children | 0 (0.0%) | 0 (0.0%) |
| 1 or 2 Children | 0 (0.0%) | 0 (0.0%) |
| 3 or 4 Children | 0 (0.0%) | 4 (100.0%) |
| 5 or more Children | 0 (0.0%) | 0 (0.0%) |
| Total | 0 (0.0%) | 4 (66.7%) |
Race in Randalia
The most populous races in Randalia are White / Caucasian (62 | 95.4%), Hispanic or Latino (3 | 4.6%), and Two or more Races (3 | 4.6%).
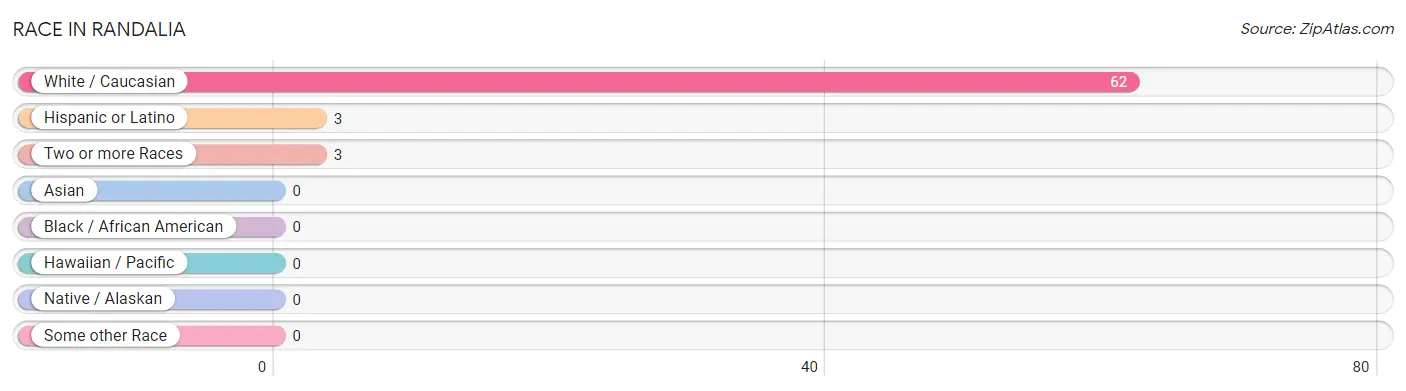
| Race | # Population | % Population |
| Asian | 0 | 0.0% |
| Black / African American | 0 | 0.0% |
| Hawaiian / Pacific | 0 | 0.0% |
| Hispanic or Latino | 3 | 4.6% |
| Native / Alaskan | 0 | 0.0% |
| White / Caucasian | 62 | 95.4% |
| Two or more Races | 3 | 4.6% |
| Some other Race | 0 | 0.0% |
| Total | 65 | 100.0% |
Ancestry in Randalia
The most populous ancestries reported in Randalia are German (31 | 47.7%), Irish (19 | 29.2%), Norwegian (14 | 21.5%), English (9 | 13.9%), and Italian (4 | 6.1%), together accounting for 118.5% of all Randalia residents.
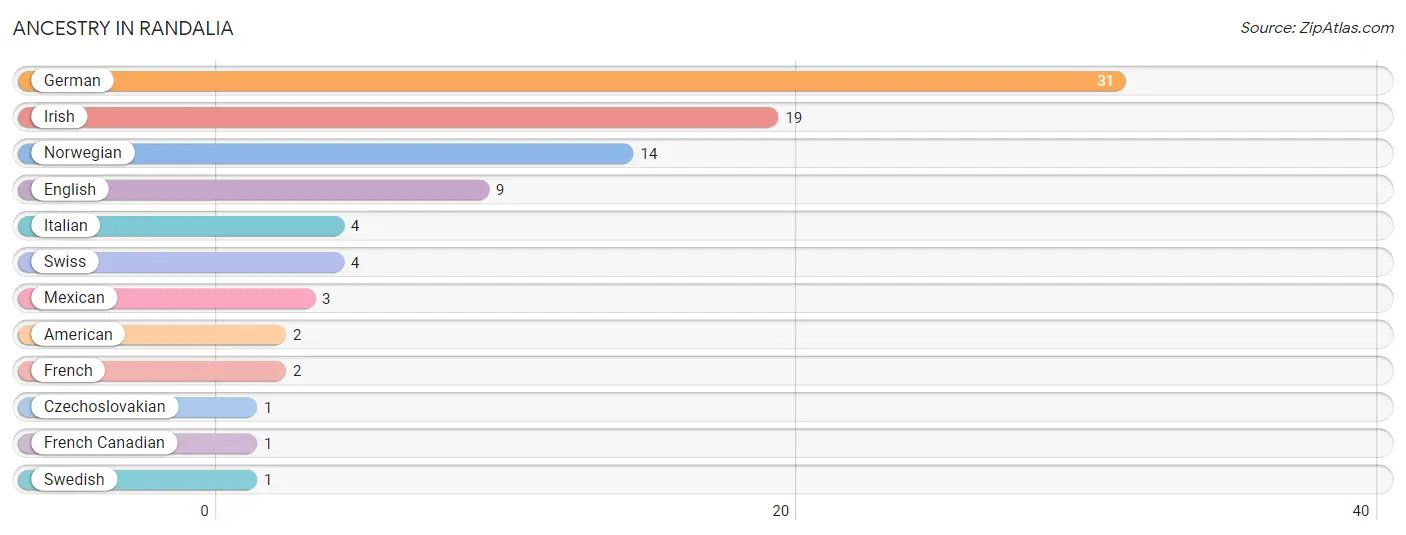
| Ancestry | # Population | % Population |
| American | 2 | 3.1% |
| Czechoslovakian | 1 | 1.5% |
| English | 9 | 13.9% |
| French | 2 | 3.1% |
| French Canadian | 1 | 1.5% |
| German | 31 | 47.7% |
| Irish | 19 | 29.2% |
| Italian | 4 | 6.1% |
| Mexican | 3 | 4.6% |
| Norwegian | 14 | 21.5% |
| Swedish | 1 | 1.5% |
| Swiss | 4 | 6.1% | View All 12 Rows |
Immigrants in Randalia

| Immigration Origin | # Population | % Population | View All 0 Rows |
Sex and Age in Randalia
Sex and Age in Randalia
The most populous age groups in Randalia are 45 to 49 Years (7 | 24.1%) for men and Under 5 Years (12 | 33.3%) for women.
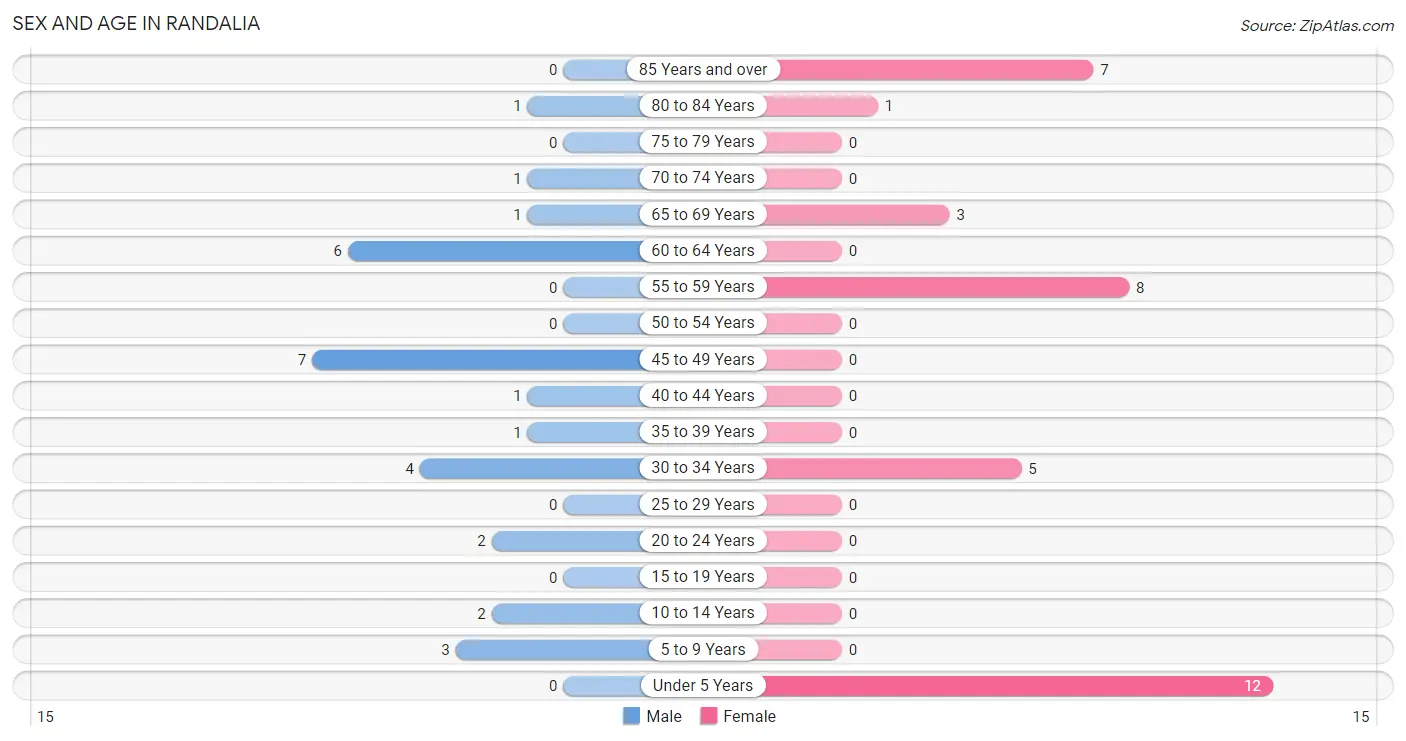
| Age Bracket | Male | Female |
| Under 5 Years | 0 (0.0%) | 12 (33.3%) |
| 5 to 9 Years | 3 (10.3%) | 0 (0.0%) |
| 10 to 14 Years | 2 (6.9%) | 0 (0.0%) |
| 15 to 19 Years | 0 (0.0%) | 0 (0.0%) |
| 20 to 24 Years | 2 (6.9%) | 0 (0.0%) |
| 25 to 29 Years | 0 (0.0%) | 0 (0.0%) |
| 30 to 34 Years | 4 (13.8%) | 5 (13.9%) |
| 35 to 39 Years | 1 (3.5%) | 0 (0.0%) |
| 40 to 44 Years | 1 (3.5%) | 0 (0.0%) |
| 45 to 49 Years | 7 (24.1%) | 0 (0.0%) |
| 50 to 54 Years | 0 (0.0%) | 0 (0.0%) |
| 55 to 59 Years | 0 (0.0%) | 8 (22.2%) |
| 60 to 64 Years | 6 (20.7%) | 0 (0.0%) |
| 65 to 69 Years | 1 (3.5%) | 3 (8.3%) |
| 70 to 74 Years | 1 (3.5%) | 0 (0.0%) |
| 75 to 79 Years | 0 (0.0%) | 0 (0.0%) |
| 80 to 84 Years | 1 (3.5%) | 1 (2.8%) |
| 85 Years and over | 0 (0.0%) | 7 (19.4%) |
| Total | 29 (100.0%) | 36 (100.0%) |
Families and Households in Randalia
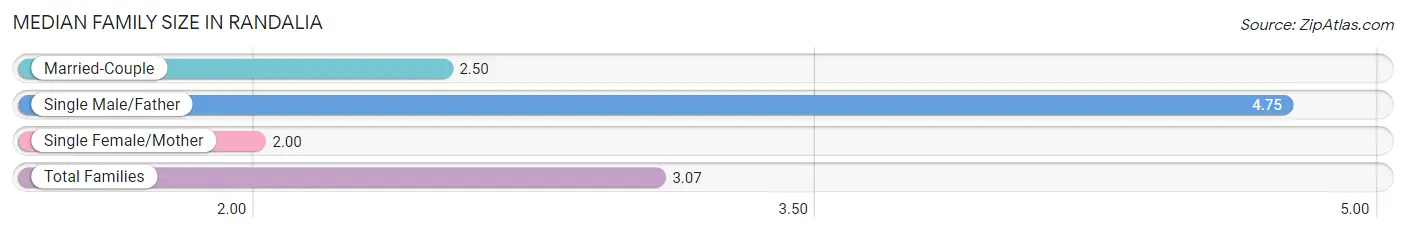
Median Family Size in Randalia
The median family size in Randalia is 3.07 persons per family, with single male/father families (4 | 28.6%) accounting for the largest median family size of 4.75 persons per family. On the other hand, single female/mother families (2 | 14.3%) represent the smallest median family size with 2.00 persons per family.
| Family Type | # Families | Family Size |
| Married-Couple | 8 (57.1%) | 2.50 |
| Single Male/Father | 4 (28.6%) | 4.75 |
| Single Female/Mother | 2 (14.3%) | 2.00 |
| Total Families | 14 (100.0%) | 3.07 |
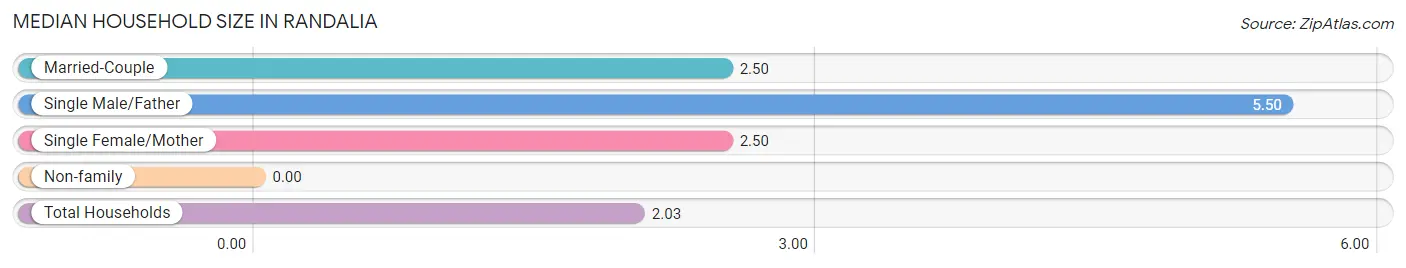
Median Household Size in Randalia
| Household Type | # Households | Household Size |
| Married-Couple | 8 (25.0%) | 2.50 |
| Single Male/Father | 4 (12.5%) | 5.50 |
| Single Female/Mother | 2 (6.2%) | 2.50 |
| Non-family | 18 (56.2%) | - |
| Total Households | 32 (100.0%) | 2.03 |
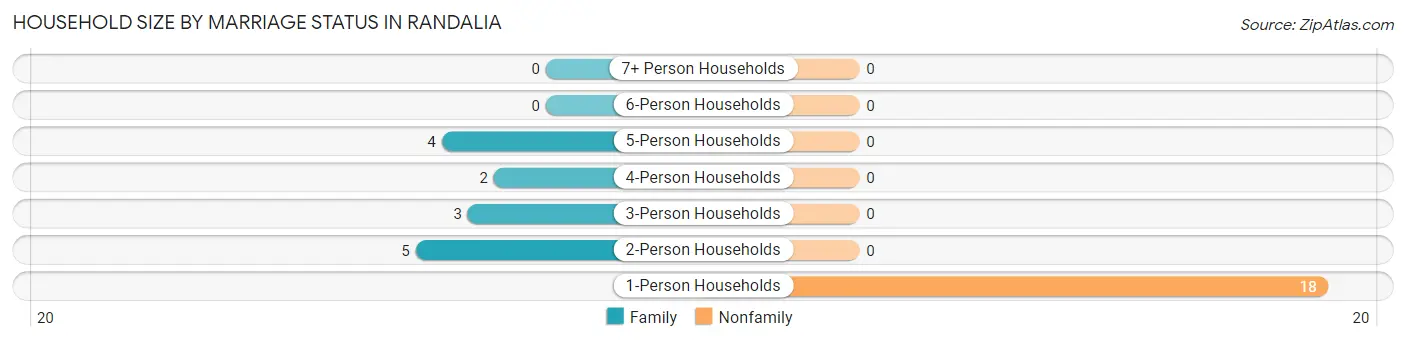
Household Size by Marriage Status in Randalia
Out of a total of 32 households in Randalia, 14 (43.8%) are family households, while 18 (56.2%) are nonfamily households. The most numerous type of family households are 2-person households, comprising 5, and the most common type of nonfamily households are 1-person households, comprising 18.
| Household Size | Family Households | Nonfamily Households |
| 1-Person Households | - | 18 (56.2%) |
| 2-Person Households | 5 (15.6%) | 0 (0.0%) |
| 3-Person Households | 3 (9.4%) | 0 (0.0%) |
| 4-Person Households | 2 (6.2%) | 0 (0.0%) |
| 5-Person Households | 4 (12.5%) | 0 (0.0%) |
| 6-Person Households | 0 (0.0%) | 0 (0.0%) |
| 7+ Person Households | 0 (0.0%) | 0 (0.0%) |
| Total | 14 (43.8%) | 18 (56.2%) |
Female Fertility in Randalia
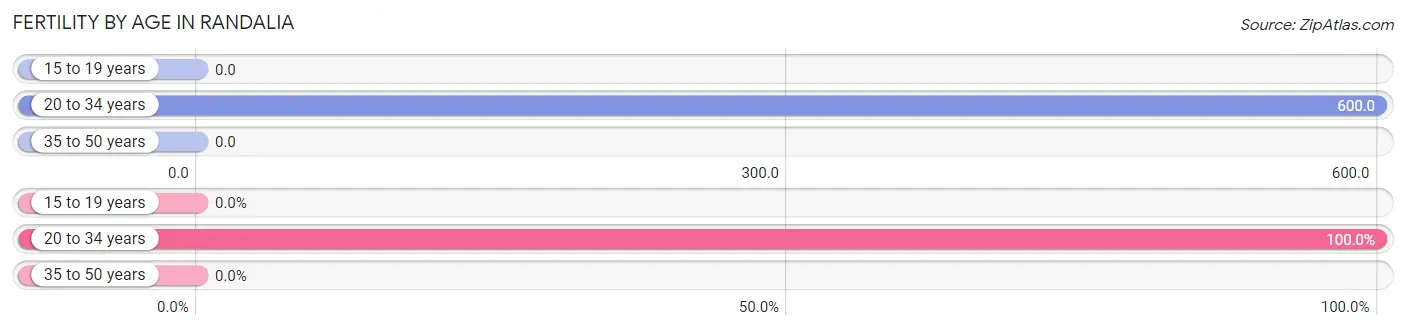
Fertility by Age in Randalia
Average fertility rate in Randalia is 600.0 births per 1,000 women. Women in the age bracket of 20 to 34 years have the highest fertility rate with 600.0 births per 1,000 women. Women in the age bracket of 20 to 34 years acount for 100.0% of all women with births.
| Age Bracket | Women with Births | Births / 1,000 Women |
| 15 to 19 years | 0 (0.0%) | 0.0 |
| 20 to 34 years | 3 (100.0%) | 600.0 |
| 35 to 50 years | 0 (0.0%) | 0.0 |
| Total | 3 (100.0%) | 600.0 |
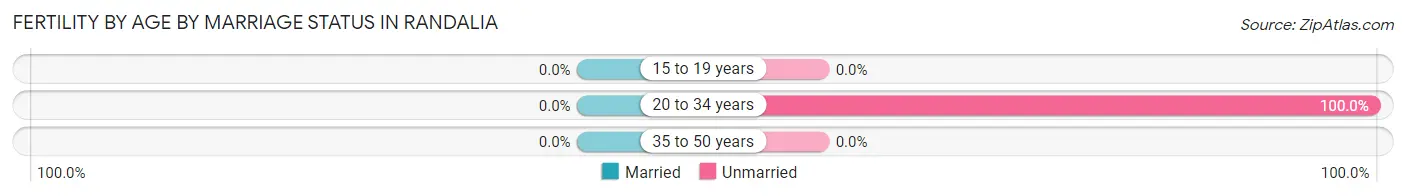
Fertility by Age by Marriage Status in Randalia
| Age Bracket | Married | Unmarried |
| 15 to 19 years | 0 (0.0%) | 0 (0.0%) |
| 20 to 34 years | 0 (0.0%) | 3 (100.0%) |
| 35 to 50 years | 0 (0.0%) | 0 (0.0%) |
| Total | 0 (0.0%) | 3 (100.0%) |
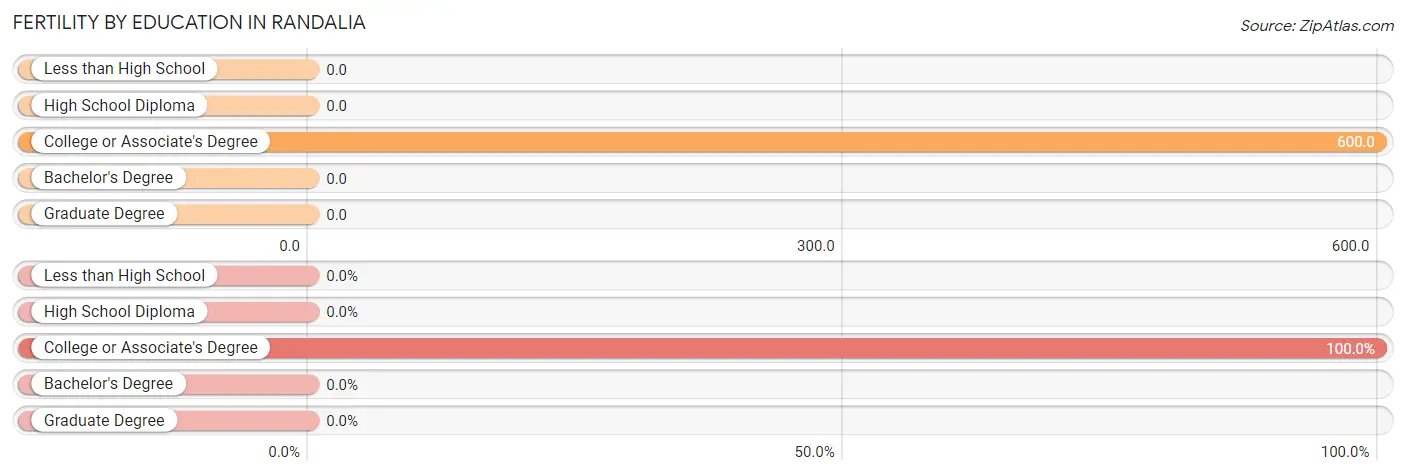
Fertility by Education in Randalia
| Educational Attainment | Women with Births | Births / 1,000 Women |
| Less than High School | 0 (0.0%) | 0.0 |
| High School Diploma | 0 (0.0%) | 0.0 |
| College or Associate's Degree | 3 (100.0%) | 600.0 |
| Bachelor's Degree | 0 (0.0%) | 0.0 |
| Graduate Degree | 0 (0.0%) | 0.0 |
| Total | 3 (100.0%) | 600.0 |
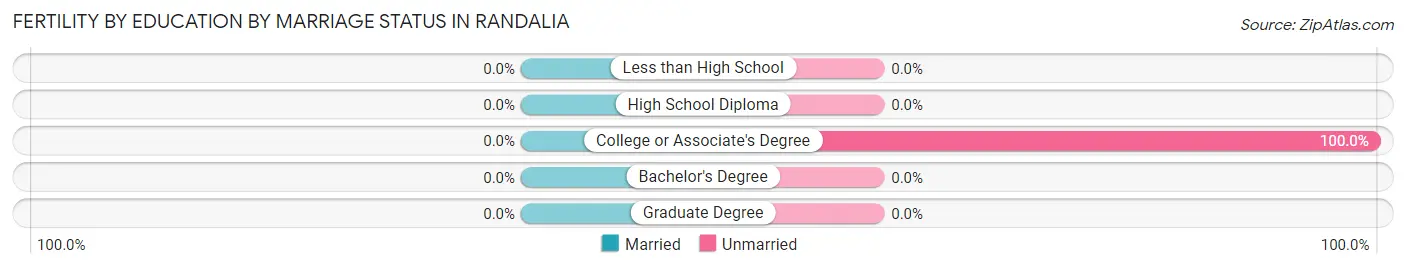
Fertility by Education by Marriage Status in Randalia
| Educational Attainment | Married | Unmarried |
| Less than High School | 0 (0.0%) | 0 (0.0%) |
| High School Diploma | 0 (0.0%) | 0 (0.0%) |
| College or Associate's Degree | 0 (0.0%) | 3 (100.0%) |
| Bachelor's Degree | 0 (0.0%) | 0 (0.0%) |
| Graduate Degree | 0 (0.0%) | 0 (0.0%) |
| Total | 0 (0.0%) | 3 (100.0%) |
Employment Characteristics in Randalia
Employment by Class of Employer in Randalia
Among the 28 employed individuals in Randalia, private company employees (21 | 75.0%), self-employed (incorporated) (3 | 10.7%), and not-for-profit organizations (2 | 7.1%) make up the most common classes of employment.
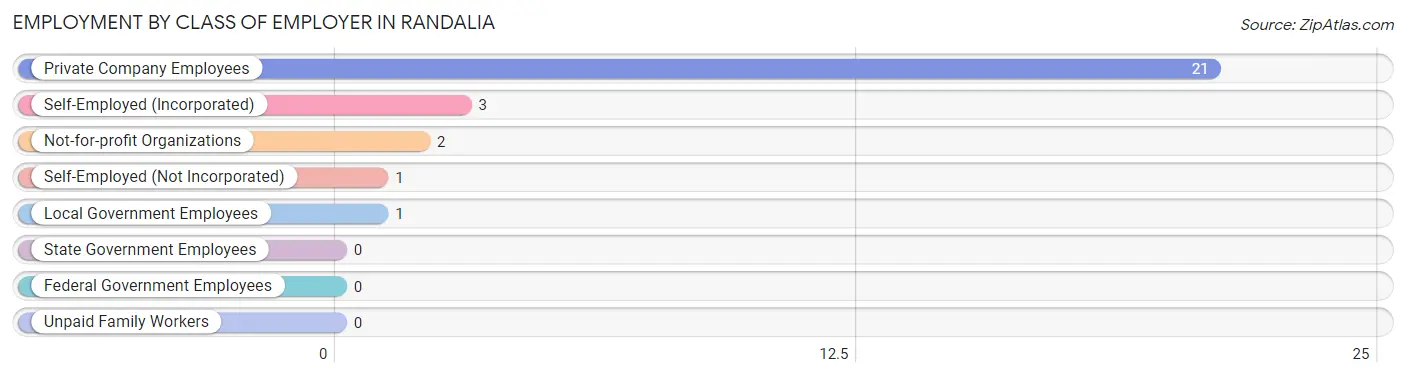
| Employer Class | # Employees | % Employees |
| Private Company Employees | 21 | 75.0% |
| Self-Employed (Incorporated) | 3 | 10.7% |
| Self-Employed (Not Incorporated) | 1 | 3.6% |
| Not-for-profit Organizations | 2 | 7.1% |
| Local Government Employees | 1 | 3.6% |
| State Government Employees | 0 | 0.0% |
| Federal Government Employees | 0 | 0.0% |
| Unpaid Family Workers | 0 | 0.0% |
| Total | 28 | 100.0% |
Employment Status by Age in Randalia
According to the labor force statistics for Randalia, out of the total population over 16 years of age (48), 68.8% or 33 individuals are in the labor force, with 12.1% or 4 of them unemployed. The age group with the highest labor force participation rate is 20 to 24 years, with 100.0% or 2 individuals in the labor force. Within the labor force, the 30 to 34 years age range has the highest percentage of unemployed individuals, with 66.7% or 4 of them being unemployed.
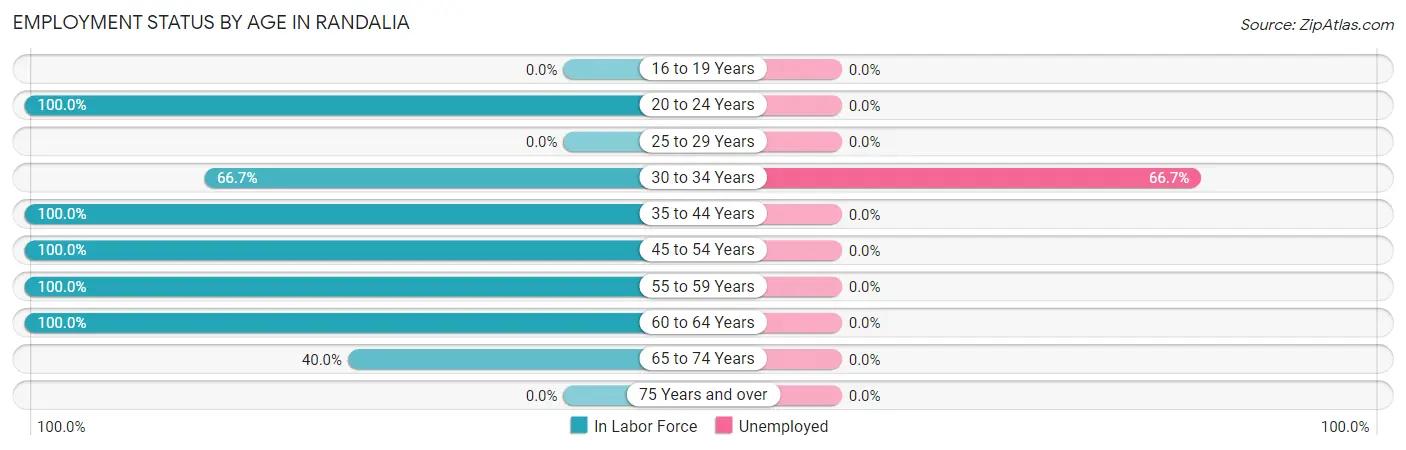
| Age Bracket | In Labor Force | Unemployed |
| 16 to 19 Years | 0 (0.0%) | 0 (0.0%) |
| 20 to 24 Years | 2 (100.0%) | 0 (0.0%) |
| 25 to 29 Years | 0 (0.0%) | 0 (0.0%) |
| 30 to 34 Years | 6 (66.7%) | 4 (66.7%) |
| 35 to 44 Years | 2 (100.0%) | 0 (0.0%) |
| 45 to 54 Years | 7 (100.0%) | 0 (0.0%) |
| 55 to 59 Years | 8 (100.0%) | 0 (0.0%) |
| 60 to 64 Years | 6 (100.0%) | 0 (0.0%) |
| 65 to 74 Years | 2 (40.0%) | 0 (0.0%) |
| 75 Years and over | 0 (0.0%) | 0 (0.0%) |
| Total | 33 (68.8%) | 4 (12.1%) |
Employment Status by Educational Attainment in Randalia
According to labor force statistics for Randalia, 90.6% of individuals (29) out of the total population between 25 and 64 years of age (32) are in the labor force, with 13.8% or 4 of them being unemployed. The group with the highest labor force participation rate are those with the educational attainment of less than high school, with 100.0% or 2 individuals in the labor force. Within the labor force, individuals with high school diploma education have the highest percentage of unemployment, with 16.0% or 4 of them being unemployed.
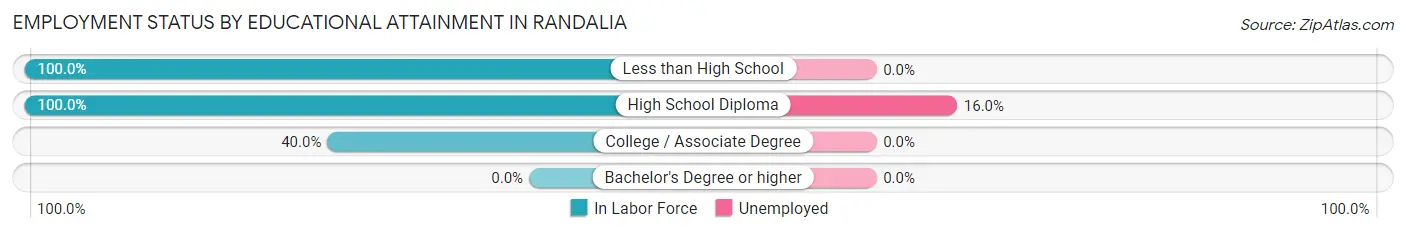
| Educational Attainment | In Labor Force | Unemployed |
| Less than High School | 2 (100.0%) | 0 (0.0%) |
| High School Diploma | 25 (100.0%) | 4 (16.0%) |
| College / Associate Degree | 2 (40.0%) | 0 (0.0%) |
| Bachelor's Degree or higher | 0 (0.0%) | 0 (0.0%) |
| Total | 29 (90.6%) | 4 (13.8%) |
Employment Occupations by Sex in Randalia
Management, Business, Science and Arts Occupations
The most common Management, Business, Science and Arts occupations in Randalia are , and Business & Financial (1 | 3.5%).
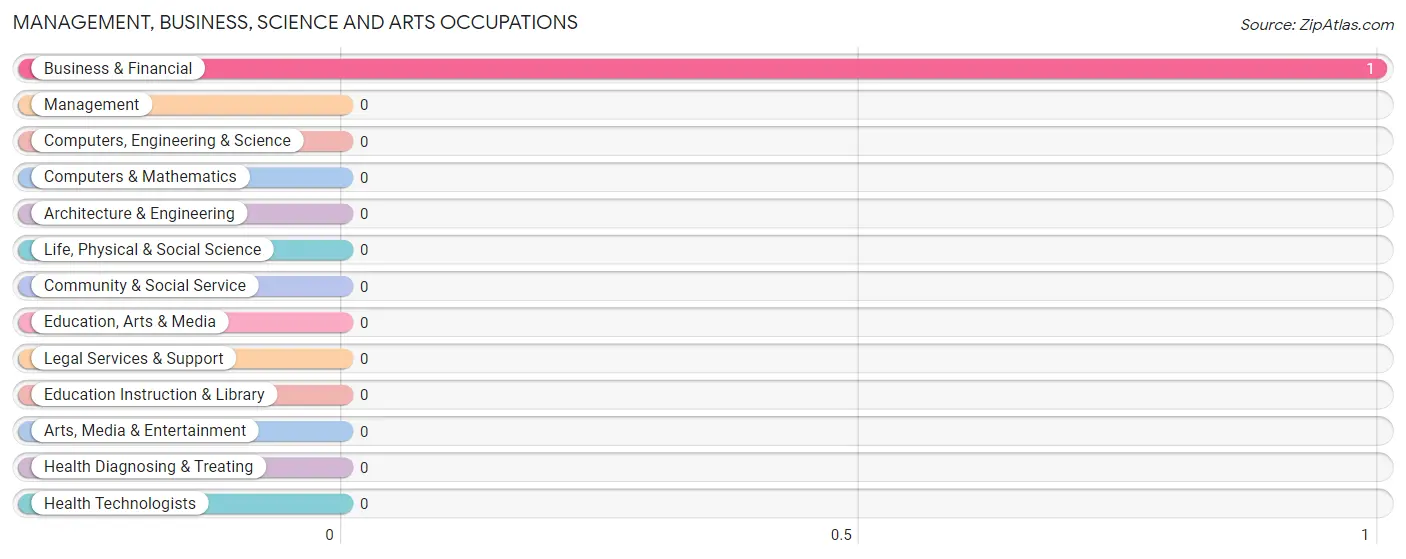
Management, Business, Science and Arts Occupations by Sex
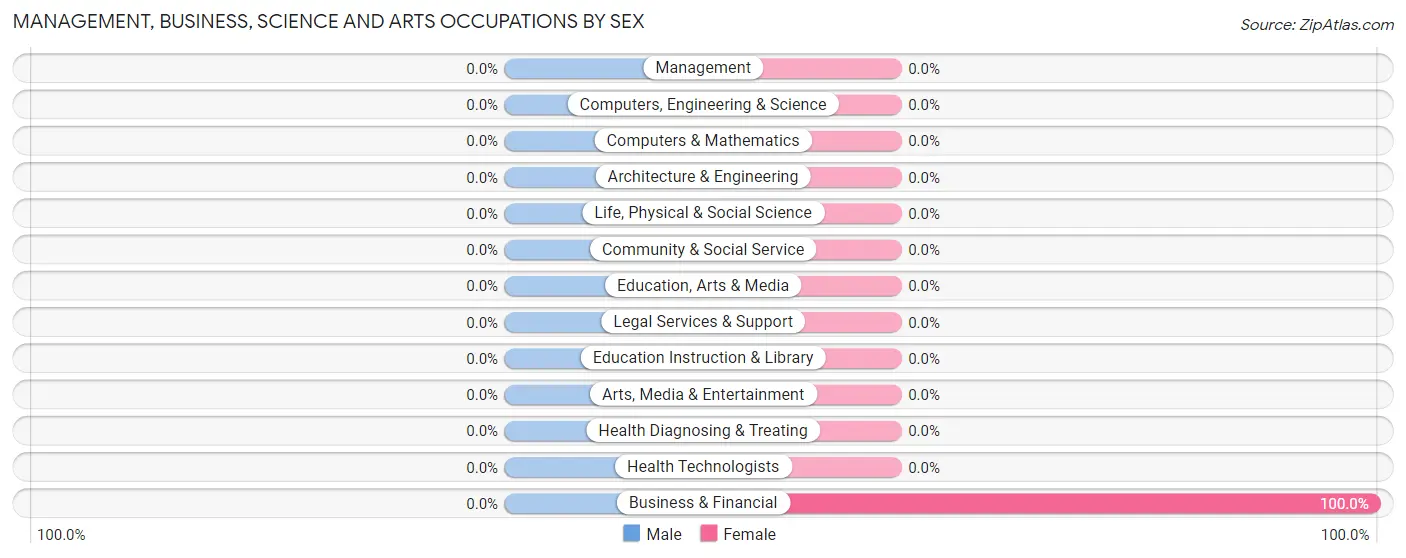
| Occupation | Male | Female |
| Management | 0 (0.0%) | 0 (0.0%) |
| Business & Financial | 0 (0.0%) | 1 (100.0%) |
| Computers, Engineering & Science | 0 (0.0%) | 0 (0.0%) |
| Computers & Mathematics | 0 (0.0%) | 0 (0.0%) |
| Architecture & Engineering | 0 (0.0%) | 0 (0.0%) |
| Life, Physical & Social Science | 0 (0.0%) | 0 (0.0%) |
| Community & Social Service | 0 (0.0%) | 0 (0.0%) |
| Education, Arts & Media | 0 (0.0%) | 0 (0.0%) |
| Legal Services & Support | 0 (0.0%) | 0 (0.0%) |
| Education Instruction & Library | 0 (0.0%) | 0 (0.0%) |
| Arts, Media & Entertainment | 0 (0.0%) | 0 (0.0%) |
| Health Diagnosing & Treating | 0 (0.0%) | 0 (0.0%) |
| Health Technologists | 0 (0.0%) | 0 (0.0%) |
| Total (Category) | 0 (0.0%) | 1 (100.0%) |
| Total (Overall) | 18 (62.1%) | 11 (37.9%) |
Services Occupations
The most common Services occupations in Randalia are Cleaning & Maintenance (5 | 17.2%), and Personal Care & Service (1 | 3.5%).
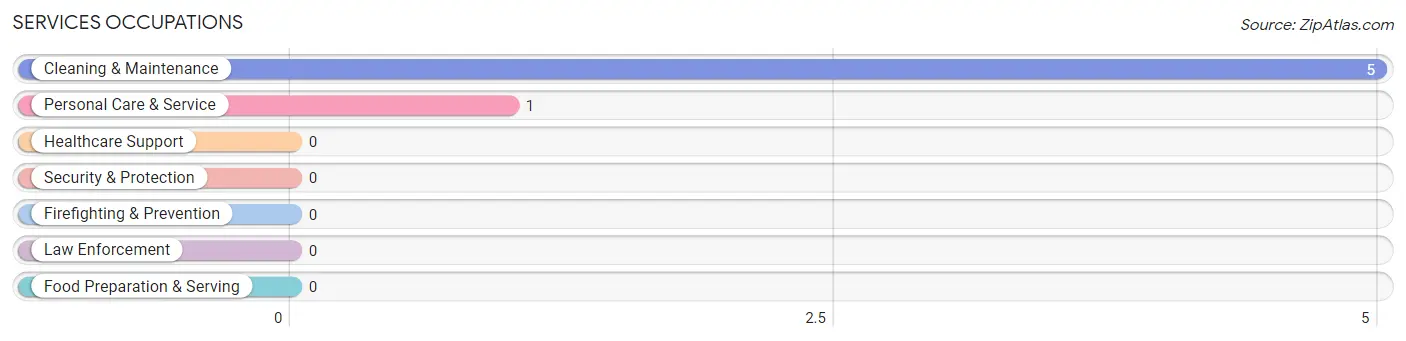
Services Occupations by Sex
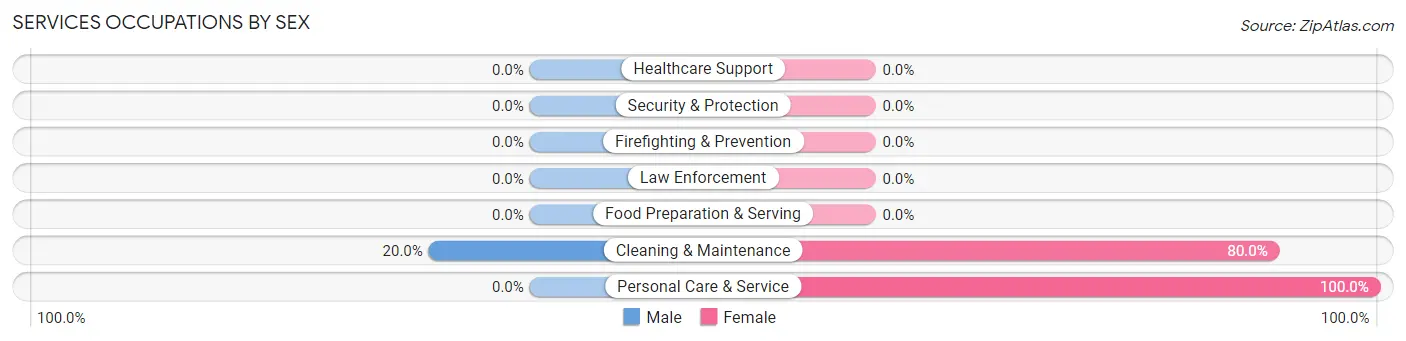
| Occupation | Male | Female |
| Healthcare Support | 0 (0.0%) | 0 (0.0%) |
| Security & Protection | 0 (0.0%) | 0 (0.0%) |
| Firefighting & Prevention | 0 (0.0%) | 0 (0.0%) |
| Law Enforcement | 0 (0.0%) | 0 (0.0%) |
| Food Preparation & Serving | 0 (0.0%) | 0 (0.0%) |
| Cleaning & Maintenance | 1 (20.0%) | 4 (80.0%) |
| Personal Care & Service | 0 (0.0%) | 1 (100.0%) |
| Total (Category) | 1 (16.7%) | 5 (83.3%) |
| Total (Overall) | 18 (62.1%) | 11 (37.9%) |
Sales and Office Occupations
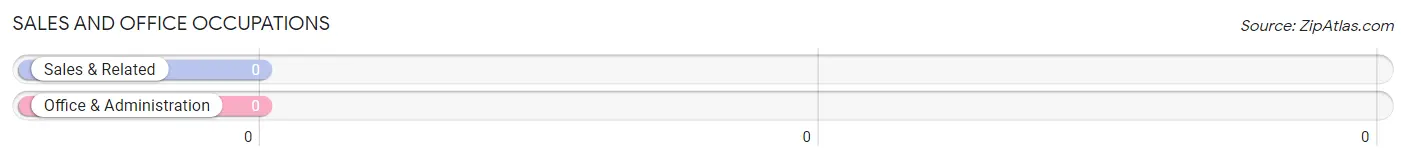
Sales and Office Occupations by Sex
| Occupation | Male | Female |
| Sales & Related | 0 (0.0%) | 0 (0.0%) |
| Office & Administration | 0 (0.0%) | 0 (0.0%) |
| Total (Category) | 0 (0.0%) | 0 (0.0%) |
| Total (Overall) | 18 (62.1%) | 11 (37.9%) |
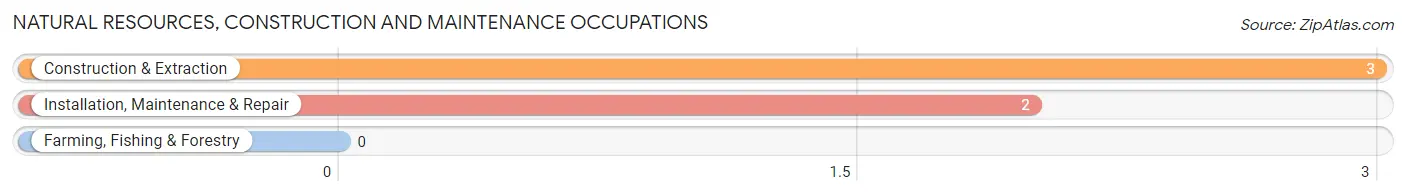
Natural Resources, Construction and Maintenance Occupations
The most common Natural Resources, Construction and Maintenance occupations in Randalia are Construction & Extraction (3 | 10.3%), and Installation, Maintenance & Repair (2 | 6.9%).
Natural Resources, Construction and Maintenance Occupations by Sex
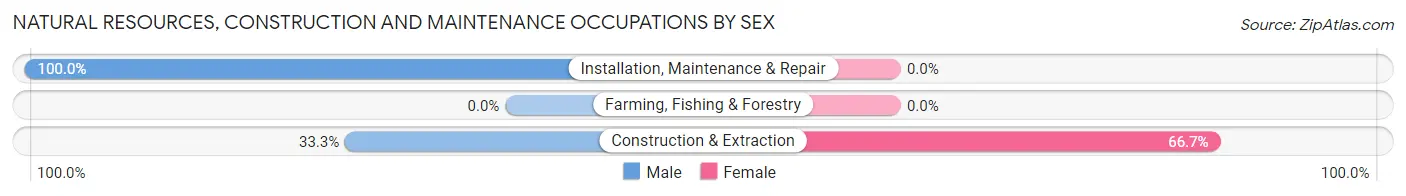
| Occupation | Male | Female |
| Farming, Fishing & Forestry | 0 (0.0%) | 0 (0.0%) |
| Construction & Extraction | 1 (33.3%) | 2 (66.7%) |
| Installation, Maintenance & Repair | 2 (100.0%) | 0 (0.0%) |
| Total (Category) | 3 (60.0%) | 2 (40.0%) |
| Total (Overall) | 18 (62.1%) | 11 (37.9%) |
Production, Transportation and Moving Occupations
The most common Production, Transportation and Moving occupations in Randalia are Transportation (9 | 31.0%), Production (7 | 24.1%), and Material Moving (1 | 3.5%).
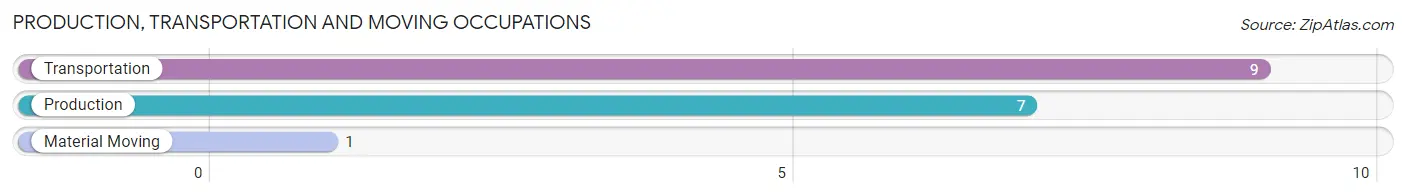
Production, Transportation and Moving Occupations by Sex
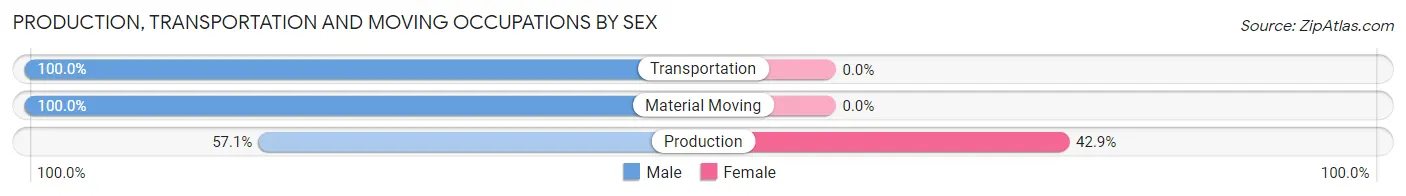
| Occupation | Male | Female |
| Production | 4 (57.1%) | 3 (42.9%) |
| Transportation | 9 (100.0%) | 0 (0.0%) |
| Material Moving | 1 (100.0%) | 0 (0.0%) |
| Total (Category) | 14 (82.4%) | 3 (17.6%) |
| Total (Overall) | 18 (62.1%) | 11 (37.9%) |
Employment Industries by Sex in Randalia
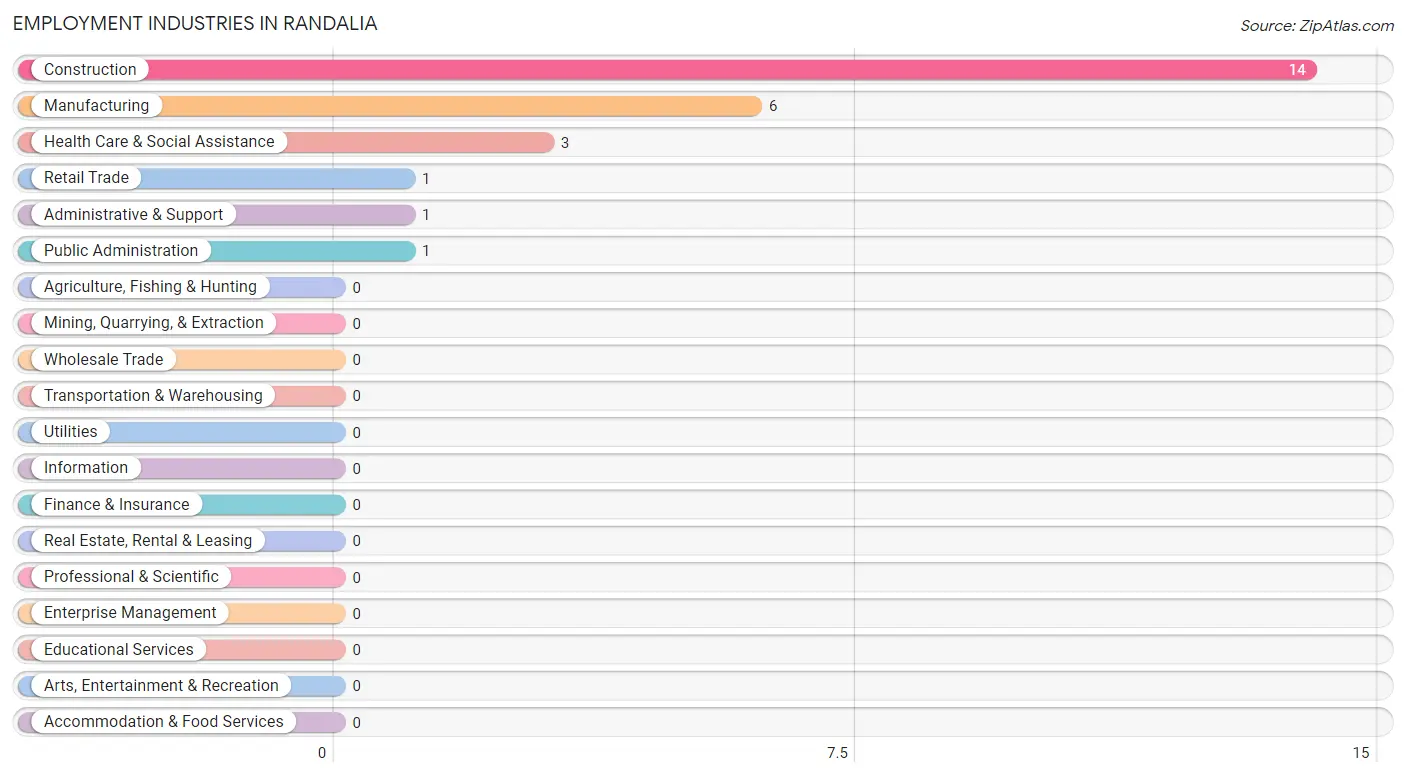
Employment Industries in Randalia
The major employment industries in Randalia include Construction (14 | 48.3%), Manufacturing (6 | 20.7%), Health Care & Social Assistance (3 | 10.3%), Retail Trade (1 | 3.5%), and Administrative & Support (1 | 3.5%).
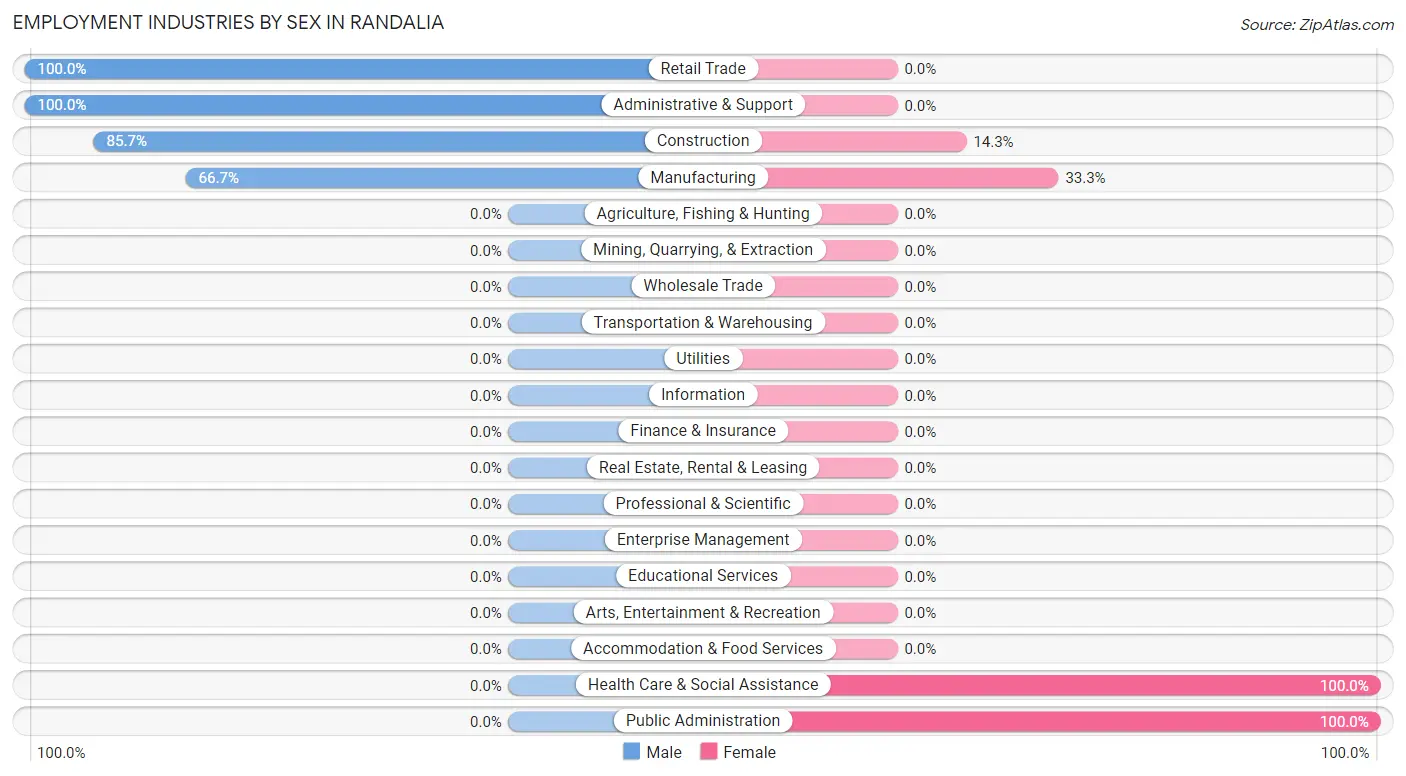
Employment Industries by Sex in Randalia
The Randalia industries that see more men than women are Retail Trade (100.0%), Administrative & Support (100.0%), and Construction (85.7%), whereas the industries that tend to have a higher number of women are Health Care & Social Assistance (100.0%), Public Administration (100.0%), and Manufacturing (33.3%).
| Industry | Male | Female |
| Agriculture, Fishing & Hunting | 0 (0.0%) | 0 (0.0%) |
| Mining, Quarrying, & Extraction | 0 (0.0%) | 0 (0.0%) |
| Construction | 12 (85.7%) | 2 (14.3%) |
| Manufacturing | 4 (66.7%) | 2 (33.3%) |
| Wholesale Trade | 0 (0.0%) | 0 (0.0%) |
| Retail Trade | 1 (100.0%) | 0 (0.0%) |
| Transportation & Warehousing | 0 (0.0%) | 0 (0.0%) |
| Utilities | 0 (0.0%) | 0 (0.0%) |
| Information | 0 (0.0%) | 0 (0.0%) |
| Finance & Insurance | 0 (0.0%) | 0 (0.0%) |
| Real Estate, Rental & Leasing | 0 (0.0%) | 0 (0.0%) |
| Professional & Scientific | 0 (0.0%) | 0 (0.0%) |
| Enterprise Management | 0 (0.0%) | 0 (0.0%) |
| Administrative & Support | 1 (100.0%) | 0 (0.0%) |
| Educational Services | 0 (0.0%) | 0 (0.0%) |
| Health Care & Social Assistance | 0 (0.0%) | 3 (100.0%) |
| Arts, Entertainment & Recreation | 0 (0.0%) | 0 (0.0%) |
| Accommodation & Food Services | 0 (0.0%) | 0 (0.0%) |
| Public Administration | 0 (0.0%) | 1 (100.0%) |
| Total | 18 (62.1%) | 11 (37.9%) |
Education in Randalia
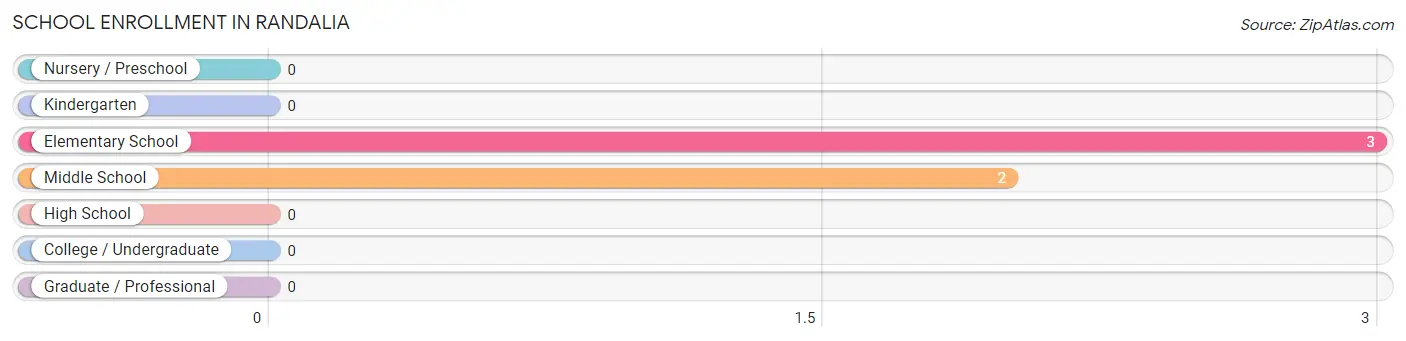
School Enrollment in Randalia
The most common levels of schooling among the 5 students in Randalia are elementary school (3 | 60.0%), and middle school (2 | 40.0%).
| School Level | # Students | % Students |
| Nursery / Preschool | 0 | 0.0% |
| Kindergarten | 0 | 0.0% |
| Elementary School | 3 | 60.0% |
| Middle School | 2 | 40.0% |
| High School | 0 | 0.0% |
| College / Undergraduate | 0 | 0.0% |
| Graduate / Professional | 0 | 0.0% |
| Total | 5 | 100.0% |
School Enrollment by Age by Funding Source in Randalia
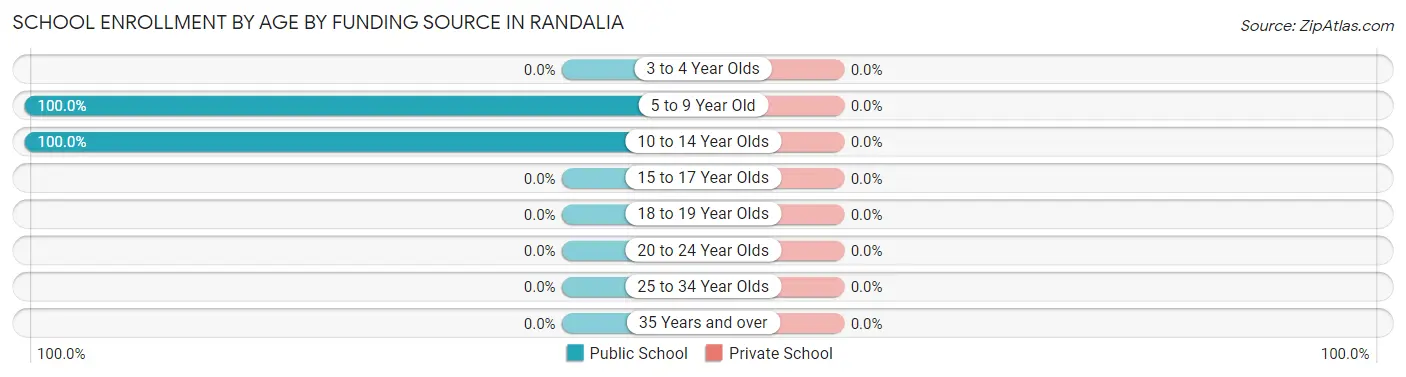
| Age Bracket | Public School | Private School |
| 3 to 4 Year Olds | 0 (0.0%) | 0 (0.0%) |
| 5 to 9 Year Old | 3 (100.0%) | 0 (0.0%) |
| 10 to 14 Year Olds | 2 (100.0%) | 0 (0.0%) |
| 15 to 17 Year Olds | 0 (0.0%) | 0 (0.0%) |
| 18 to 19 Year Olds | 0 (0.0%) | 0 (0.0%) |
| 20 to 24 Year Olds | 0 (0.0%) | 0 (0.0%) |
| 25 to 34 Year Olds | 0 (0.0%) | 0 (0.0%) |
| 35 Years and over | 0 (0.0%) | 0 (0.0%) |
| Total | 5 (100.0%) | 0 (0.0%) |
Educational Attainment by Field of Study in Randalia
, and education (8 | 100.0%) are the most common fields of study among 8 individuals in Randalia who have obtained a bachelor's degree or higher.
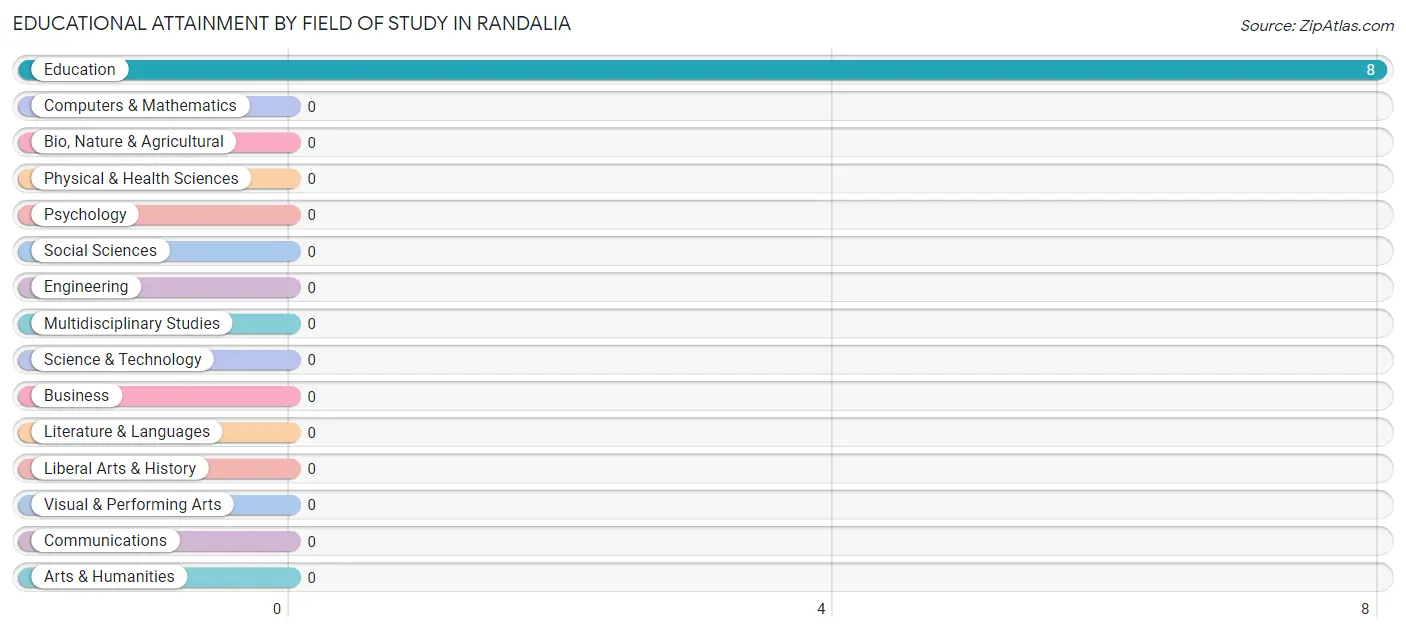
| Field of Study | # Graduates | % Graduates |
| Computers & Mathematics | 0 | 0.0% |
| Bio, Nature & Agricultural | 0 | 0.0% |
| Physical & Health Sciences | 0 | 0.0% |
| Psychology | 0 | 0.0% |
| Social Sciences | 0 | 0.0% |
| Engineering | 0 | 0.0% |
| Multidisciplinary Studies | 0 | 0.0% |
| Science & Technology | 0 | 0.0% |
| Business | 0 | 0.0% |
| Education | 8 | 100.0% |
| Literature & Languages | 0 | 0.0% |
| Liberal Arts & History | 0 | 0.0% |
| Visual & Performing Arts | 0 | 0.0% |
| Communications | 0 | 0.0% |
| Arts & Humanities | 0 | 0.0% |
| Total | 8 | 100.0% |
Transportation & Commute in Randalia
Vehicle Availability by Sex in Randalia
The most prevalent vehicle ownership categories in Randalia are males with 2 vehicles (8, accounting for 44.4%) and females with 2 vehicles (0, making up 80.0%).
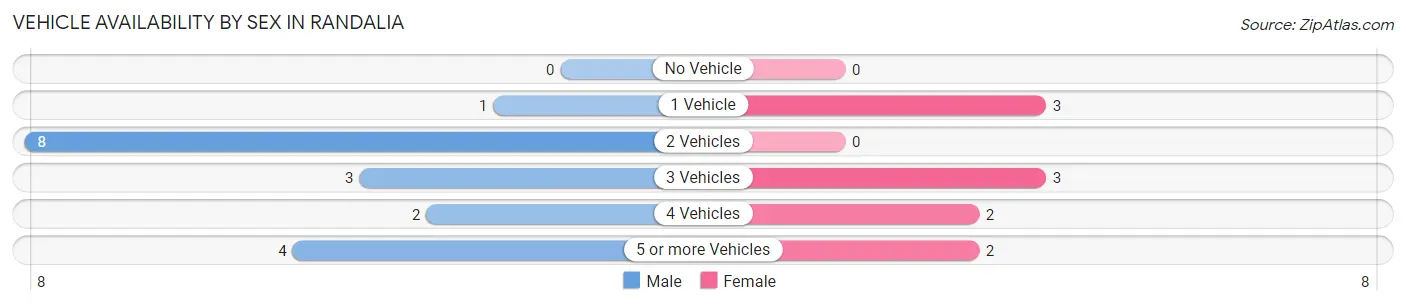
| Vehicles Available | Male | Female |
| No Vehicle | 0 (0.0%) | 0 (0.0%) |
| 1 Vehicle | 1 (5.6%) | 3 (30.0%) |
| 2 Vehicles | 8 (44.4%) | 0 (0.0%) |
| 3 Vehicles | 3 (16.7%) | 3 (30.0%) |
| 4 Vehicles | 2 (11.1%) | 2 (20.0%) |
| 5 or more Vehicles | 4 (22.2%) | 2 (20.0%) |
| Total | 18 (100.0%) | 10 (100.0%) |
Commute Time in Randalia
The most frequently occuring commute durations in Randalia are 30 to 34 minutes (7 commuters, 25.0%), 10 to 14 minutes (6 commuters, 21.4%), and 15 to 19 minutes (4 commuters, 14.3%).
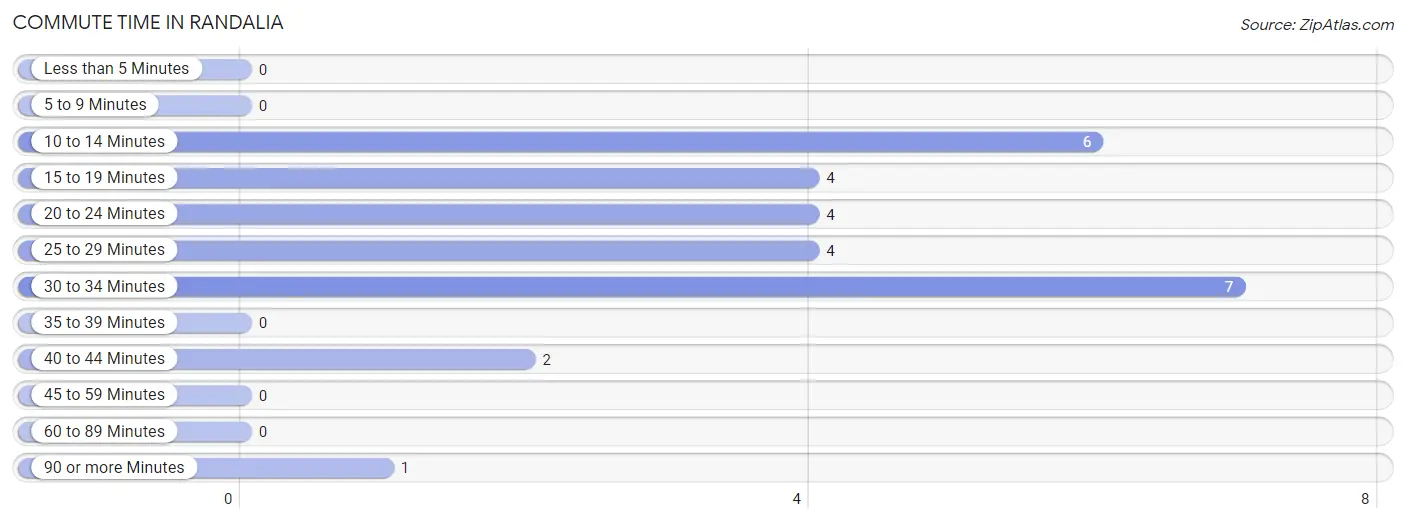
| Commute Time | # Commuters | % Commuters |
| Less than 5 Minutes | 0 | 0.0% |
| 5 to 9 Minutes | 0 | 0.0% |
| 10 to 14 Minutes | 6 | 21.4% |
| 15 to 19 Minutes | 4 | 14.3% |
| 20 to 24 Minutes | 4 | 14.3% |
| 25 to 29 Minutes | 4 | 14.3% |
| 30 to 34 Minutes | 7 | 25.0% |
| 35 to 39 Minutes | 0 | 0.0% |
| 40 to 44 Minutes | 2 | 7.1% |
| 45 to 59 Minutes | 0 | 0.0% |
| 60 to 89 Minutes | 0 | 0.0% |
| 90 or more Minutes | 1 | 3.6% |
Commute Time by Sex in Randalia
The most common commute times in Randalia are 30 to 34 minutes (7 commuters, 38.9%) for males and 20 to 24 minutes (4 commuters, 40.0%) for females.
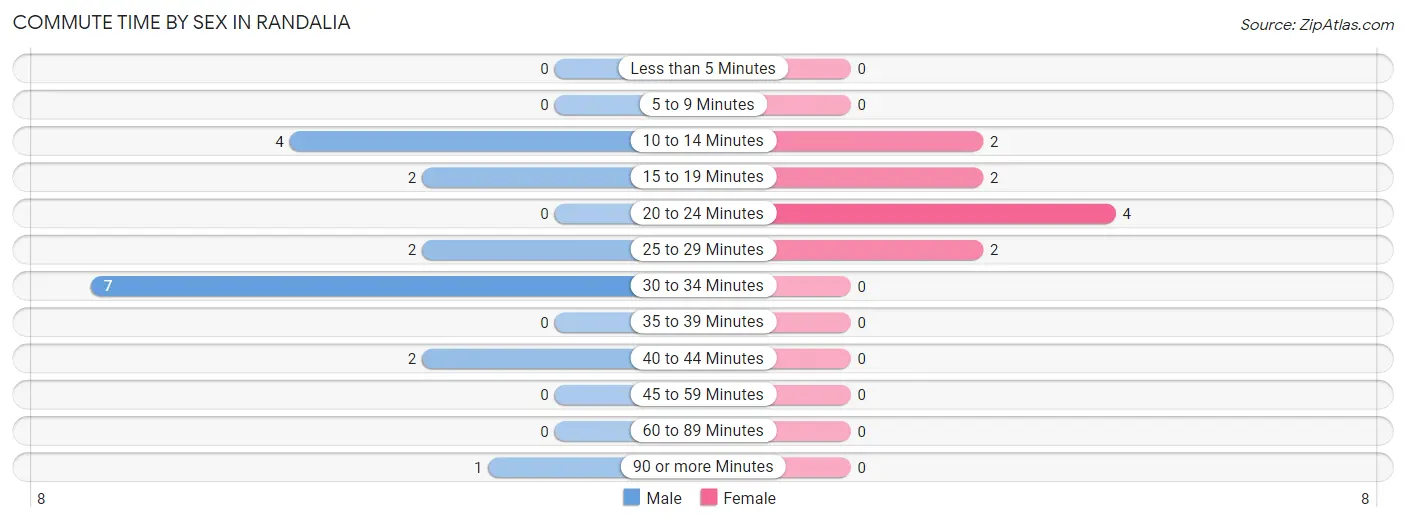
| Commute Time | Male | Female |
| Less than 5 Minutes | 0 (0.0%) | 0 (0.0%) |
| 5 to 9 Minutes | 0 (0.0%) | 0 (0.0%) |
| 10 to 14 Minutes | 4 (22.2%) | 2 (20.0%) |
| 15 to 19 Minutes | 2 (11.1%) | 2 (20.0%) |
| 20 to 24 Minutes | 0 (0.0%) | 4 (40.0%) |
| 25 to 29 Minutes | 2 (11.1%) | 2 (20.0%) |
| 30 to 34 Minutes | 7 (38.9%) | 0 (0.0%) |
| 35 to 39 Minutes | 0 (0.0%) | 0 (0.0%) |
| 40 to 44 Minutes | 2 (11.1%) | 0 (0.0%) |
| 45 to 59 Minutes | 0 (0.0%) | 0 (0.0%) |
| 60 to 89 Minutes | 0 (0.0%) | 0 (0.0%) |
| 90 or more Minutes | 1 (5.6%) | 0 (0.0%) |
Time of Departure to Work by Sex in Randalia
The most frequent times of departure to work in Randalia are 6:30 AM to 6:59 AM (7, 38.9%) for males and 12:00 AM to 4:59 AM (7, 70.0%) for females.
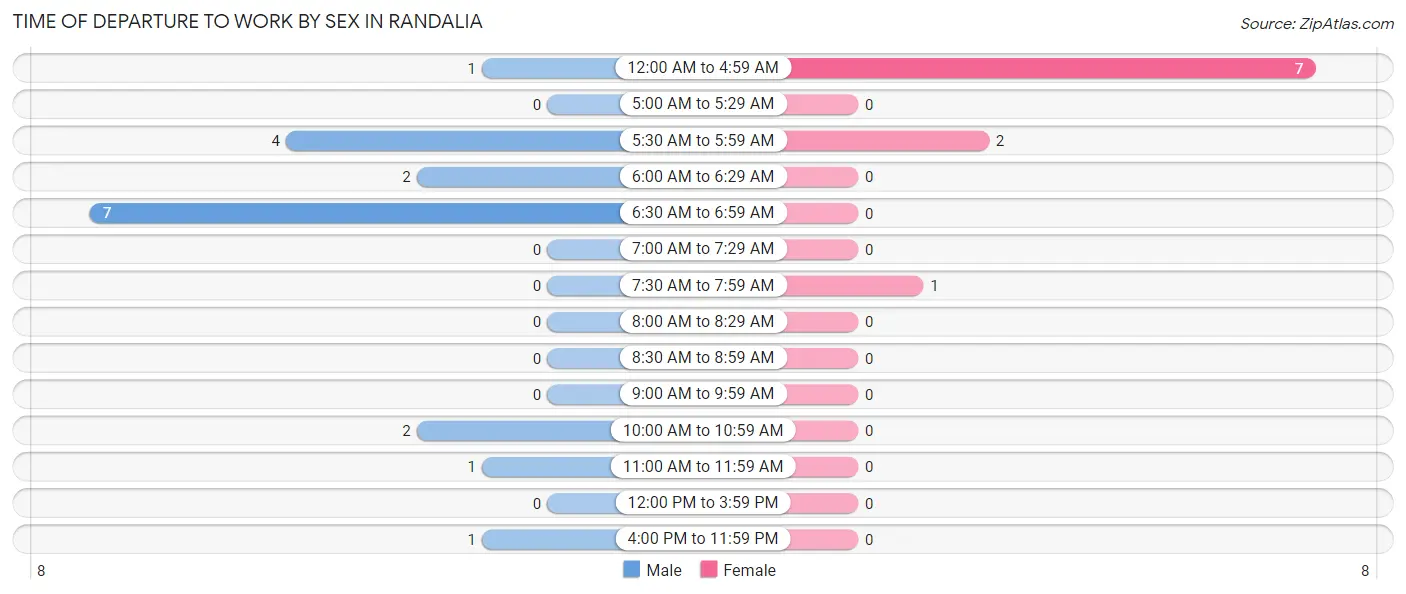
| Time of Departure | Male | Female |
| 12:00 AM to 4:59 AM | 1 (5.6%) | 7 (70.0%) |
| 5:00 AM to 5:29 AM | 0 (0.0%) | 0 (0.0%) |
| 5:30 AM to 5:59 AM | 4 (22.2%) | 2 (20.0%) |
| 6:00 AM to 6:29 AM | 2 (11.1%) | 0 (0.0%) |
| 6:30 AM to 6:59 AM | 7 (38.9%) | 0 (0.0%) |
| 7:00 AM to 7:29 AM | 0 (0.0%) | 0 (0.0%) |
| 7:30 AM to 7:59 AM | 0 (0.0%) | 1 (10.0%) |
| 8:00 AM to 8:29 AM | 0 (0.0%) | 0 (0.0%) |
| 8:30 AM to 8:59 AM | 0 (0.0%) | 0 (0.0%) |
| 9:00 AM to 9:59 AM | 0 (0.0%) | 0 (0.0%) |
| 10:00 AM to 10:59 AM | 2 (11.1%) | 0 (0.0%) |
| 11:00 AM to 11:59 AM | 1 (5.6%) | 0 (0.0%) |
| 12:00 PM to 3:59 PM | 0 (0.0%) | 0 (0.0%) |
| 4:00 PM to 11:59 PM | 1 (5.6%) | 0 (0.0%) |
| Total | 18 (100.0%) | 10 (100.0%) |
Housing Occupancy in Randalia
Occupancy by Ownership in Randalia
Of the total 32 dwellings in Randalia, owner-occupied units account for 32 (100.0%), while renter-occupied units make up 0 (0.0%).
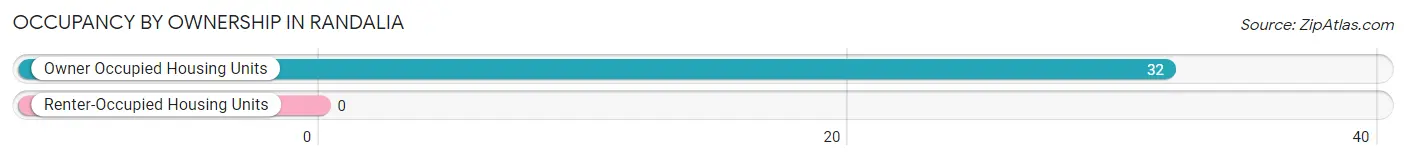
| Occupancy | # Housing Units | % Housing Units |
| Owner Occupied Housing Units | 32 | 100.0% |
| Renter-Occupied Housing Units | 0 | 0.0% |
| Total Occupied Housing Units | 32 | 100.0% |
Occupancy by Household Size in Randalia
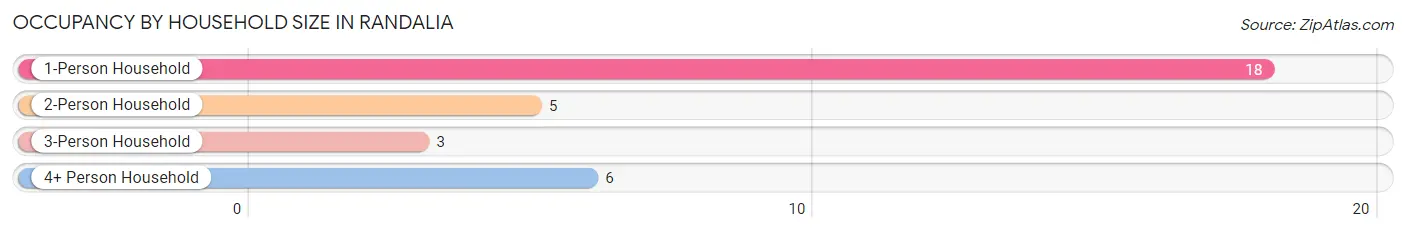
| Household Size | # Housing Units | % Housing Units |
| 1-Person Household | 18 | 56.2% |
| 2-Person Household | 5 | 15.6% |
| 3-Person Household | 3 | 9.4% |
| 4+ Person Household | 6 | 18.8% |
| Total Housing Units | 32 | 100.0% |
Occupancy by Ownership by Household Size in Randalia
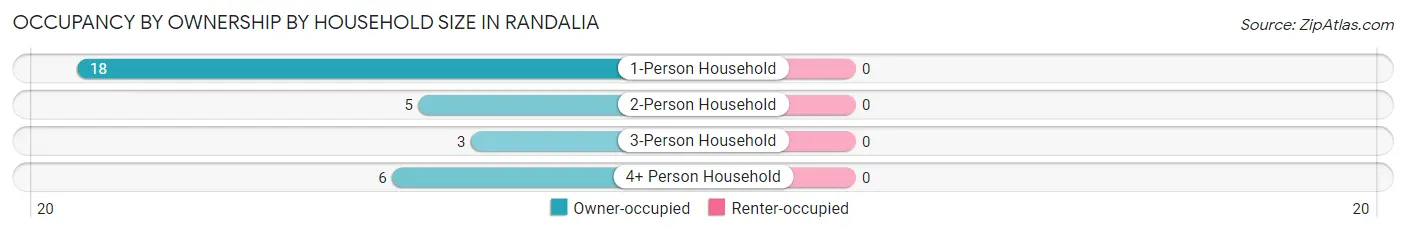
| Household Size | Owner-occupied | Renter-occupied |
| 1-Person Household | 18 (100.0%) | 0 (0.0%) |
| 2-Person Household | 5 (100.0%) | 0 (0.0%) |
| 3-Person Household | 3 (100.0%) | 0 (0.0%) |
| 4+ Person Household | 6 (100.0%) | 0 (0.0%) |
| Total Housing Units | 32 (100.0%) | 0 (0.0%) |
Occupancy by Educational Attainment in Randalia
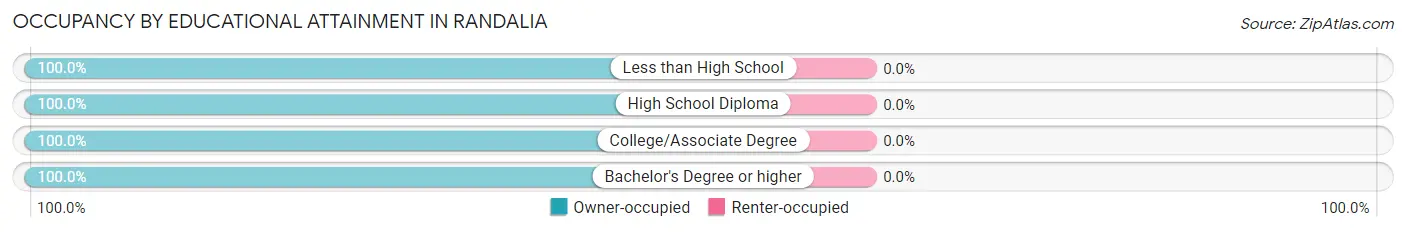
| Household Size | Owner-occupied | Renter-occupied |
| Less than High School | 1 (100.0%) | 0 (0.0%) |
| High School Diploma | 19 (100.0%) | 0 (0.0%) |
| College/Associate Degree | 4 (100.0%) | 0 (0.0%) |
| Bachelor's Degree or higher | 8 (100.0%) | 0 (0.0%) |
Occupancy by Age of Householder in Randalia
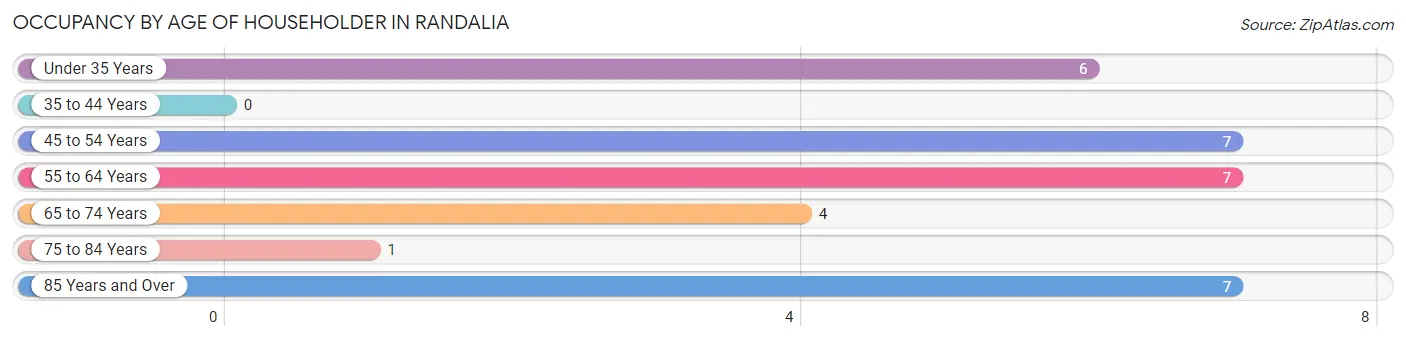
| Age Bracket | # Households | % Households |
| Under 35 Years | 6 | 18.8% |
| 35 to 44 Years | 0 | 0.0% |
| 45 to 54 Years | 7 | 21.9% |
| 55 to 64 Years | 7 | 21.9% |
| 65 to 74 Years | 4 | 12.5% |
| 75 to 84 Years | 1 | 3.1% |
| 85 Years and Over | 7 | 21.9% |
| Total | 32 | 100.0% |
Housing Finances in Randalia
Median Income by Occupancy in Randalia
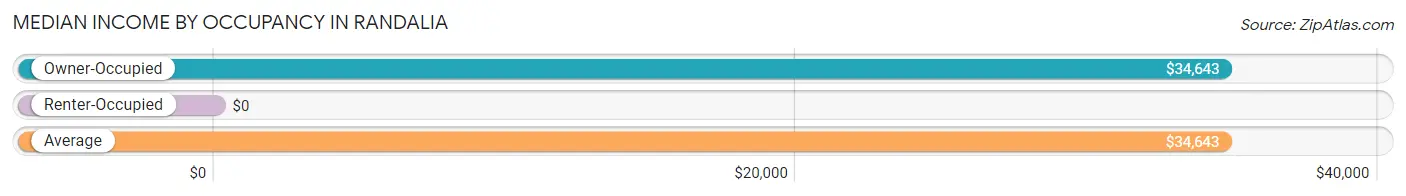
| Occupancy Type | # Households | Median Income |
| Owner-Occupied | 32 (100.0%) | $34,643 |
| Renter-Occupied | 0 (0.0%) | $0 |
| Average | 32 (100.0%) | $34,643 |
Occupancy by Householder Income Bracket in Randalia
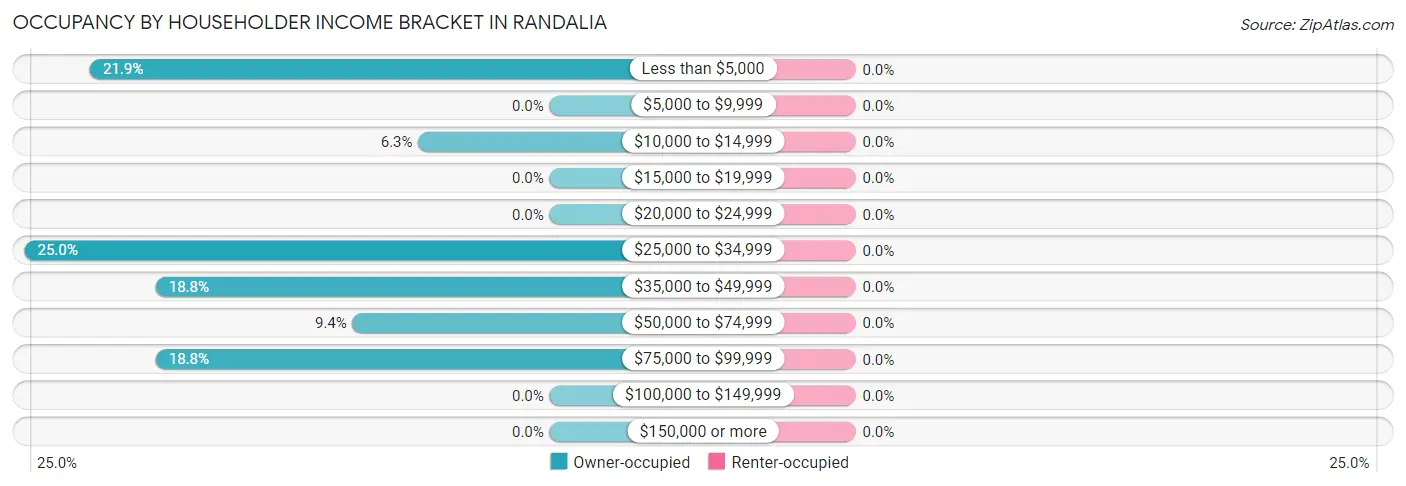
| Income Bracket | Owner-occupied | Renter-occupied |
| Less than $5,000 | 7 (21.9%) | 0 (0.0%) |
| $5,000 to $9,999 | 0 (0.0%) | 0 (0.0%) |
| $10,000 to $14,999 | 2 (6.2%) | 0 (0.0%) |
| $15,000 to $19,999 | 0 (0.0%) | 0 (0.0%) |
| $20,000 to $24,999 | 0 (0.0%) | 0 (0.0%) |
| $25,000 to $34,999 | 8 (25.0%) | 0 (0.0%) |
| $35,000 to $49,999 | 6 (18.8%) | 0 (0.0%) |
| $50,000 to $74,999 | 3 (9.4%) | 0 (0.0%) |
| $75,000 to $99,999 | 6 (18.8%) | 0 (0.0%) |
| $100,000 to $149,999 | 0 (0.0%) | 0 (0.0%) |
| $150,000 or more | 0 (0.0%) | 0 (0.0%) |
| Total | 32 (100.0%) | 0 (0.0%) |
Monthly Housing Cost Tiers in Randalia
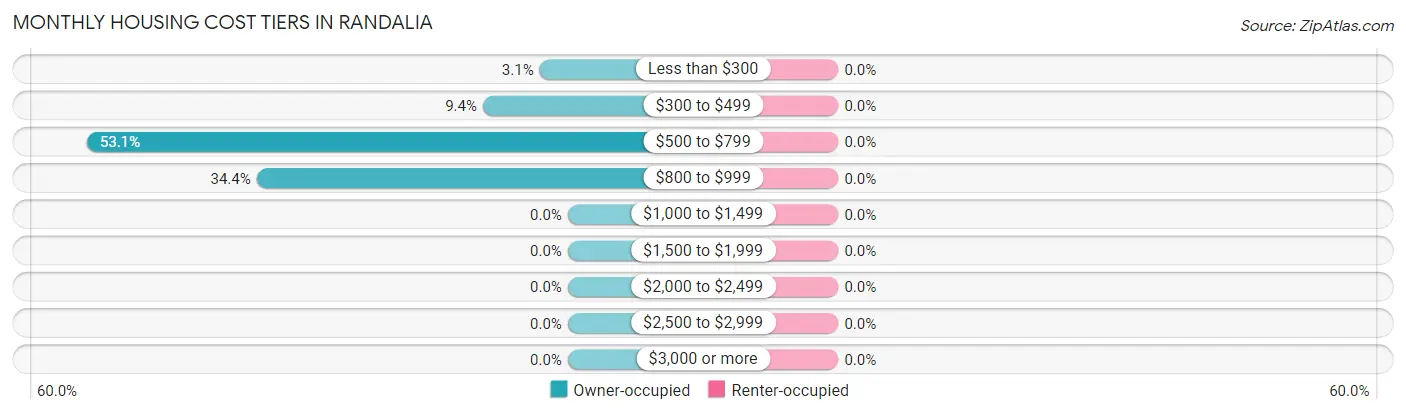
| Monthly Cost | Owner-occupied | Renter-occupied |
| Less than $300 | 1 (3.1%) | 0 (0.0%) |
| $300 to $499 | 3 (9.4%) | 0 (0.0%) |
| $500 to $799 | 17 (53.1%) | 0 (0.0%) |
| $800 to $999 | 11 (34.4%) | 0 (0.0%) |
| $1,000 to $1,499 | 0 (0.0%) | 0 (0.0%) |
| $1,500 to $1,999 | 0 (0.0%) | 0 (0.0%) |
| $2,000 to $2,499 | 0 (0.0%) | 0 (0.0%) |
| $2,500 to $2,999 | 0 (0.0%) | 0 (0.0%) |
| $3,000 or more | 0 (0.0%) | 0 (0.0%) |
| Total | 32 (100.0%) | 0 (0.0%) |
Physical Housing Characteristics in Randalia
Housing Structures in Randalia
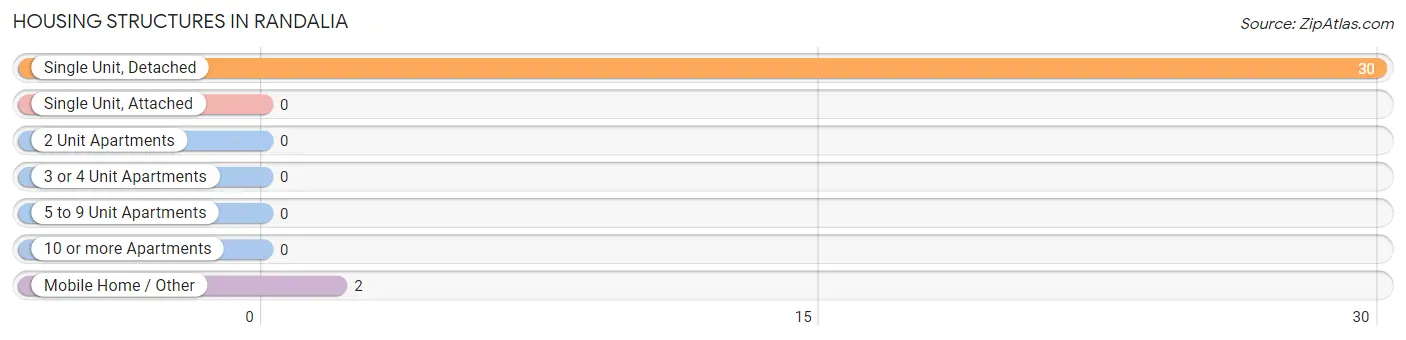
| Structure Type | # Housing Units | % Housing Units |
| Single Unit, Detached | 30 | 93.8% |
| Single Unit, Attached | 0 | 0.0% |
| 2 Unit Apartments | 0 | 0.0% |
| 3 or 4 Unit Apartments | 0 | 0.0% |
| 5 to 9 Unit Apartments | 0 | 0.0% |
| 10 or more Apartments | 0 | 0.0% |
| Mobile Home / Other | 2 | 6.2% |
| Total | 32 | 100.0% |
Housing Structures by Occupancy in Randalia
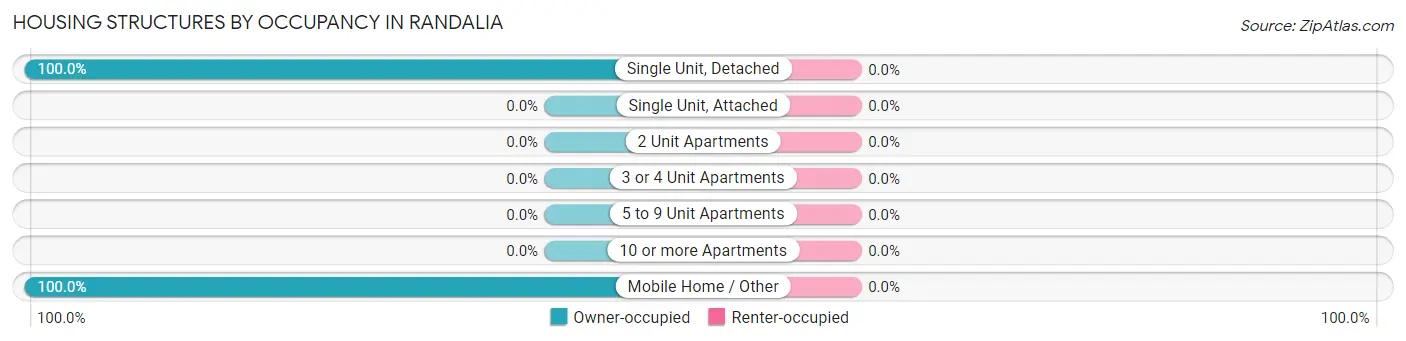
| Structure Type | Owner-occupied | Renter-occupied |
| Single Unit, Detached | 30 (100.0%) | 0 (0.0%) |
| Single Unit, Attached | 0 (0.0%) | 0 (0.0%) |
| 2 Unit Apartments | 0 (0.0%) | 0 (0.0%) |
| 3 or 4 Unit Apartments | 0 (0.0%) | 0 (0.0%) |
| 5 to 9 Unit Apartments | 0 (0.0%) | 0 (0.0%) |
| 10 or more Apartments | 0 (0.0%) | 0 (0.0%) |
| Mobile Home / Other | 2 (100.0%) | 0 (0.0%) |
| Total | 32 (100.0%) | 0 (0.0%) |
Housing Structures by Number of Rooms in Randalia
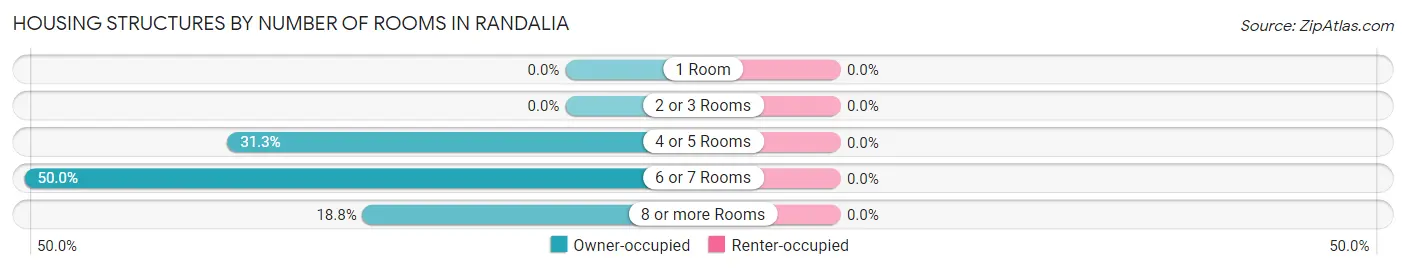
| Number of Rooms | Owner-occupied | Renter-occupied |
| 1 Room | 0 (0.0%) | 0 (0.0%) |
| 2 or 3 Rooms | 0 (0.0%) | 0 (0.0%) |
| 4 or 5 Rooms | 10 (31.2%) | 0 (0.0%) |
| 6 or 7 Rooms | 16 (50.0%) | 0 (0.0%) |
| 8 or more Rooms | 6 (18.8%) | 0 (0.0%) |
| Total | 32 (100.0%) | 0 (0.0%) |
Housing Structure by Heating Type in Randalia
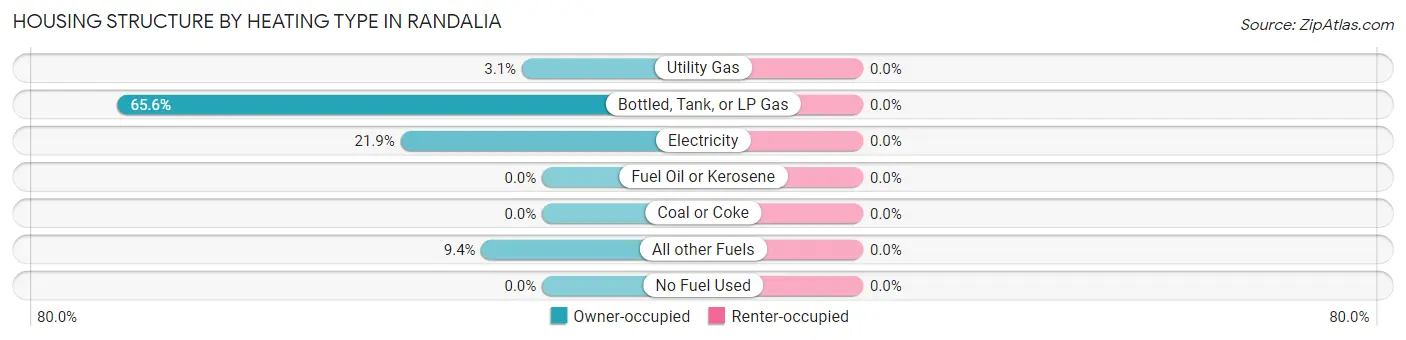
| Heating Type | Owner-occupied | Renter-occupied |
| Utility Gas | 1 (3.1%) | 0 (0.0%) |
| Bottled, Tank, or LP Gas | 21 (65.6%) | 0 (0.0%) |
| Electricity | 7 (21.9%) | 0 (0.0%) |
| Fuel Oil or Kerosene | 0 (0.0%) | 0 (0.0%) |
| Coal or Coke | 0 (0.0%) | 0 (0.0%) |
| All other Fuels | 3 (9.4%) | 0 (0.0%) |
| No Fuel Used | 0 (0.0%) | 0 (0.0%) |
| Total | 32 (100.0%) | 0 (0.0%) |
Household Vehicle Usage in Randalia
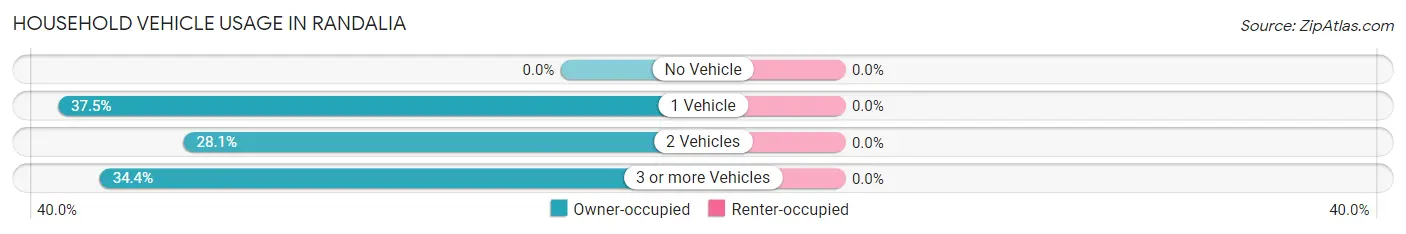
| Vehicles per Household | Owner-occupied | Renter-occupied |
| No Vehicle | 0 (0.0%) | 0 (0.0%) |
| 1 Vehicle | 12 (37.5%) | 0 (0.0%) |
| 2 Vehicles | 9 (28.1%) | 0 (0.0%) |
| 3 or more Vehicles | 11 (34.4%) | 0 (0.0%) |
| Total | 32 (100.0%) | 0 (0.0%) |
Real Estate & Mortgages in Randalia
Real Estate and Mortgage Overview in Randalia
| Characteristic | Without Mortgage | With Mortgage |
| Housing Units | 13 | 19 |
| Median Property Value | $126,800 | $38,800 |
| Median Household Income | - | - |
| Monthly Housing Costs | $707 | $0 |
| Real Estate Taxes | $900 | $0 |
Property Value by Mortgage Status in Randalia
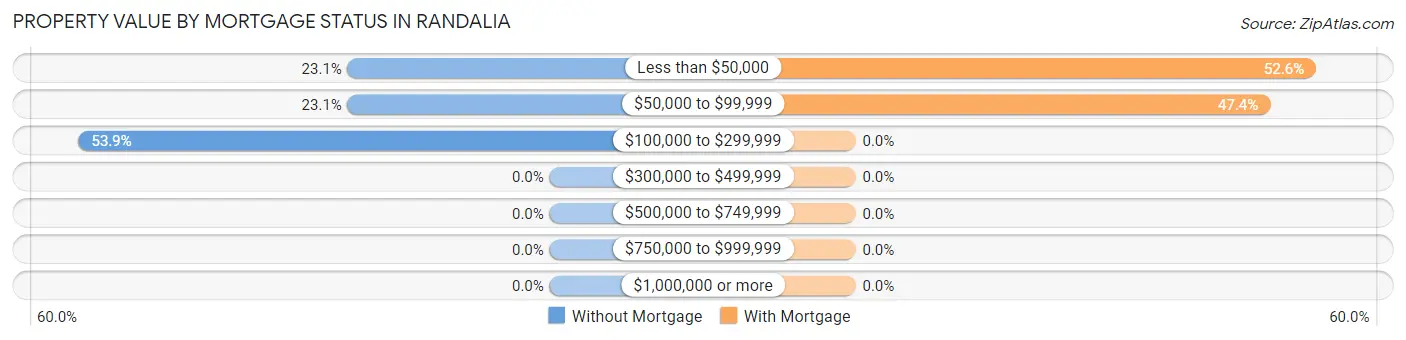
| Property Value | Without Mortgage | With Mortgage |
| Less than $50,000 | 3 (23.1%) | 10 (52.6%) |
| $50,000 to $99,999 | 3 (23.1%) | 9 (47.4%) |
| $100,000 to $299,999 | 7 (53.8%) | 0 (0.0%) |
| $300,000 to $499,999 | 0 (0.0%) | 0 (0.0%) |
| $500,000 to $749,999 | 0 (0.0%) | 0 (0.0%) |
| $750,000 to $999,999 | 0 (0.0%) | 0 (0.0%) |
| $1,000,000 or more | 0 (0.0%) | 0 (0.0%) |
| Total | 13 (100.0%) | 19 (100.0%) |
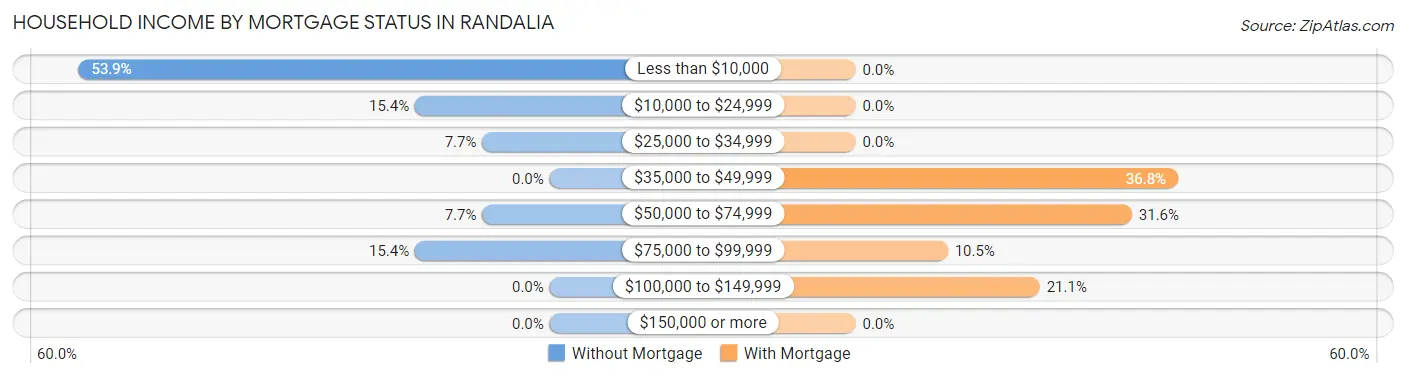
Household Income by Mortgage Status in Randalia
| Household Income | Without Mortgage | With Mortgage |
| Less than $10,000 | 7 (53.8%) | 0 (0.0%) |
| $10,000 to $24,999 | 2 (15.4%) | 0 (0.0%) |
| $25,000 to $34,999 | 1 (7.7%) | 0 (0.0%) |
| $35,000 to $49,999 | 0 (0.0%) | 7 (36.8%) |
| $50,000 to $74,999 | 1 (7.7%) | 6 (31.6%) |
| $75,000 to $99,999 | 2 (15.4%) | 2 (10.5%) |
| $100,000 to $149,999 | 0 (0.0%) | 4 (21.0%) |
| $150,000 or more | 0 (0.0%) | 0 (0.0%) |
| Total | 13 (100.0%) | 19 (100.0%) |
Property Value to Household Income Ratio in Randalia
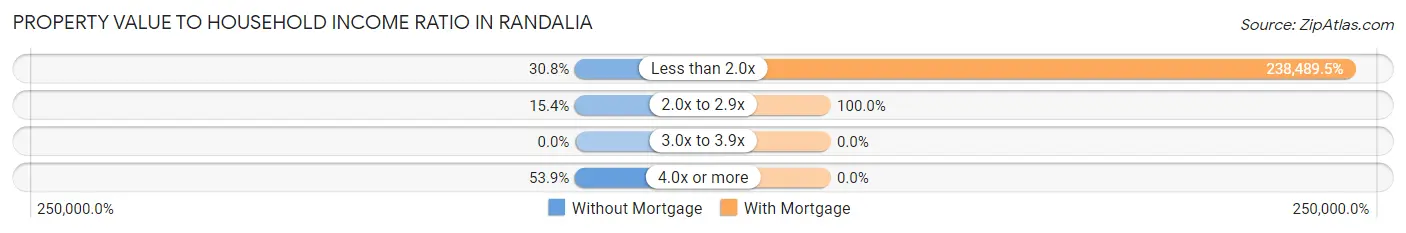
| Value-to-Income Ratio | Without Mortgage | With Mortgage |
| Less than 2.0x | 4 (30.8%) | 45,313 (238,489.5%) |
| 2.0x to 2.9x | 2 (15.4%) | 19 (100.0%) |
| 3.0x to 3.9x | 0 (0.0%) | 0 (0.0%) |
| 4.0x or more | 7 (53.8%) | 0 (0.0%) |
| Total | 13 (100.0%) | 19 (100.0%) |
Real Estate Taxes by Mortgage Status in Randalia
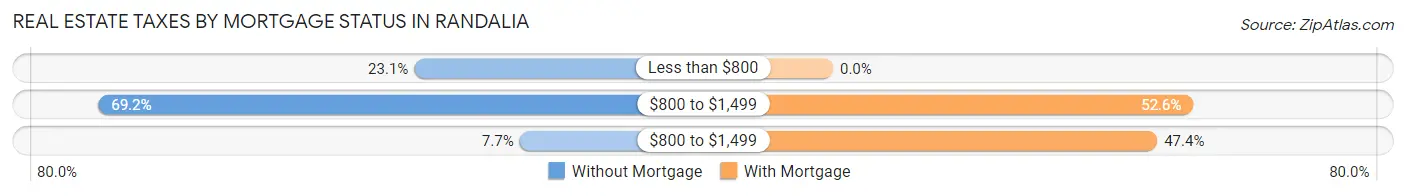
| Property Taxes | Without Mortgage | With Mortgage |
| Less than $800 | 3 (23.1%) | 0 (0.0%) |
| $800 to $1,499 | 9 (69.2%) | 10 (52.6%) |
| $800 to $1,499 | 1 (7.7%) | 9 (47.4%) |
| Total | 13 (100.0%) | 19 (100.0%) |
Health & Disability in Randalia
Health Insurance Coverage by Age in Randalia
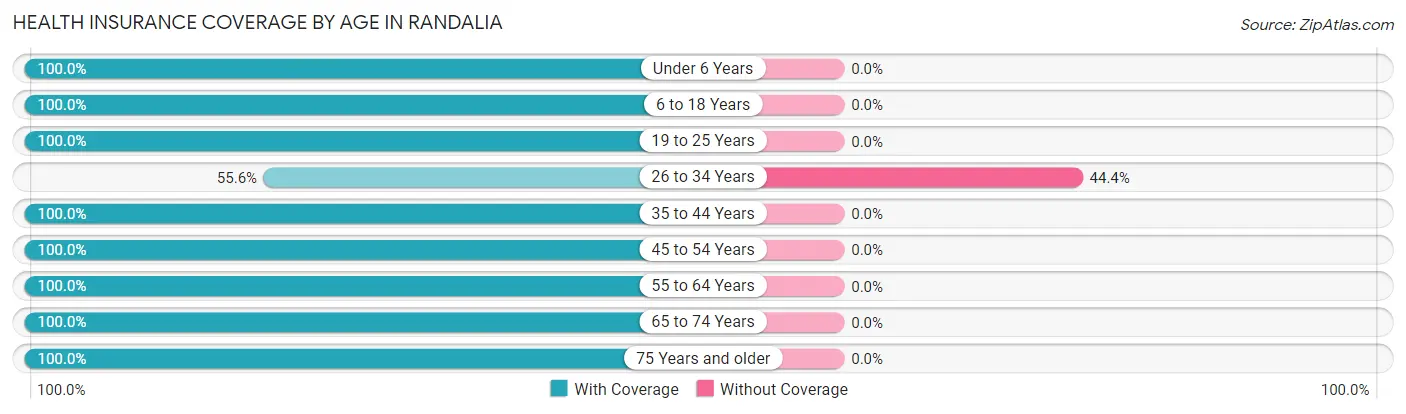
| Age Bracket | With Coverage | Without Coverage |
| Under 6 Years | 12 (100.0%) | 0 (0.0%) |
| 6 to 18 Years | 5 (100.0%) | 0 (0.0%) |
| 19 to 25 Years | 2 (100.0%) | 0 (0.0%) |
| 26 to 34 Years | 5 (55.6%) | 4 (44.4%) |
| 35 to 44 Years | 2 (100.0%) | 0 (0.0%) |
| 45 to 54 Years | 7 (100.0%) | 0 (0.0%) |
| 55 to 64 Years | 14 (100.0%) | 0 (0.0%) |
| 65 to 74 Years | 5 (100.0%) | 0 (0.0%) |
| 75 Years and older | 9 (100.0%) | 0 (0.0%) |
| Total | 61 (93.9%) | 4 (6.1%) |
Health Insurance Coverage by Citizenship Status in Randalia
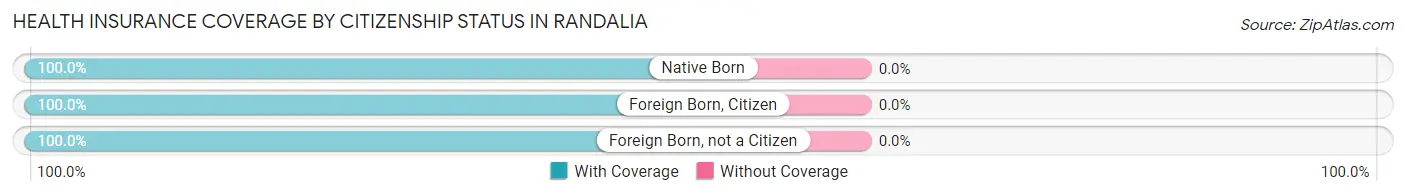
| Citizenship Status | With Coverage | Without Coverage |
| Native Born | 12 (100.0%) | 0 (0.0%) |
| Foreign Born, Citizen | 5 (100.0%) | 0 (0.0%) |
| Foreign Born, not a Citizen | 2 (100.0%) | 0 (0.0%) |
Health Insurance Coverage by Household Income in Randalia
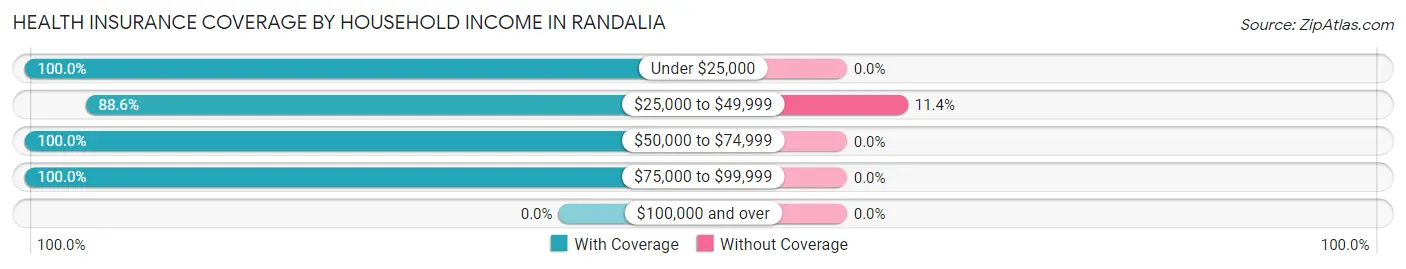
| Household Income | With Coverage | Without Coverage |
| Under $25,000 | 9 (100.0%) | 0 (0.0%) |
| $25,000 to $49,999 | 31 (88.6%) | 4 (11.4%) |
| $50,000 to $74,999 | 6 (100.0%) | 0 (0.0%) |
| $75,000 to $99,999 | 15 (100.0%) | 0 (0.0%) |
| $100,000 and over | 0 (0.0%) | 0 (0.0%) |
Public vs Private Health Insurance Coverage by Age in Randalia
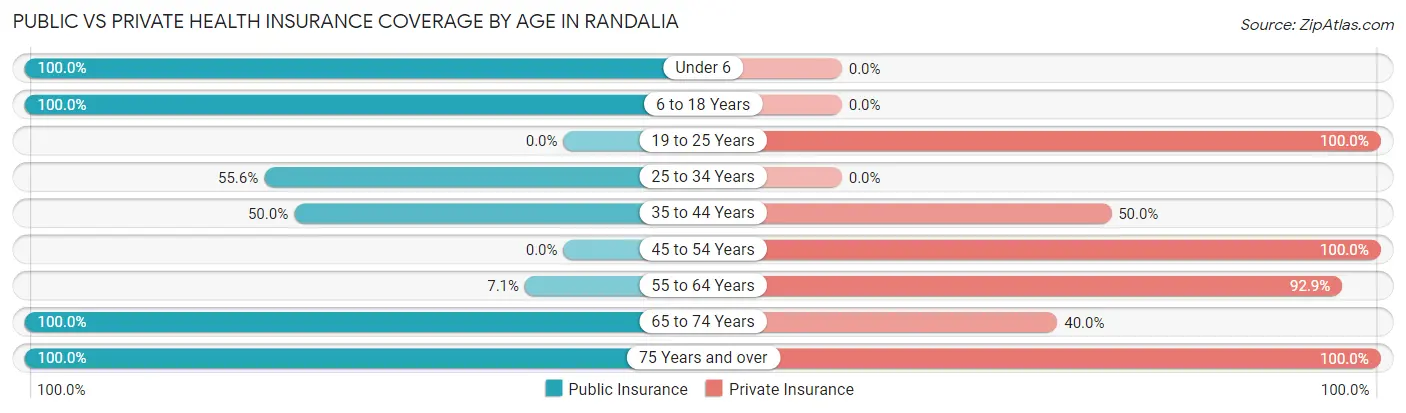
| Age Bracket | Public Insurance | Private Insurance |
| Under 6 | 12 (100.0%) | 0 (0.0%) |
| 6 to 18 Years | 5 (100.0%) | 0 (0.0%) |
| 19 to 25 Years | 0 (0.0%) | 2 (100.0%) |
| 25 to 34 Years | 5 (55.6%) | 0 (0.0%) |
| 35 to 44 Years | 1 (50.0%) | 1 (50.0%) |
| 45 to 54 Years | 0 (0.0%) | 7 (100.0%) |
| 55 to 64 Years | 1 (7.1%) | 13 (92.9%) |
| 65 to 74 Years | 5 (100.0%) | 2 (40.0%) |
| 75 Years and over | 9 (100.0%) | 9 (100.0%) |
| Total | 38 (58.5%) | 34 (52.3%) |
Disability Status by Sex by Age in Randalia
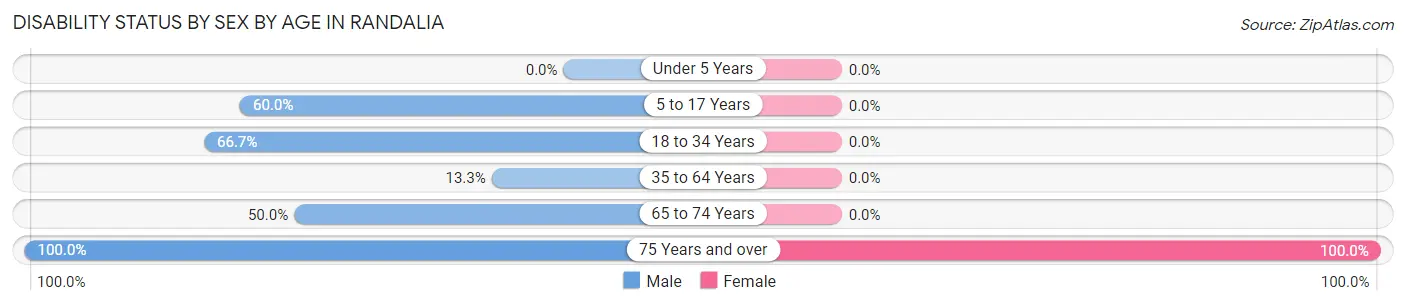
| Age Bracket | Male | Female |
| Under 5 Years | 0 (0.0%) | 0 (0.0%) |
| 5 to 17 Years | 3 (60.0%) | 0 (0.0%) |
| 18 to 34 Years | 4 (66.7%) | 0 (0.0%) |
| 35 to 64 Years | 2 (13.3%) | 0 (0.0%) |
| 65 to 74 Years | 1 (50.0%) | 0 (0.0%) |
| 75 Years and over | 1 (100.0%) | 8 (100.0%) |
Disability Class by Sex by Age in Randalia
Disability Class: Hearing Difficulty
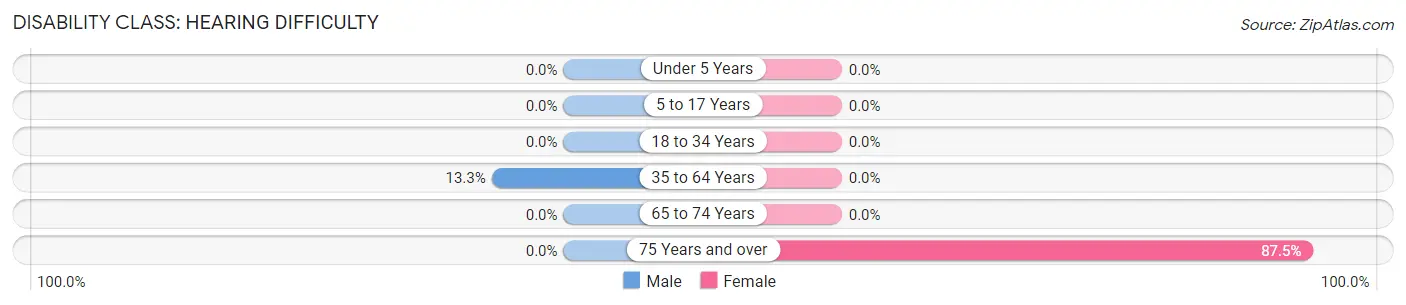
| Age Bracket | Male | Female |
| Under 5 Years | 0 (0.0%) | 0 (0.0%) |
| 5 to 17 Years | 0 (0.0%) | 0 (0.0%) |
| 18 to 34 Years | 0 (0.0%) | 0 (0.0%) |
| 35 to 64 Years | 2 (13.3%) | 0 (0.0%) |
| 65 to 74 Years | 0 (0.0%) | 0 (0.0%) |
| 75 Years and over | 0 (0.0%) | 7 (87.5%) |
Disability Class: Vision Difficulty
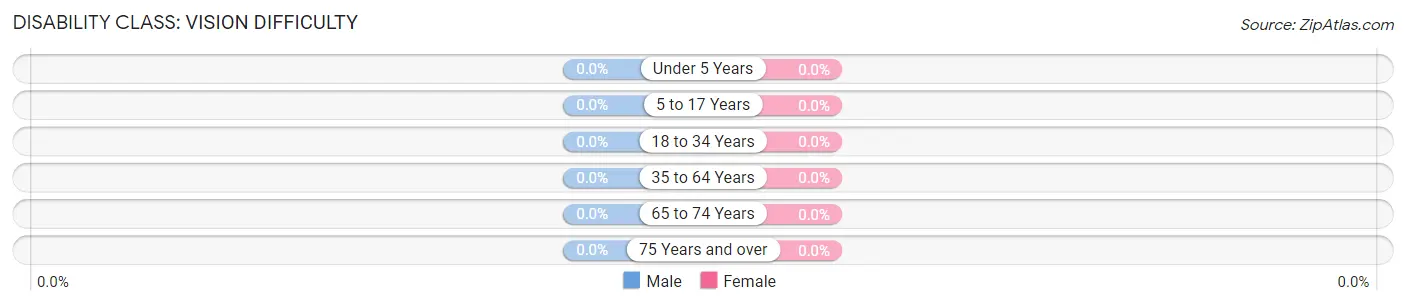
| Age Bracket | Male | Female |
| Under 5 Years | 0 (0.0%) | 0 (0.0%) |
| 5 to 17 Years | 0 (0.0%) | 0 (0.0%) |
| 18 to 34 Years | 0 (0.0%) | 0 (0.0%) |
| 35 to 64 Years | 0 (0.0%) | 0 (0.0%) |
| 65 to 74 Years | 0 (0.0%) | 0 (0.0%) |
| 75 Years and over | 0 (0.0%) | 0 (0.0%) |
Disability Class: Cognitive Difficulty
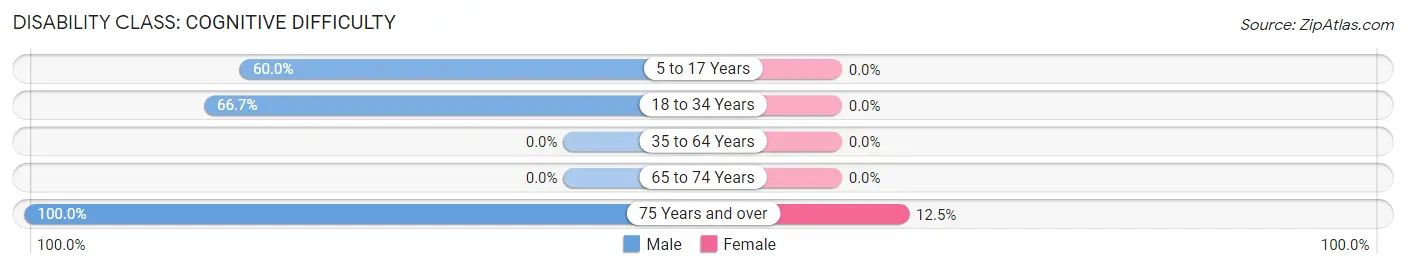
| Age Bracket | Male | Female |
| 5 to 17 Years | 3 (60.0%) | 0 (0.0%) |
| 18 to 34 Years | 4 (66.7%) | 0 (0.0%) |
| 35 to 64 Years | 0 (0.0%) | 0 (0.0%) |
| 65 to 74 Years | 0 (0.0%) | 0 (0.0%) |
| 75 Years and over | 1 (100.0%) | 1 (12.5%) |
Disability Class: Ambulatory Difficulty
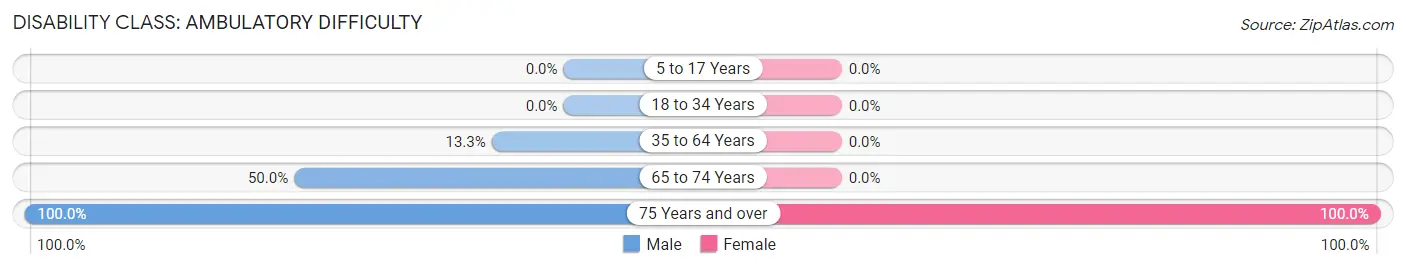
| Age Bracket | Male | Female |
| 5 to 17 Years | 0 (0.0%) | 0 (0.0%) |
| 18 to 34 Years | 0 (0.0%) | 0 (0.0%) |
| 35 to 64 Years | 2 (13.3%) | 0 (0.0%) |
| 65 to 74 Years | 1 (50.0%) | 0 (0.0%) |
| 75 Years and over | 1 (100.0%) | 8 (100.0%) |
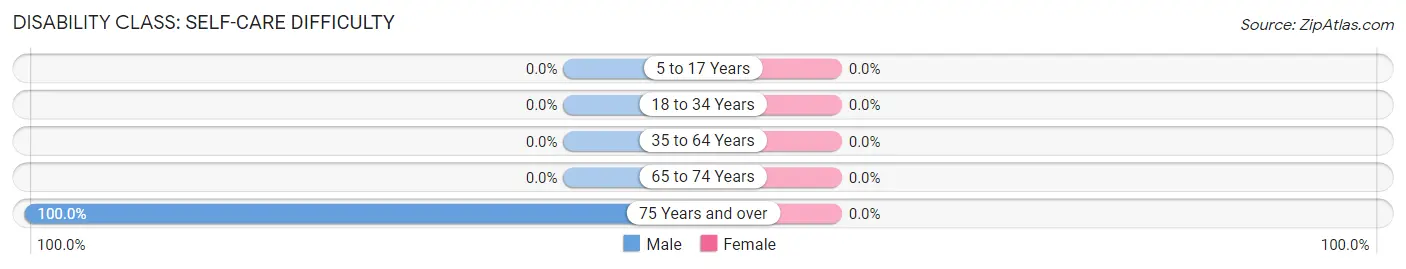
Disability Class: Self-Care Difficulty
| Age Bracket | Male | Female |
| 5 to 17 Years | 0 (0.0%) | 0 (0.0%) |
| 18 to 34 Years | 0 (0.0%) | 0 (0.0%) |
| 35 to 64 Years | 0 (0.0%) | 0 (0.0%) |
| 65 to 74 Years | 0 (0.0%) | 0 (0.0%) |
| 75 Years and over | 1 (100.0%) | 0 (0.0%) |
Technology Access in Randalia
Computing Device Access in Randalia
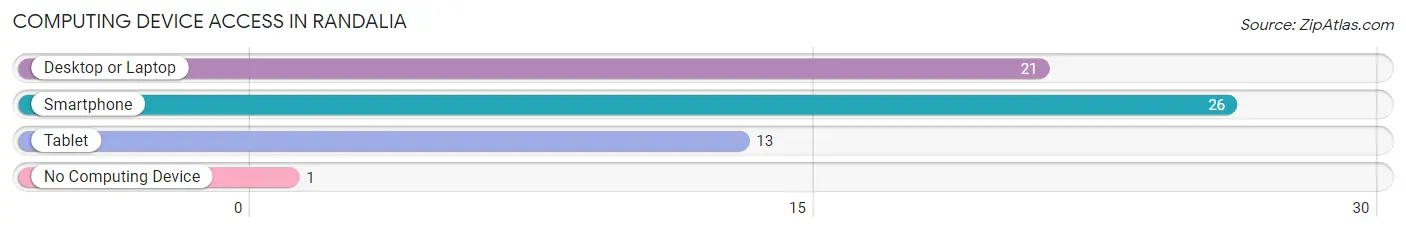
| Device Type | # Households | % Households |
| Desktop or Laptop | 21 | 65.6% |
| Smartphone | 26 | 81.2% |
| Tablet | 13 | 40.6% |
| No Computing Device | 1 | 3.1% |
| Total | 32 | 100.0% |
Internet Access in Randalia
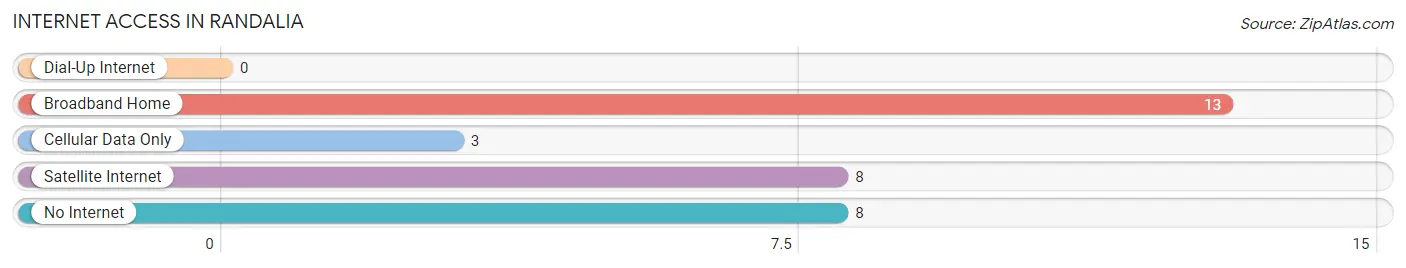
| Internet Type | # Households | % Households |
| Dial-Up Internet | 0 | 0.0% |
| Broadband Home | 13 | 40.6% |
| Cellular Data Only | 3 | 9.4% |
| Satellite Internet | 8 | 25.0% |
| No Internet | 8 | 25.0% |
| Total | 32 | 100.0% |
Randalia Summary
Randalia, Iowa is a small town located in Fayette County, Iowa. It is situated in the northeast corner of the state, approximately 30 miles from the Mississippi River. The town was founded in 1854 and has a population of approximately 500 people.
Randalia is located in the rolling hills of the Driftless Area, a region of the Midwest that was not glaciated during the last ice age. This has resulted in a unique landscape of steep hills, deep valleys, and winding rivers. The town is situated on the banks of the Turkey River, which provides a source of recreation for the locals.
The economy of Randalia is largely based on agriculture. The town is surrounded by fertile farmland, and many of the residents are involved in farming or related activities. The town also has a small manufacturing sector, with a few small businesses producing a variety of products.
The demographics of Randalia are largely homogeneous. The majority of the population is white, with a small minority of African Americans and Hispanics. The median household income is slightly below the state average, and the poverty rate is slightly higher than the state average.
Randalia is served by a single school district, the Randalia Community School District. The district consists of one elementary school, one middle school, and one high school. The district also operates a public library and a community center.
Randalia is a small, rural town with a rich history and a strong sense of community. The town is home to a variety of festivals and events throughout the year, including the annual Turkey River Festival and the Randalia Days celebration. The town also has a variety of recreational activities, including fishing, camping, and hiking.
Randalia is a great place to live and work, and it offers a unique combination of rural charm and modern amenities. The town is a great place to raise a family, and it is a great place to retire. With its beautiful landscape, friendly people, and strong sense of community, Randalia is a great place to call home.
Common Questions
What is Per Capita Income in Randalia?
Per Capita income in Randalia is $20,371.
What is the Median Family Income in Randalia?
Median Family Income in Randalia is $73,750.
What is the Median Household income in Randalia?
Median Household Income in Randalia is $34,643.
What is Income or Wage Gap in Randalia?
Income or Wage Gap in Randalia is 11.8%.
Women in Randalia earn 88.2 cents for every dollar earned by a man.
What is Inequality or Gini Index in Randalia?
Inequality or Gini Index in Randalia is 0.41.
What is the Total Population of Randalia?
Total Population of Randalia is 65.
What is the Total Male Population of Randalia?
Total Male Population of Randalia is 29.
What is the Total Female Population of Randalia?
Total Female Population of Randalia is 36.
What is the Ratio of Males per 100 Females in Randalia?
There are 80.56 Males per 100 Females in Randalia.
What is the Ratio of Females per 100 Males in Randalia?
There are 124.14 Females per 100 Males in Randalia.
What is the Median Population Age in Randalia?
Median Population Age in Randalia is 48.4 Years.
What is the Average Family Size in Randalia
Average Family Size in Randalia is 3.1 People.
What is the Average Household Size in Randalia
Average Household Size in Randalia is 2.0 People.
How Large is the Labor Force in Randalia?
There are 33 People in the Labor Forcein in Randalia.
What is the Percentage of People in the Labor Force in Randalia?
68.8% of People are in the Labor Force in Randalia.
What is the Unemployment Rate in Randalia?
Unemployment Rate in Randalia is 12.1%.