Osceola, IA Map & Demographics
Osceola Map
Osceola Overview
$28,635
PER CAPITA INCOME
$66,594
AVG FAMILY INCOME
$55,208
AVG HOUSEHOLD INCOME
31.4%
WAGE / INCOME GAP [ % ]
68.6¢/ $1
WAGE / INCOME GAP [ $ ]
0.47
INEQUALITY / GINI INDEX
5,455
TOTAL POPULATION
2,801
MALE POPULATION
2,654
FEMALE POPULATION
105.54
MALES / 100 FEMALES
94.75
FEMALES / 100 MALES
36.6
MEDIAN AGE
2.8
AVG FAMILY SIZE
2.3
AVG HOUSEHOLD SIZE
2,854
LABOR FORCE [ PEOPLE ]
66.0%
PERCENT IN LABOR FORCE
5.8%
UNEMPLOYMENT RATE
Osceola Zip Codes
Osceola Area Codes
Income in Osceola
Income Overview in Osceola
Per Capita Income in Osceola is $28,635, while median incomes of families and households are $66,594 and $55,208 respectively.
| Characteristic | Number | Measure |
| Per Capita Income | 5,455 | $28,635 |
| Median Family Income | 1,482 | $66,594 |
| Mean Family Income | 1,482 | $83,630 |
| Median Household Income | 2,299 | $55,208 |
| Mean Household Income | 2,299 | $67,448 |
| Income Deficit | 1,482 | $0 |
| Wage / Income Gap (%) | 5,455 | 31.41% |
| Wage / Income Gap ($) | 5,455 | 68.59¢ per $1 |
| Gini / Inequality Index | 5,455 | 0.47 |
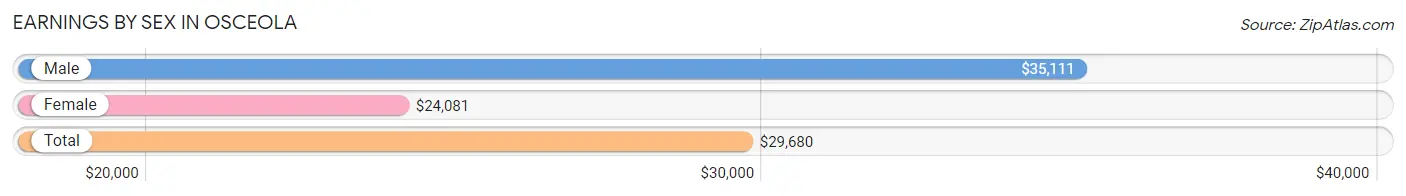
Earnings by Sex in Osceola
Average Earnings in Osceola are $29,680, $35,111 for men and $24,081 for women, a difference of 31.4%.
| Sex | Number | Average Earnings |
| Male | 1,531 (51.5%) | $35,111 |
| Female | 1,439 (48.4%) | $24,081 |
| Total | 2,970 (100.0%) | $29,680 |
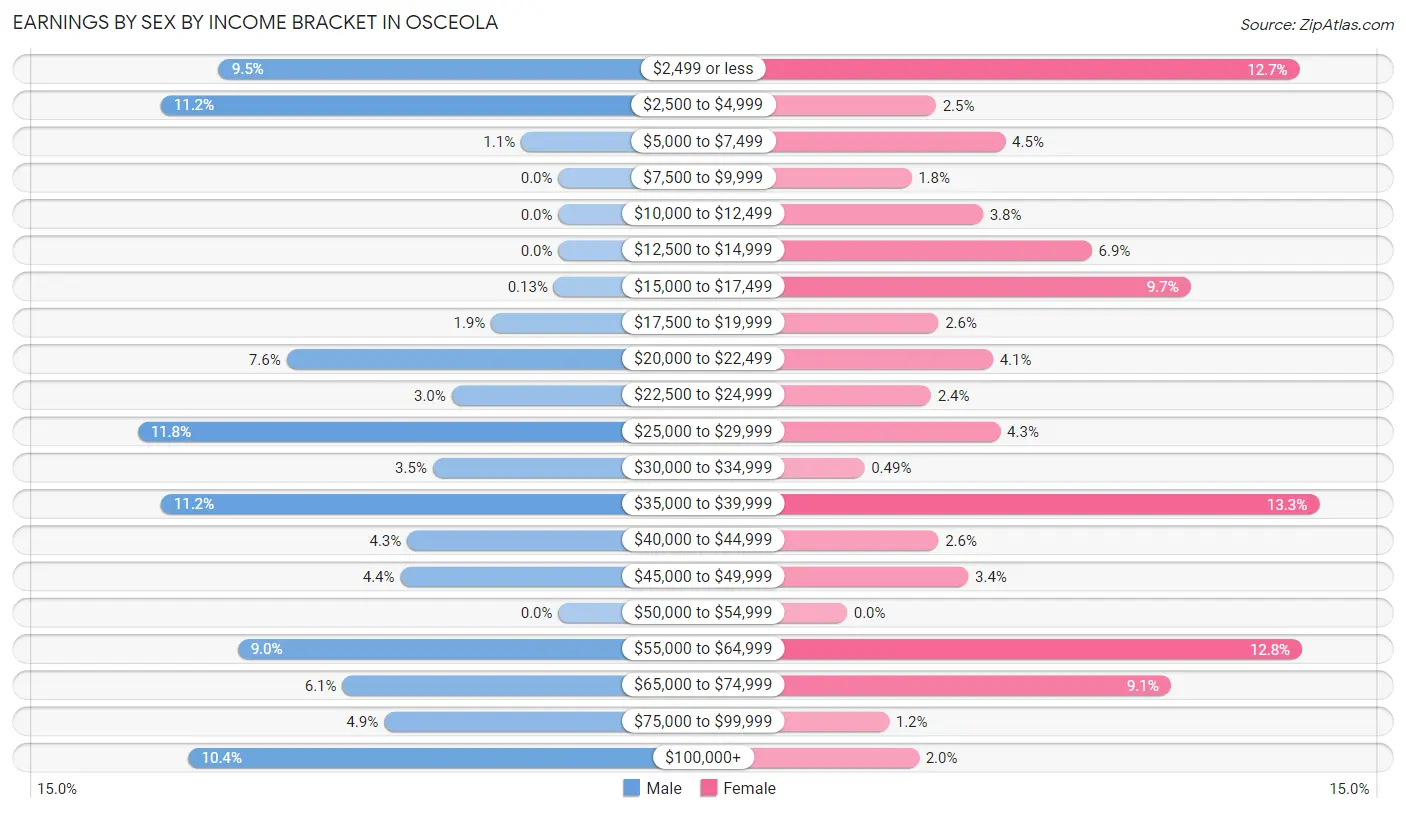
Earnings by Sex by Income Bracket in Osceola
The most common earnings brackets in Osceola are $25,000 to $29,999 for men (181 | 11.8%) and $35,000 to $39,999 for women (191 | 13.3%).
| Income | Male | Female |
| $2,499 or less | 146 (9.5%) | 183 (12.7%) |
| $2,500 to $4,999 | 171 (11.2%) | 36 (2.5%) |
| $5,000 to $7,499 | 16 (1.1%) | 64 (4.4%) |
| $7,500 to $9,999 | 0 (0.0%) | 26 (1.8%) |
| $10,000 to $12,499 | 0 (0.0%) | 55 (3.8%) |
| $12,500 to $14,999 | 0 (0.0%) | 99 (6.9%) |
| $15,000 to $17,499 | 2 (0.1%) | 139 (9.7%) |
| $17,500 to $19,999 | 29 (1.9%) | 37 (2.6%) |
| $20,000 to $22,499 | 117 (7.6%) | 59 (4.1%) |
| $22,500 to $24,999 | 46 (3.0%) | 34 (2.4%) |
| $25,000 to $29,999 | 181 (11.8%) | 62 (4.3%) |
| $30,000 to $34,999 | 54 (3.5%) | 7 (0.5%) |
| $35,000 to $39,999 | 171 (11.2%) | 191 (13.3%) |
| $40,000 to $44,999 | 65 (4.3%) | 37 (2.6%) |
| $45,000 to $49,999 | 68 (4.4%) | 49 (3.4%) |
| $50,000 to $54,999 | 0 (0.0%) | 0 (0.0%) |
| $55,000 to $64,999 | 138 (9.0%) | 184 (12.8%) |
| $65,000 to $74,999 | 93 (6.1%) | 131 (9.1%) |
| $75,000 to $99,999 | 75 (4.9%) | 17 (1.2%) |
| $100,000+ | 159 (10.4%) | 29 (2.0%) |
| Total | 1,531 (100.0%) | 1,439 (100.0%) |
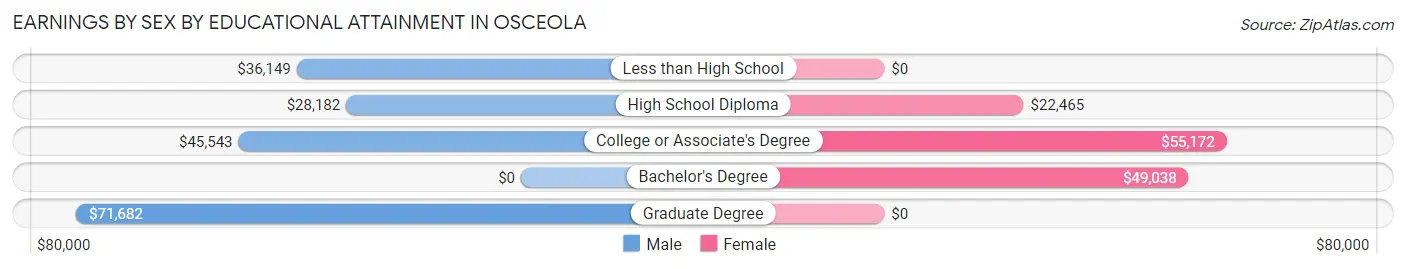
Earnings by Sex by Educational Attainment in Osceola
Average earnings in Osceola are $39,457 for men and $36,056 for women, a difference of 8.6%. Men with an educational attainment of graduate degree enjoy the highest average annual earnings of $71,682, while those with high school diploma education earn the least with $28,182. Women with an educational attainment of college or associate's degree earn the most with the average annual earnings of $55,172, while those with high school diploma education have the smallest earnings of $22,465.
| Educational Attainment | Male Income | Female Income |
| Less than High School | $36,149 | $0 |
| High School Diploma | $28,182 | $22,465 |
| College or Associate's Degree | $45,543 | $55,172 |
| Bachelor's Degree | - | - |
| Graduate Degree | $71,682 | $0 |
| Total | $39,457 | $36,056 |
Family Income in Osceola
Family Income Brackets in Osceola
According to the Osceola family income data, there are 411 families falling into the $50,000 to $74,999 income range, which is the most common income bracket and makes up 27.7% of all families.
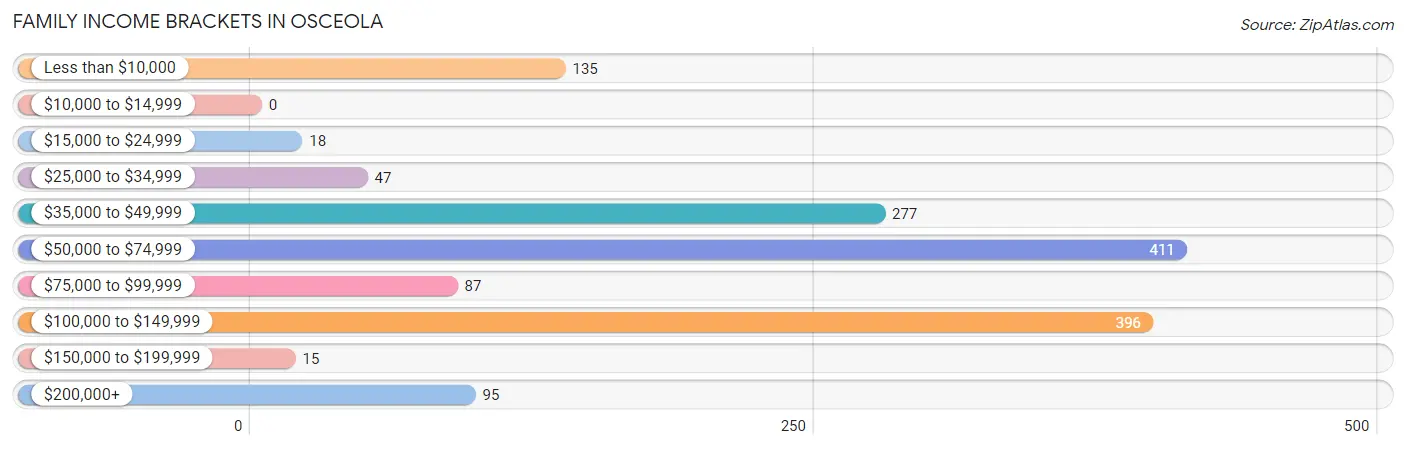
| Income Bracket | # Families | % Families |
| Less than $10,000 | 135 | 9.1% |
| $10,000 to $14,999 | 0 | 0.0% |
| $15,000 to $24,999 | 18 | 1.2% |
| $25,000 to $34,999 | 47 | 3.2% |
| $35,000 to $49,999 | 277 | 18.7% |
| $50,000 to $74,999 | 411 | 27.7% |
| $75,000 to $99,999 | 87 | 5.9% |
| $100,000 to $149,999 | 396 | 26.7% |
| $150,000 to $199,999 | 15 | 1.0% |
| $200,000+ | 95 | 6.4% |
Family Income by Famaliy Size in Osceola
2-person families (862 | 58.2%) account for the highest median family income in Osceola with $77,778 per family, while 2-person families (862 | 58.2%) have the highest median income of $38,889 per family member.
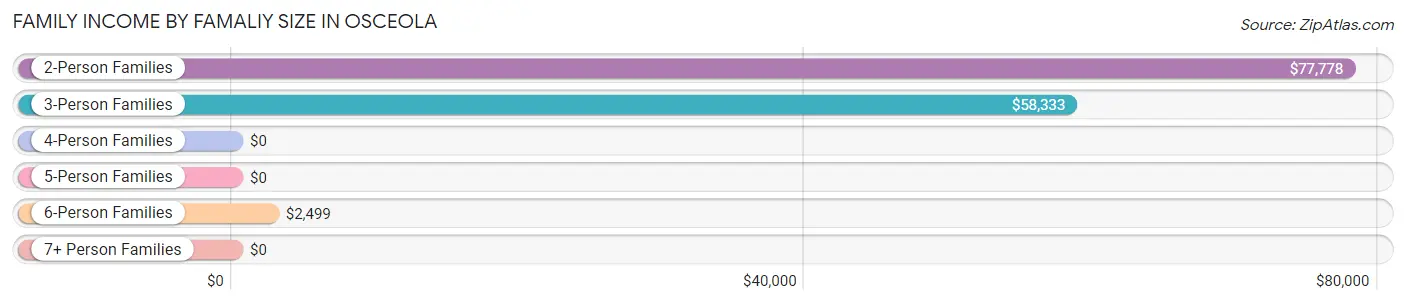
| Income Bracket | # Families | Median Income |
| 2-Person Families | 862 (58.2%) | $77,778 |
| 3-Person Families | 272 (18.3%) | $58,333 |
| 4-Person Families | 230 (15.5%) | $0 |
| 5-Person Families | 25 (1.7%) | $0 |
| 6-Person Families | 45 (3.0%) | $2,499 |
| 7+ Person Families | 48 (3.2%) | $0 |
| Total | 1,482 (100.0%) | $66,594 |
Family Income by Number of Earners in Osceola
The median family income in Osceola is $66,594, with families comprising 3+ earners (125) having the highest median family income of $131,023, while families with no earners (107) have the lowest median family income of $38,343, accounting for 8.4% and 7.2% of families, respectively.
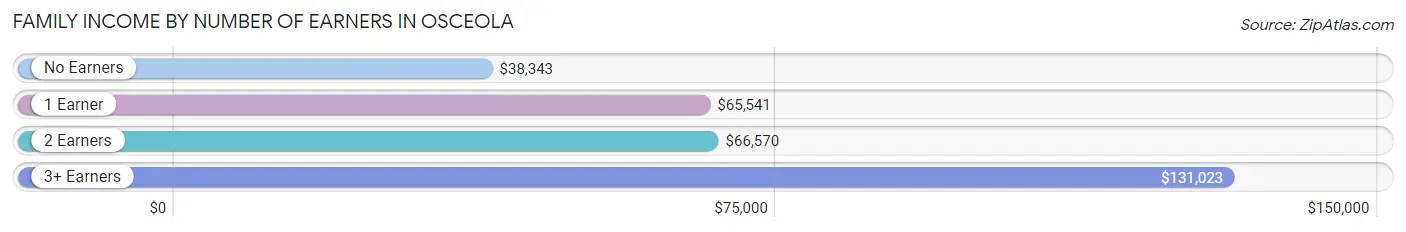
| Number of Earners | # Families | Median Income |
| No Earners | 107 (7.2%) | $38,343 |
| 1 Earner | 662 (44.7%) | $65,541 |
| 2 Earners | 588 (39.7%) | $66,570 |
| 3+ Earners | 125 (8.4%) | $131,023 |
| Total | 1,482 (100.0%) | $66,594 |
Household Income in Osceola
Household Income Brackets in Osceola
With 444 households falling in the category, the $50,000 to $74,999 income range is the most frequent in Osceola, accounting for 19.3% of all households. In contrast, only 55 households (2.4%) fall into the $150,000 to $199,999 income bracket, making it the least populous group.
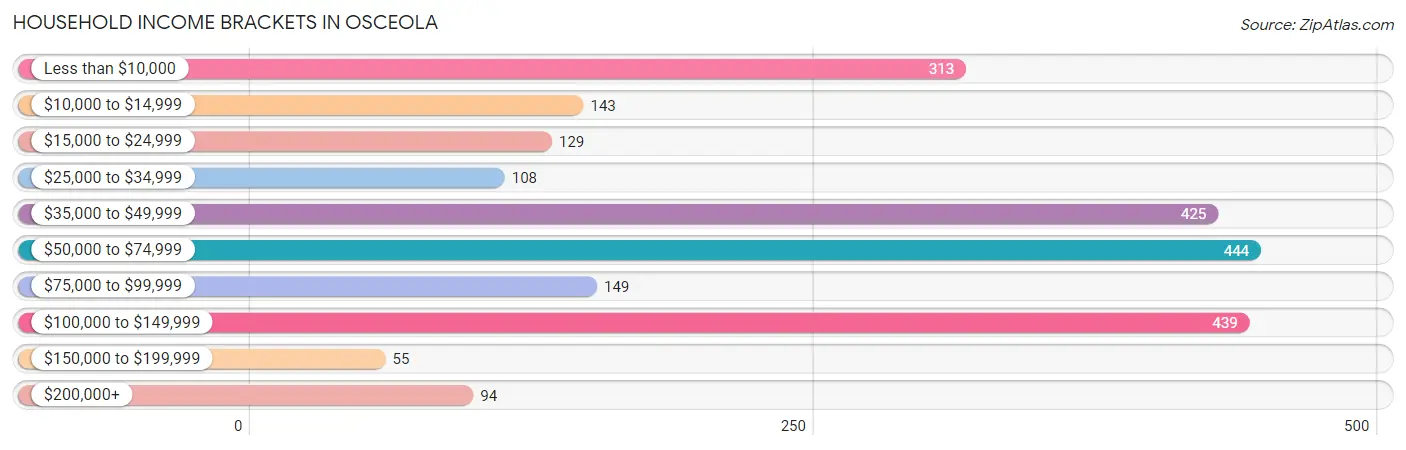
| Income Bracket | # Households | % Households |
| Less than $10,000 | 313 | 13.6% |
| $10,000 to $14,999 | 143 | 6.2% |
| $15,000 to $24,999 | 129 | 5.6% |
| $25,000 to $34,999 | 108 | 4.7% |
| $35,000 to $49,999 | 425 | 18.5% |
| $50,000 to $74,999 | 444 | 19.3% |
| $75,000 to $99,999 | 149 | 6.5% |
| $100,000 to $149,999 | 439 | 19.1% |
| $150,000 to $199,999 | 55 | 2.4% |
| $200,000+ | 94 | 4.1% |
Household Income by Householder Age in Osceola
The median household income in Osceola is $55,208, with the highest median household income of $63,698 found in the 25 to 44 years age bracket for the primary householder. A total of 616 households (26.8%) fall into this category. Meanwhile, the 65+ years age bracket for the primary householder has the lowest median household income of $38,155, with 601 households (26.1%) in this group.
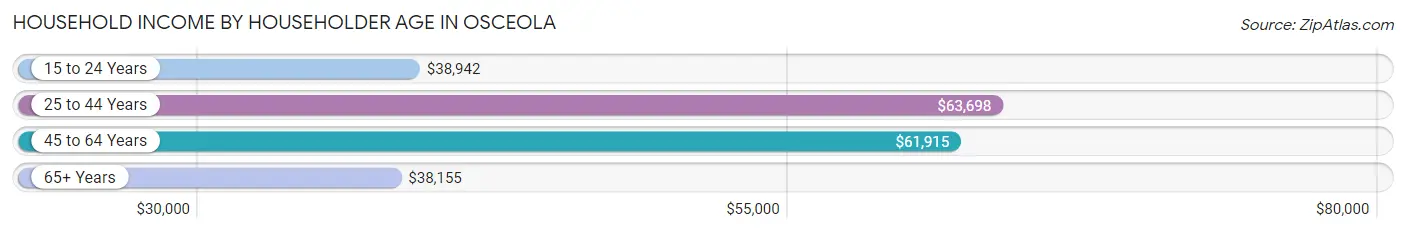
| Income Bracket | # Households | Median Income |
| 15 to 24 Years | 239 (10.4%) | $38,942 |
| 25 to 44 Years | 616 (26.8%) | $63,698 |
| 45 to 64 Years | 843 (36.7%) | $61,915 |
| 65+ Years | 601 (26.1%) | $38,155 |
| Total | 2,299 (100.0%) | $55,208 |
Poverty in Osceola
Income Below Poverty by Sex and Age in Osceola
With 17.3% poverty level for males and 22.6% for females among the residents of Osceola, 5 year old males and under 5 year old females are the most vulnerable to poverty, with 98 males (100.0%) and 110 females (63.6%) in their respective age groups living below the poverty level.
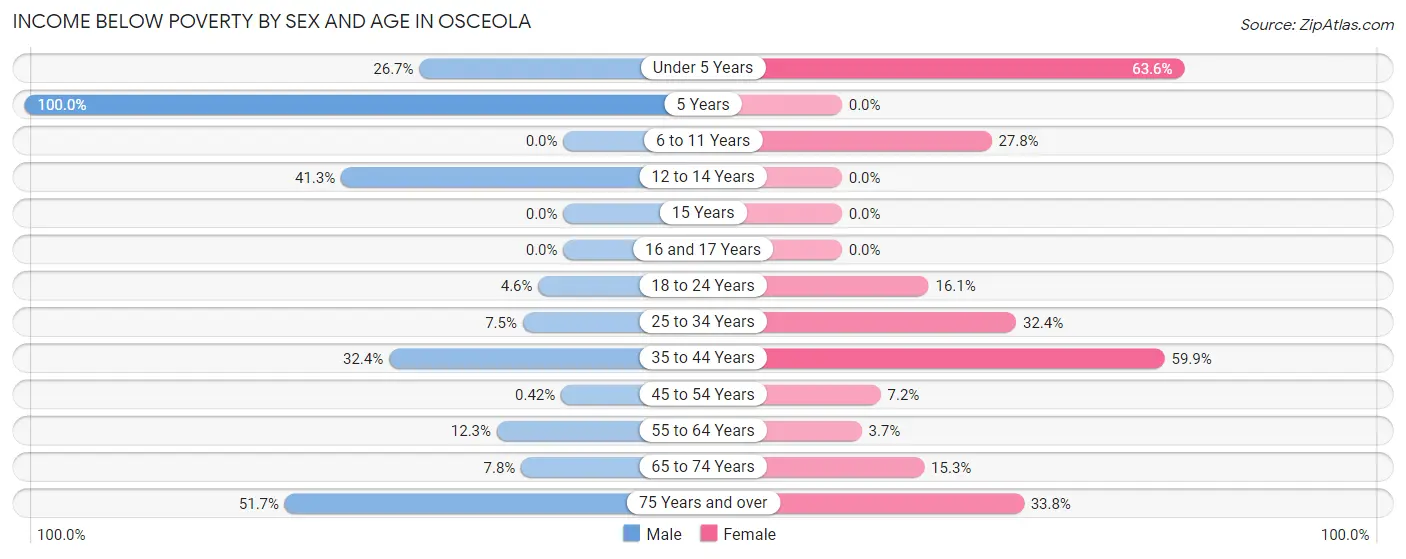
| Age Bracket | Male | Female |
| Under 5 Years | 85 (26.7%) | 110 (63.6%) |
| 5 Years | 98 (100.0%) | 0 (0.0%) |
| 6 to 11 Years | 0 (0.0%) | 25 (27.8%) |
| 12 to 14 Years | 26 (41.3%) | 0 (0.0%) |
| 15 Years | 0 (0.0%) | 0 (0.0%) |
| 16 and 17 Years | 0 (0.0%) | 0 (0.0%) |
| 18 to 24 Years | 15 (4.6%) | 52 (16.1%) |
| 25 to 34 Years | 25 (7.5%) | 99 (32.4%) |
| 35 to 44 Years | 110 (32.4%) | 133 (59.9%) |
| 45 to 54 Years | 1 (0.4%) | 26 (7.2%) |
| 55 to 64 Years | 48 (12.3%) | 14 (3.7%) |
| 65 to 74 Years | 18 (7.8%) | 39 (15.3%) |
| 75 Years and over | 46 (51.7%) | 79 (33.8%) |
| Total | 472 (17.3%) | 577 (22.6%) |
Income Above Poverty by Sex and Age in Osceola
According to the poverty statistics in Osceola, males aged 6 to 11 years and females aged 12 to 14 years are the age groups that are most secure financially, with 100.0% of males and 100.0% of females in these age groups living above the poverty line.
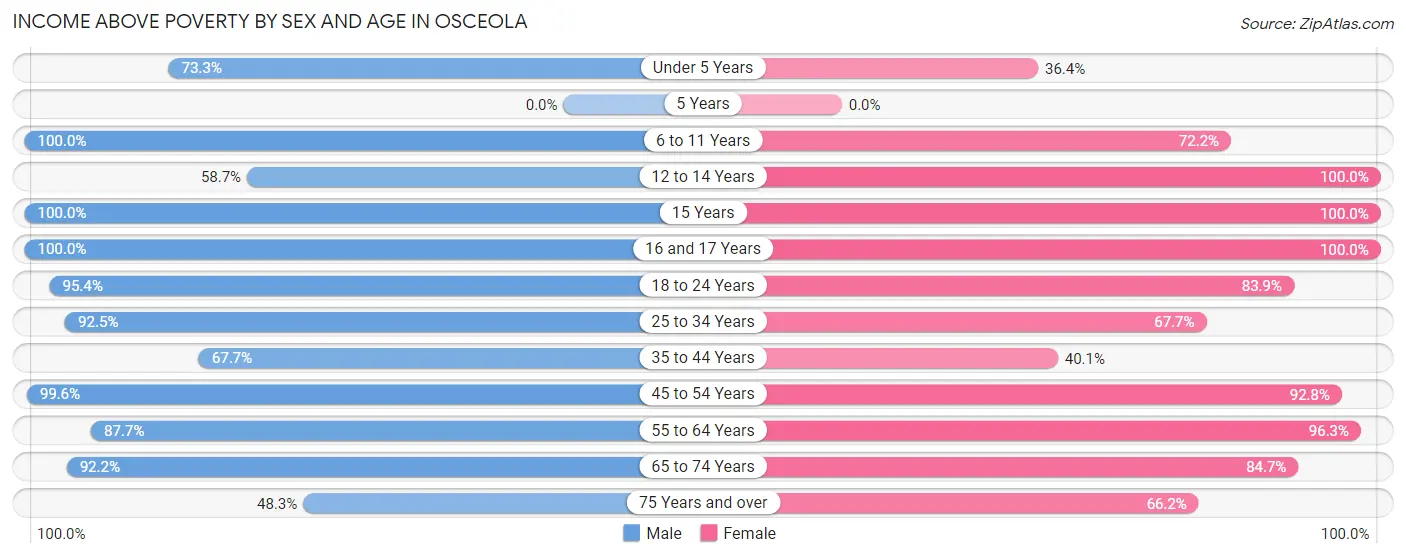
| Age Bracket | Male | Female |
| Under 5 Years | 233 (73.3%) | 63 (36.4%) |
| 5 Years | 0 (0.0%) | 0 (0.0%) |
| 6 to 11 Years | 156 (100.0%) | 65 (72.2%) |
| 12 to 14 Years | 37 (58.7%) | 137 (100.0%) |
| 15 Years | 49 (100.0%) | 8 (100.0%) |
| 16 and 17 Years | 104 (100.0%) | 67 (100.0%) |
| 18 to 24 Years | 308 (95.4%) | 271 (83.9%) |
| 25 to 34 Years | 307 (92.5%) | 207 (67.6%) |
| 35 to 44 Years | 230 (67.6%) | 89 (40.1%) |
| 45 to 54 Years | 239 (99.6%) | 335 (92.8%) |
| 55 to 64 Years | 341 (87.7%) | 369 (96.3%) |
| 65 to 74 Years | 212 (92.2%) | 216 (84.7%) |
| 75 Years and over | 43 (48.3%) | 155 (66.2%) |
| Total | 2,259 (82.7%) | 1,982 (77.4%) |
Income Below Poverty Among Married-Couple Families in Osceola
The poverty statistics for married-couple families in Osceola show that 1.7% or 18 of the total 1,042 families live below the poverty line. Families with no children have the highest poverty rate of 2.6%, comprising of 18 families. On the other hand, families with 1 or 2 children have the lowest poverty rate of 0.0%, which includes 0 families.
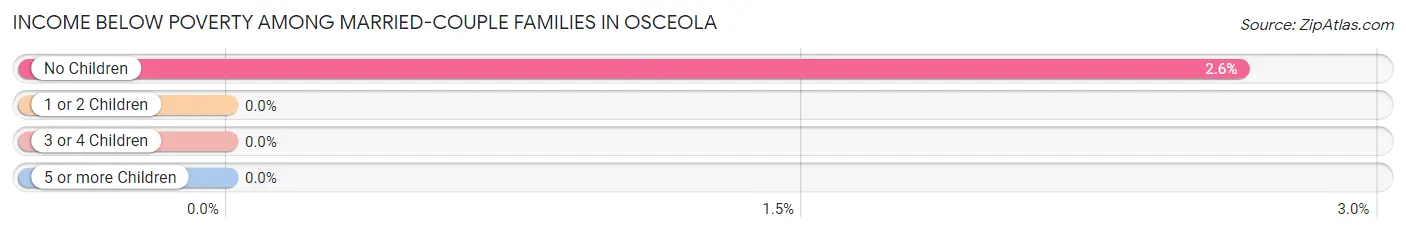
| Children | Above Poverty | Below Poverty |
| No Children | 665 (97.4%) | 18 (2.6%) |
| 1 or 2 Children | 334 (100.0%) | 0 (0.0%) |
| 3 or 4 Children | 25 (100.0%) | 0 (0.0%) |
| 5 or more Children | 0 (0.0%) | 0 (0.0%) |
| Total | 1,024 (98.3%) | 18 (1.7%) |
Income Below Poverty Among Single-Parent Households in Osceola
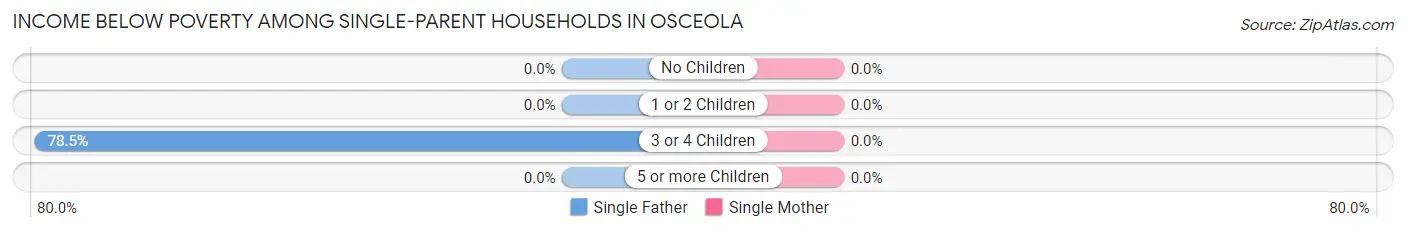
| Children | Single Father | Single Mother |
| No Children | 0 (0.0%) | 0 (0.0%) |
| 1 or 2 Children | 0 (0.0%) | 0 (0.0%) |
| 3 or 4 Children | 135 (78.5%) | 0 (0.0%) |
| 5 or more Children | 0 (0.0%) | 0 (0.0%) |
| Total | 135 (60.8%) | 0 (0.0%) |
Income Below Poverty Among Married-Couple vs Single-Parent Households in Osceola
The poverty data for Osceola shows that 18 of the married-couple family households (1.7%) and 135 of the single-parent households (30.7%) are living below the poverty level. Within the married-couple family households, those with no children have the highest poverty rate, with 18 households (2.6%) falling below the poverty line. Among the single-parent households, those with 3 or 4 children have the highest poverty rate, with 135 household (78.5%) living below poverty.
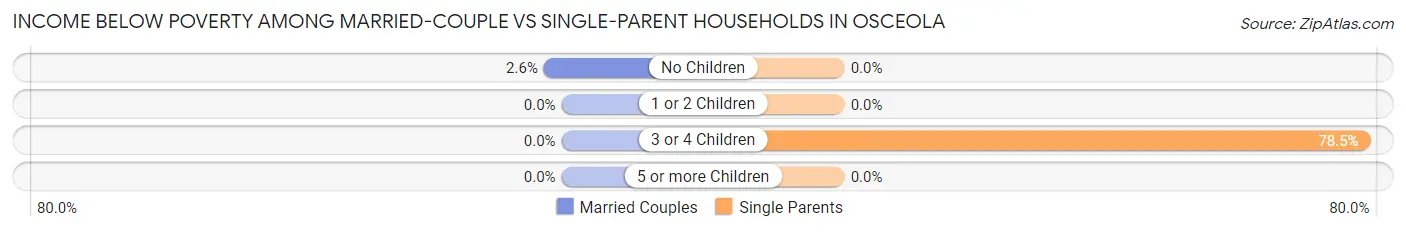
| Children | Married-Couple Families | Single-Parent Households |
| No Children | 18 (2.6%) | 0 (0.0%) |
| 1 or 2 Children | 0 (0.0%) | 0 (0.0%) |
| 3 or 4 Children | 0 (0.0%) | 135 (78.5%) |
| 5 or more Children | 0 (0.0%) | 0 (0.0%) |
| Total | 18 (1.7%) | 135 (30.7%) |
Race in Osceola
The most populous races in Osceola are White / Caucasian (4,257 | 78.0%), Hispanic or Latino (1,443 | 26.5%), and Some other Race (597 | 10.9%).
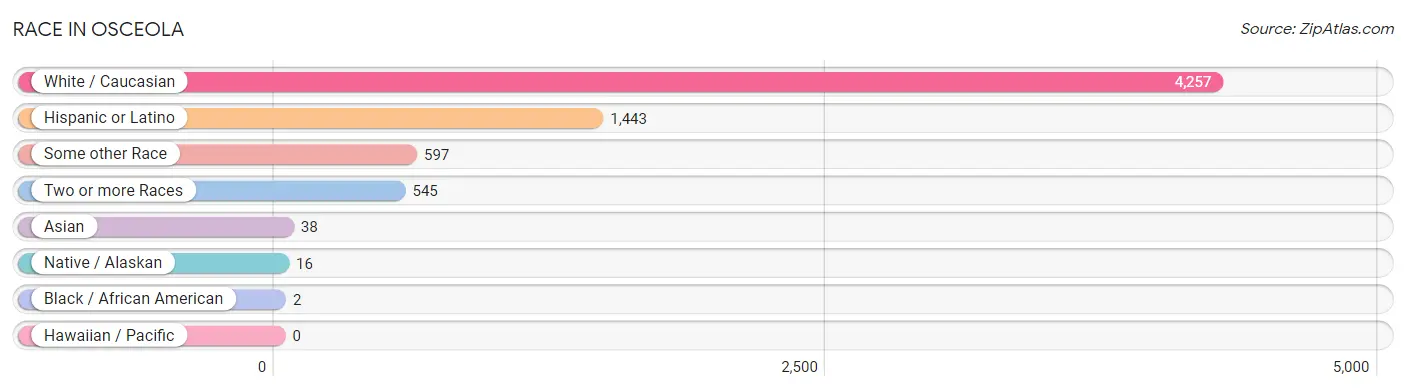
| Race | # Population | % Population |
| Asian | 38 | 0.7% |
| Black / African American | 2 | 0.0% |
| Hawaiian / Pacific | 0 | 0.0% |
| Hispanic or Latino | 1,443 | 26.5% |
| Native / Alaskan | 16 | 0.3% |
| White / Caucasian | 4,257 | 78.0% |
| Two or more Races | 545 | 10.0% |
| Some other Race | 597 | 10.9% |
| Total | 5,455 | 100.0% |
Ancestry in Osceola
The most populous ancestries reported in Osceola are Mexican (1,427 | 26.2%), German (914 | 16.8%), English (746 | 13.7%), Irish (372 | 6.8%), and Dutch (139 | 2.5%), together accounting for 66.0% of all Osceola residents.
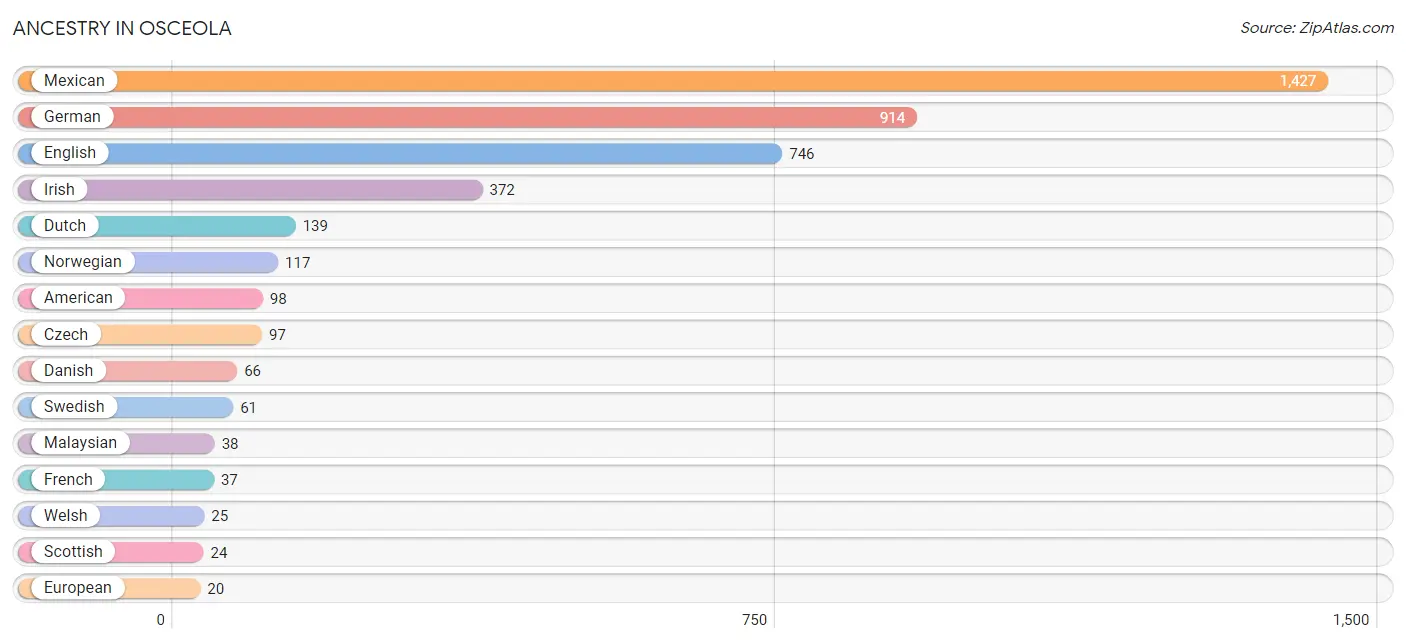
| Ancestry | # Population | % Population |
| American | 98 | 1.8% |
| Czech | 97 | 1.8% |
| Danish | 66 | 1.2% |
| Dutch | 139 | 2.5% |
| English | 746 | 13.7% |
| European | 20 | 0.4% |
| French | 37 | 0.7% |
| German | 914 | 16.8% |
| Irish | 372 | 6.8% |
| Malaysian | 38 | 0.7% |
| Mexican | 1,427 | 26.2% |
| Norwegian | 117 | 2.1% |
| Polish | 14 | 0.3% |
| Scandinavian | 9 | 0.2% |
| Scotch-Irish | 2 | 0.0% |
| Scottish | 24 | 0.4% |
| Swedish | 61 | 1.1% |
| Welsh | 25 | 0.5% | View All 18 Rows |
Immigrants in Osceola
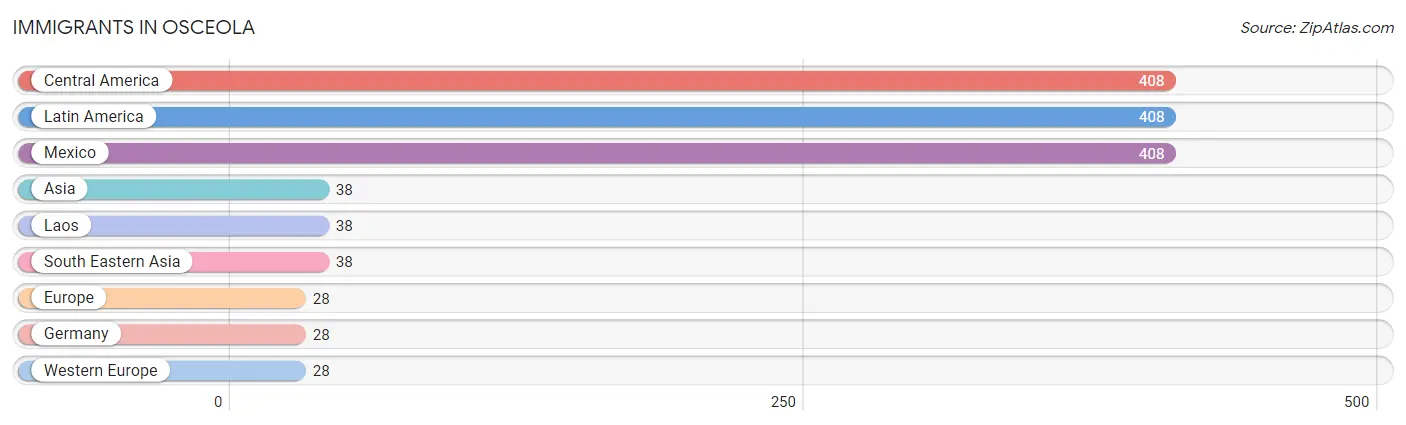
The most numerous immigrant groups reported in Osceola came from Central America (408 | 7.5%), Latin America (408 | 7.5%), Mexico (408 | 7.5%), Asia (38 | 0.7%), and Laos (38 | 0.7%), together accounting for 23.8% of all Osceola residents.
| Immigration Origin | # Population | % Population |
| Asia | 38 | 0.7% |
| Central America | 408 | 7.5% |
| Europe | 28 | 0.5% |
| Germany | 28 | 0.5% |
| Laos | 38 | 0.7% |
| Latin America | 408 | 7.5% |
| Mexico | 408 | 7.5% |
| South Eastern Asia | 38 | 0.7% |
| Western Europe | 28 | 0.5% | View All 9 Rows |
Sex and Age in Osceola
Sex and Age in Osceola
The most populous age groups in Osceola are Under 5 Years (356 | 12.7%) for men and 55 to 59 Years (355 | 13.4%) for women.
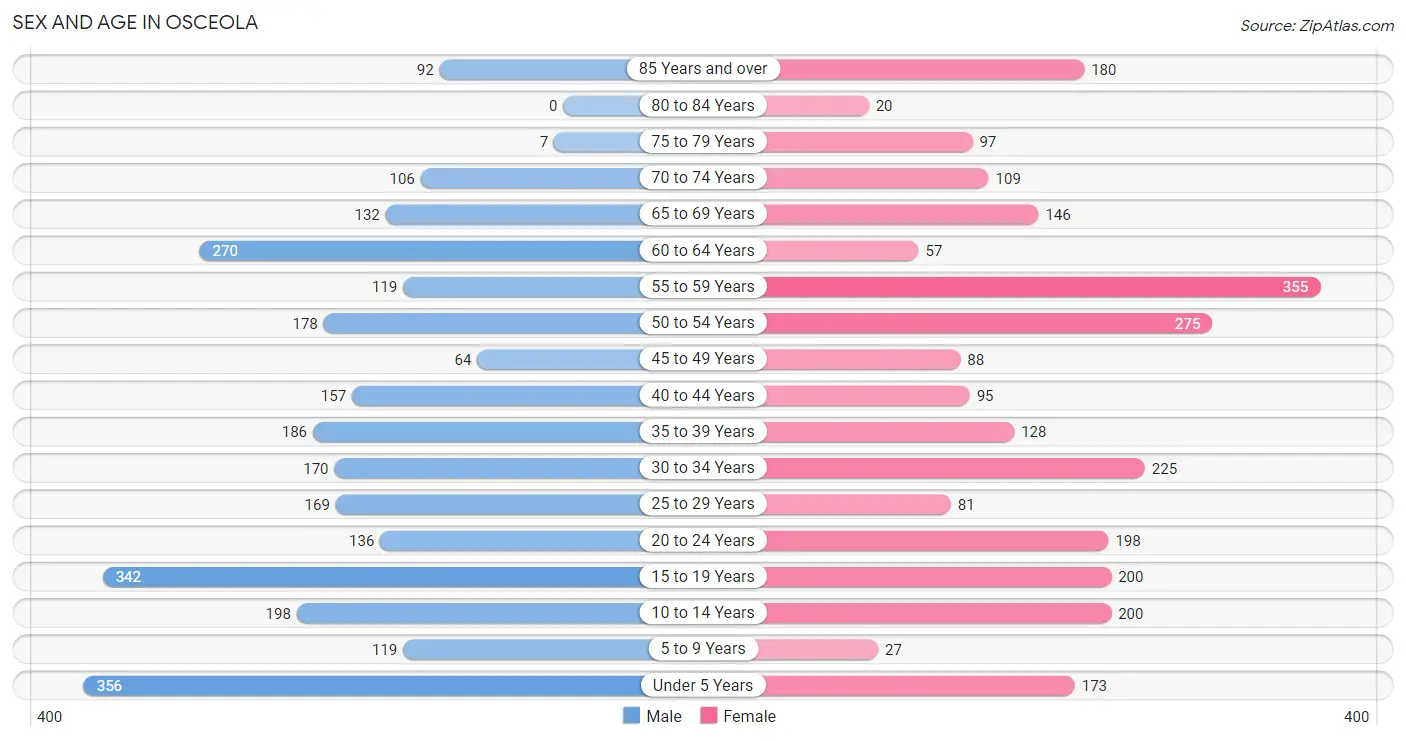
| Age Bracket | Male | Female |
| Under 5 Years | 356 (12.7%) | 173 (6.5%) |
| 5 to 9 Years | 119 (4.3%) | 27 (1.0%) |
| 10 to 14 Years | 198 (7.1%) | 200 (7.5%) |
| 15 to 19 Years | 342 (12.2%) | 200 (7.5%) |
| 20 to 24 Years | 136 (4.9%) | 198 (7.5%) |
| 25 to 29 Years | 169 (6.0%) | 81 (3.0%) |
| 30 to 34 Years | 170 (6.1%) | 225 (8.5%) |
| 35 to 39 Years | 186 (6.6%) | 128 (4.8%) |
| 40 to 44 Years | 157 (5.6%) | 95 (3.6%) |
| 45 to 49 Years | 64 (2.3%) | 88 (3.3%) |
| 50 to 54 Years | 178 (6.4%) | 275 (10.4%) |
| 55 to 59 Years | 119 (4.3%) | 355 (13.4%) |
| 60 to 64 Years | 270 (9.6%) | 57 (2.1%) |
| 65 to 69 Years | 132 (4.7%) | 146 (5.5%) |
| 70 to 74 Years | 106 (3.8%) | 109 (4.1%) |
| 75 to 79 Years | 7 (0.3%) | 97 (3.6%) |
| 80 to 84 Years | 0 (0.0%) | 20 (0.7%) |
| 85 Years and over | 92 (3.3%) | 180 (6.8%) |
| Total | 2,801 (100.0%) | 2,654 (100.0%) |
Families and Households in Osceola
Median Family Size in Osceola
The median family size in Osceola is 2.82 persons per family, with single male/father families (222 | 15.0%) accounting for the largest median family size of 3.32 persons per family. On the other hand, single female/mother families (218 | 14.7%) represent the smallest median family size with 2.24 persons per family.
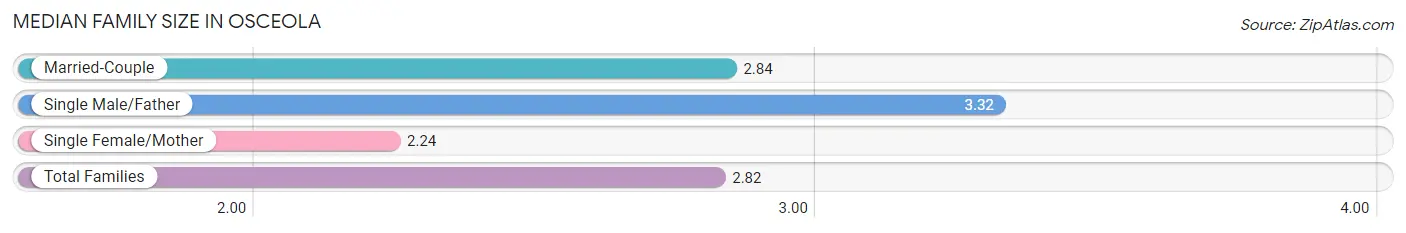
| Family Type | # Families | Family Size |
| Married-Couple | 1,042 (70.3%) | 2.84 |
| Single Male/Father | 222 (15.0%) | 3.32 |
| Single Female/Mother | 218 (14.7%) | 2.24 |
| Total Families | 1,482 (100.0%) | 2.82 |
Median Household Size in Osceola
The median household size in Osceola is 2.31 persons per household, with single male/father households (222 | 9.7%) accounting for the largest median household size of 4.27 persons per household. non-family households (817 | 35.5%) represent the smallest median household size with 1.09 persons per household.
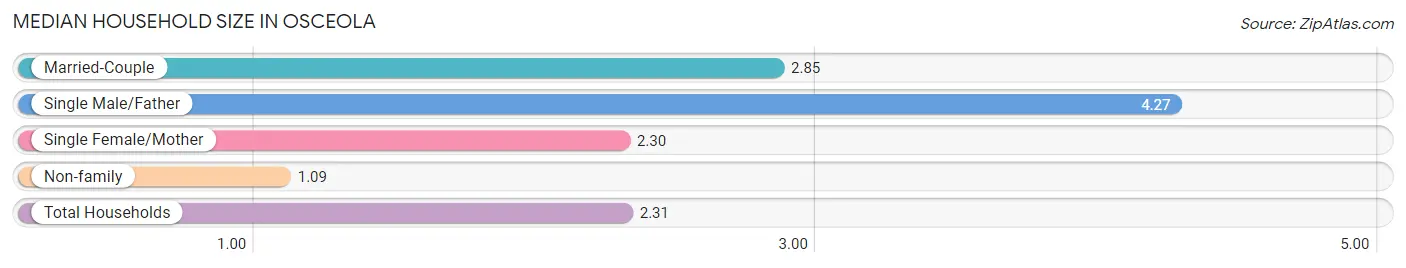
| Household Type | # Households | Household Size |
| Married-Couple | 1,042 (45.3%) | 2.85 |
| Single Male/Father | 222 (9.7%) | 4.27 |
| Single Female/Mother | 218 (9.5%) | 2.30 |
| Non-family | 817 (35.5%) | 1.09 |
| Total Households | 2,299 (100.0%) | 2.31 |
Household Size by Marriage Status in Osceola
Out of a total of 2,299 households in Osceola, 1,482 (64.5%) are family households, while 817 (35.5%) are nonfamily households. The most numerous type of family households are 2-person households, comprising 817, and the most common type of nonfamily households are 1-person households, comprising 704.
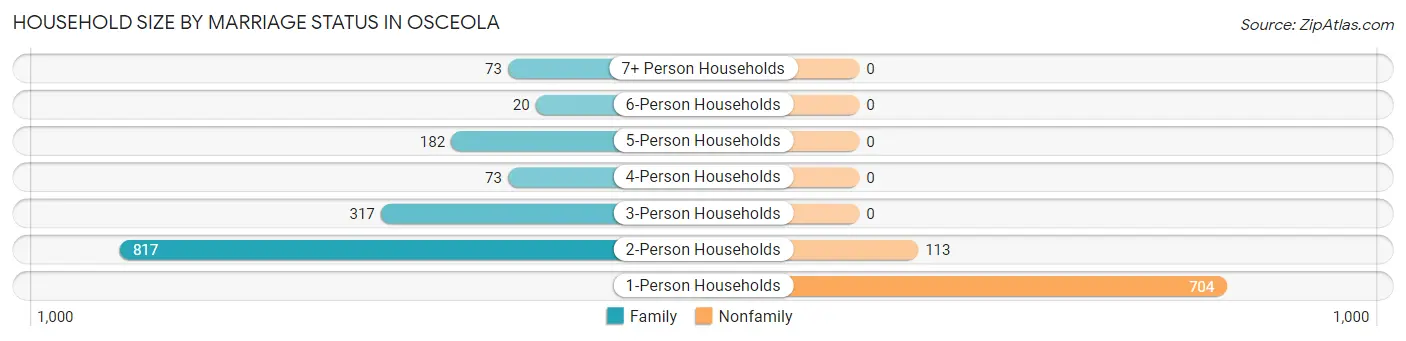
| Household Size | Family Households | Nonfamily Households |
| 1-Person Households | - | 704 (30.6%) |
| 2-Person Households | 817 (35.5%) | 113 (4.9%) |
| 3-Person Households | 317 (13.8%) | 0 (0.0%) |
| 4-Person Households | 73 (3.2%) | 0 (0.0%) |
| 5-Person Households | 182 (7.9%) | 0 (0.0%) |
| 6-Person Households | 20 (0.9%) | 0 (0.0%) |
| 7+ Person Households | 73 (3.2%) | 0 (0.0%) |
| Total | 1,482 (64.5%) | 817 (35.5%) |
Female Fertility in Osceola
Fertility by Age in Osceola
Average fertility rate in Osceola is 299.0 births per 1,000 women. Women in the age bracket of 20 to 34 years have the highest fertility rate with 631.0 births per 1,000 women. Women in the age bracket of 20 to 34 years acount for 100.0% of all women with births.
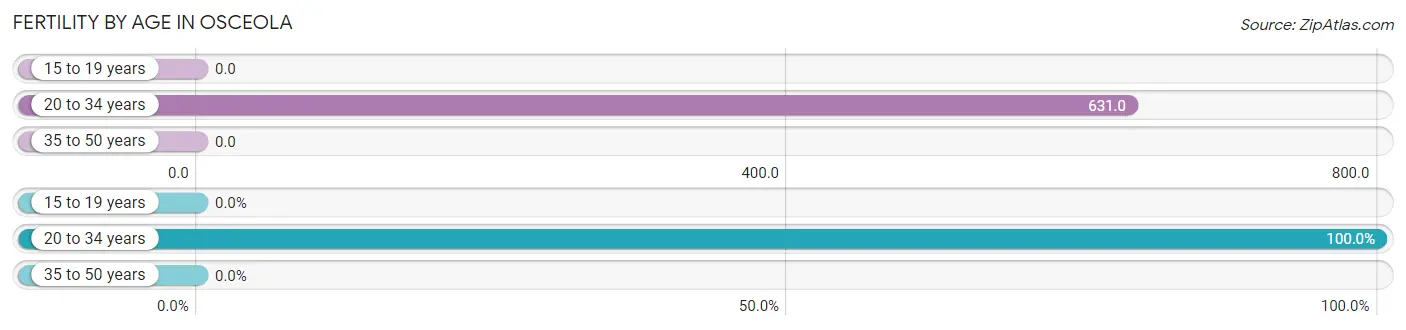
| Age Bracket | Women with Births | Births / 1,000 Women |
| 15 to 19 years | 0 (0.0%) | 0.0 |
| 20 to 34 years | 318 (100.0%) | 631.0 |
| 35 to 50 years | 0 (0.0%) | 0.0 |
| Total | 318 (100.0%) | 299.0 |
Fertility by Age by Marriage Status in Osceola
58.8% of women with births (318) in Osceola are married. The highest percentage of unmarried women with births falls into 20 to 34 years age bracket with 41.2% of them unmarried at the time of birth, while the lowest percentage of unmarried women with births belong to 20 to 34 years age bracket with 41.2% of them unmarried.
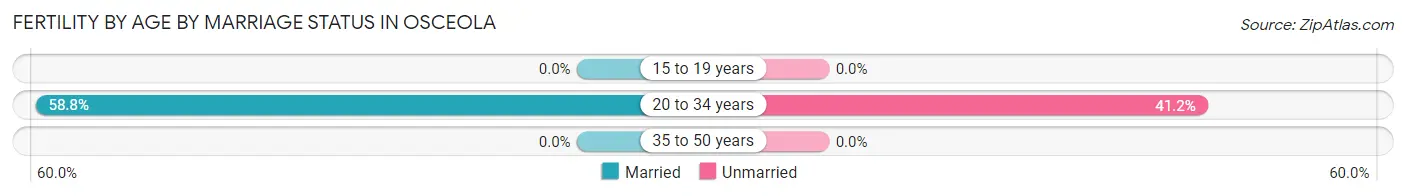
| Age Bracket | Married | Unmarried |
| 15 to 19 years | 0 (0.0%) | 0 (0.0%) |
| 20 to 34 years | 187 (58.8%) | 131 (41.2%) |
| 35 to 50 years | 0 (0.0%) | 0 (0.0%) |
| Total | 187 (58.8%) | 131 (41.2%) |
Fertility by Education in Osceola
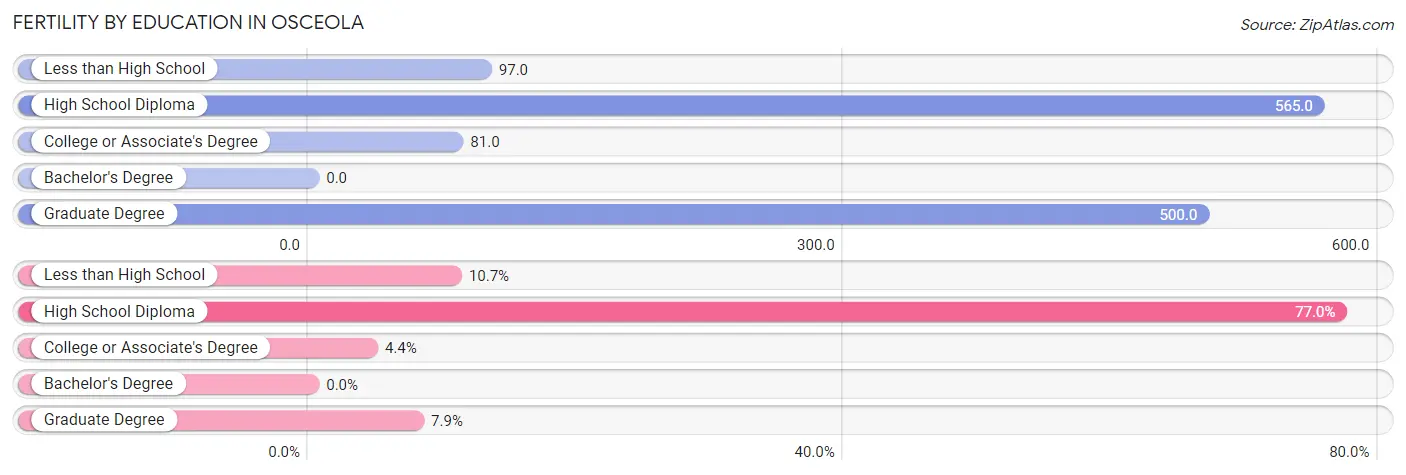
| Educational Attainment | Women with Births | Births / 1,000 Women |
| Less than High School | 34 (10.7%) | 97.0 |
| High School Diploma | 245 (77.0%) | 565.0 |
| College or Associate's Degree | 14 (4.4%) | 81.0 |
| Bachelor's Degree | 0 (0.0%) | 0.0 |
| Graduate Degree | 25 (7.9%) | 500.0 |
| Total | 318 (100.0%) | 299.0 |
Fertility by Education by Marriage Status in Osceola
41.2% of women with births in Osceola are unmarried. Women with the educational attainment of less than high school are most likely to be married with 100.0% of them married at childbirth, while women with the educational attainment of high school diploma are least likely to be married with 53.5% of them unmarried at childbirth.
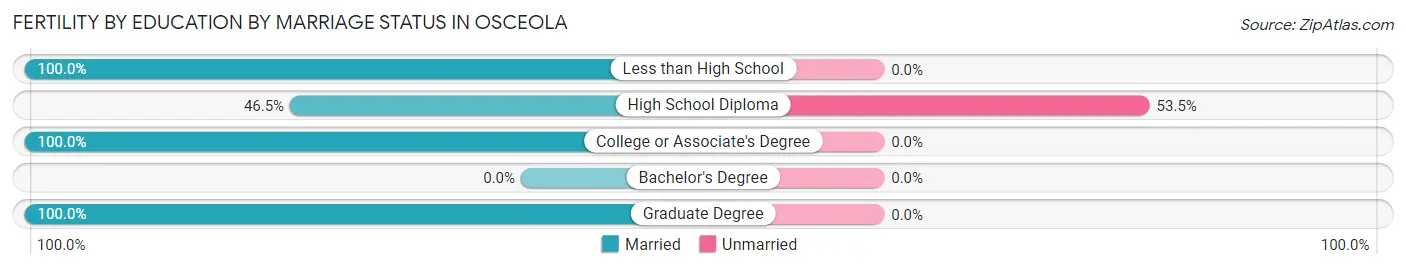
| Educational Attainment | Married | Unmarried |
| Less than High School | 34 (100.0%) | 0 (0.0%) |
| High School Diploma | 114 (46.5%) | 131 (53.5%) |
| College or Associate's Degree | 14 (100.0%) | 0 (0.0%) |
| Bachelor's Degree | 0 (0.0%) | 0 (0.0%) |
| Graduate Degree | 25 (100.0%) | 0 (0.0%) |
| Total | 187 (58.8%) | 131 (41.2%) |
Employment Characteristics in Osceola
Employment by Class of Employer in Osceola
Among the 2,531 employed individuals in Osceola, private company employees (1,857 | 73.4%), local government employees (336 | 13.3%), and not-for-profit organizations (121 | 4.8%) make up the most common classes of employment.
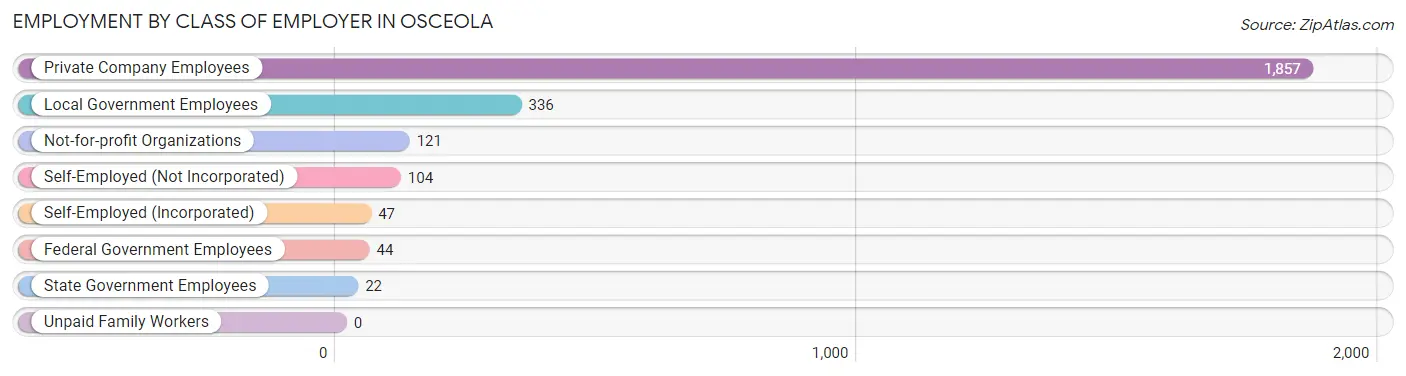
| Employer Class | # Employees | % Employees |
| Private Company Employees | 1,857 | 73.4% |
| Self-Employed (Incorporated) | 47 | 1.9% |
| Self-Employed (Not Incorporated) | 104 | 4.1% |
| Not-for-profit Organizations | 121 | 4.8% |
| Local Government Employees | 336 | 13.3% |
| State Government Employees | 22 | 0.9% |
| Federal Government Employees | 44 | 1.7% |
| Unpaid Family Workers | 0 | 0.0% |
| Total | 2,531 | 100.0% |
Employment Status by Age in Osceola
According to the labor force statistics for Osceola, out of the total population over 16 years of age (4,325), 66.0% or 2,854 individuals are in the labor force, with 5.8% or 166 of them unemployed. The age group with the highest labor force participation rate is 20 to 24 years, with 99.1% or 331 individuals in the labor force. Within the labor force, the 16 to 19 years age range has the highest percentage of unemployed individuals, with 44.6% or 162 of them being unemployed.
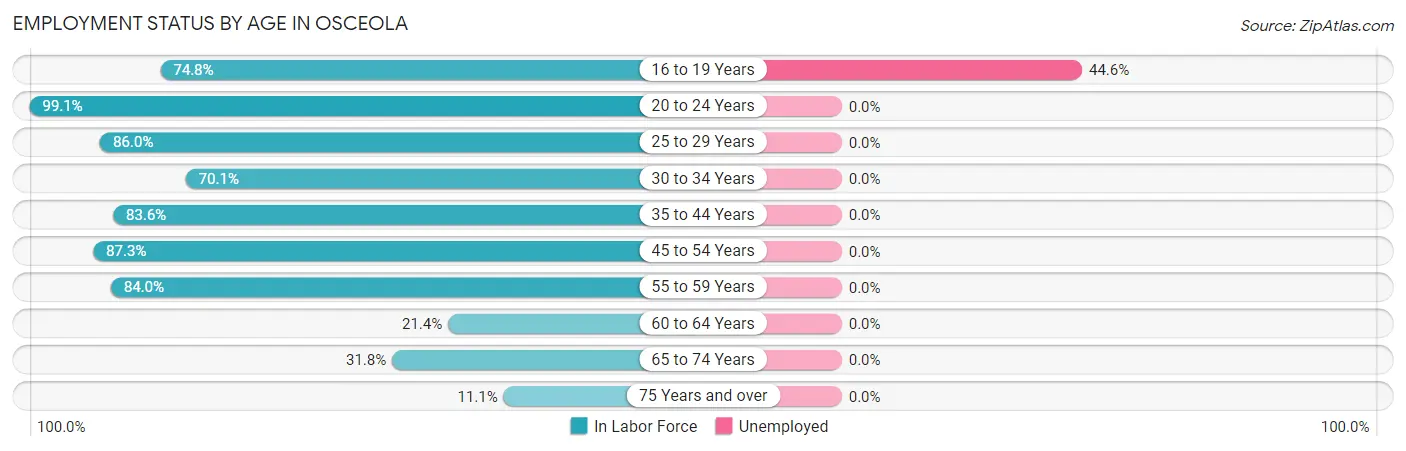
| Age Bracket | In Labor Force | Unemployed |
| 16 to 19 Years | 363 (74.8%) | 162 (44.6%) |
| 20 to 24 Years | 331 (99.1%) | 0 (0.0%) |
| 25 to 29 Years | 215 (86.0%) | 0 (0.0%) |
| 30 to 34 Years | 277 (70.1%) | 0 (0.0%) |
| 35 to 44 Years | 473 (83.6%) | 0 (0.0%) |
| 45 to 54 Years | 528 (87.3%) | 0 (0.0%) |
| 55 to 59 Years | 398 (84.0%) | 0 (0.0%) |
| 60 to 64 Years | 70 (21.4%) | 0 (0.0%) |
| 65 to 74 Years | 157 (31.8%) | 0 (0.0%) |
| 75 Years and over | 44 (11.1%) | 0 (0.0%) |
| Total | 2,854 (66.0%) | 166 (5.8%) |
Employment Status by Educational Attainment in Osceola
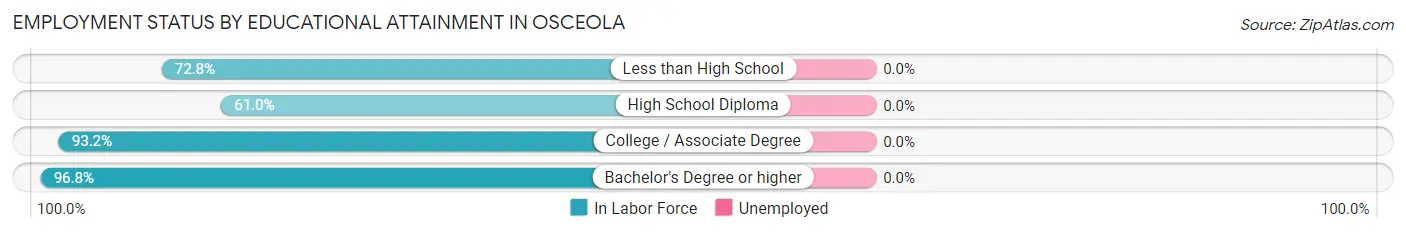
| Educational Attainment | In Labor Force | Unemployed |
| Less than High School | 374 (72.8%) | 0 (0.0%) |
| High School Diploma | 730 (61.0%) | 0 (0.0%) |
| College / Associate Degree | 551 (93.2%) | 0 (0.0%) |
| Bachelor's Degree or higher | 306 (96.8%) | 0 (0.0%) |
| Total | 1,960 (74.9%) | 0 (0.0%) |
Employment Occupations by Sex in Osceola
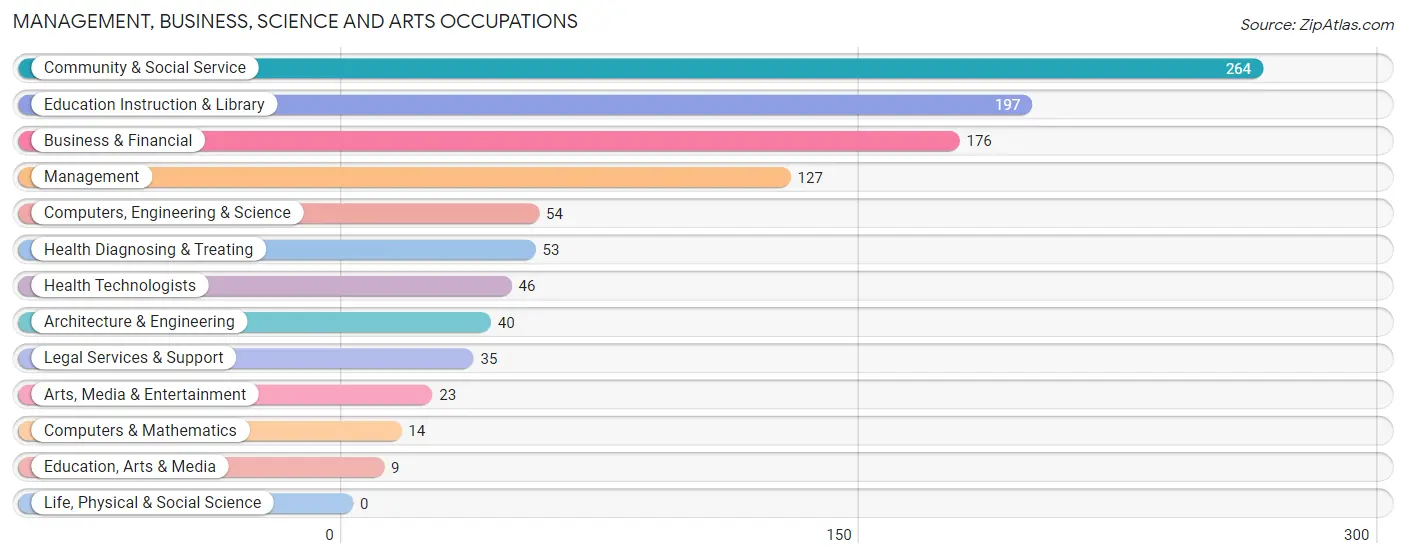
Management, Business, Science and Arts Occupations
The most common Management, Business, Science and Arts occupations in Osceola are Community & Social Service (264 | 10.0%), Education Instruction & Library (197 | 7.4%), Business & Financial (176 | 6.6%), Management (127 | 4.8%), and Computers, Engineering & Science (54 | 2.0%).
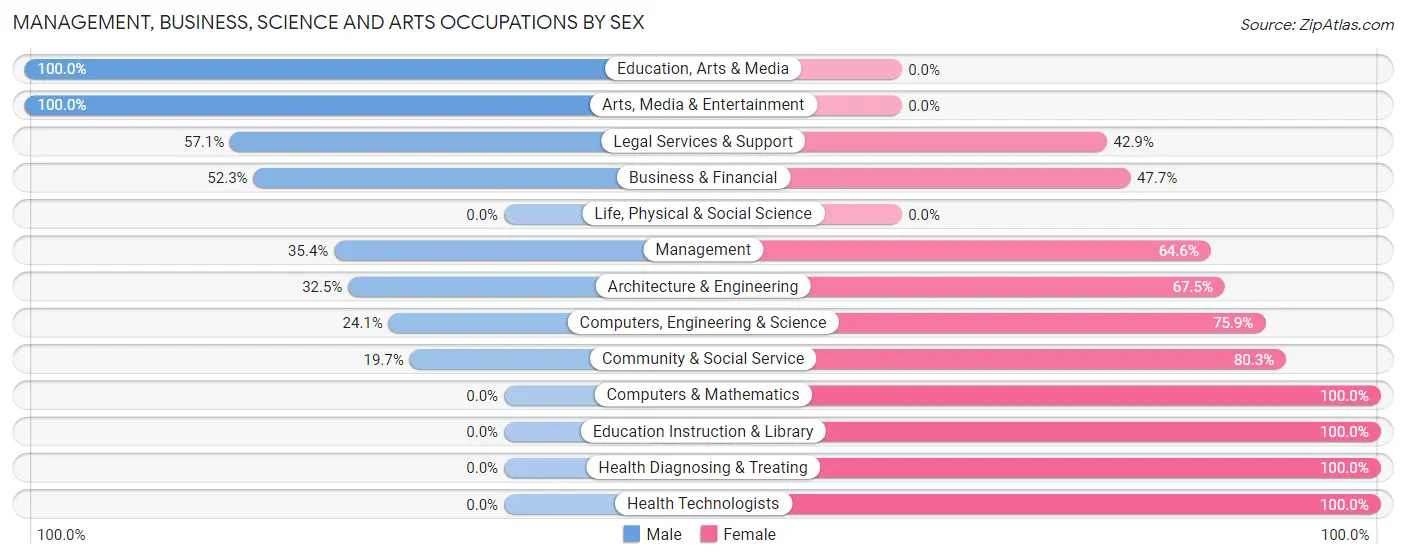
Management, Business, Science and Arts Occupations by Sex
Within the Management, Business, Science and Arts occupations in Osceola, the most male-oriented occupations are Education, Arts & Media (100.0%), Arts, Media & Entertainment (100.0%), and Legal Services & Support (57.1%), while the most female-oriented occupations are Computers & Mathematics (100.0%), Education Instruction & Library (100.0%), and Health Diagnosing & Treating (100.0%).
| Occupation | Male | Female |
| Management | 45 (35.4%) | 82 (64.6%) |
| Business & Financial | 92 (52.3%) | 84 (47.7%) |
| Computers, Engineering & Science | 13 (24.1%) | 41 (75.9%) |
| Computers & Mathematics | 0 (0.0%) | 14 (100.0%) |
| Architecture & Engineering | 13 (32.5%) | 27 (67.5%) |
| Life, Physical & Social Science | 0 (0.0%) | 0 (0.0%) |
| Community & Social Service | 52 (19.7%) | 212 (80.3%) |
| Education, Arts & Media | 9 (100.0%) | 0 (0.0%) |
| Legal Services & Support | 20 (57.1%) | 15 (42.9%) |
| Education Instruction & Library | 0 (0.0%) | 197 (100.0%) |
| Arts, Media & Entertainment | 23 (100.0%) | 0 (0.0%) |
| Health Diagnosing & Treating | 0 (0.0%) | 53 (100.0%) |
| Health Technologists | 0 (0.0%) | 46 (100.0%) |
| Total (Category) | 202 (30.0%) | 472 (70.0%) |
| Total (Overall) | 1,341 (50.6%) | 1,309 (49.4%) |
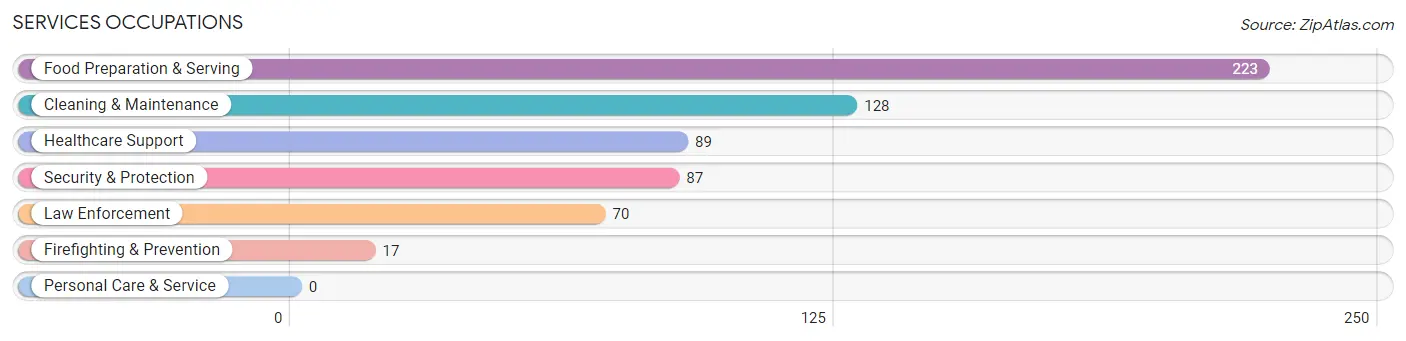
Services Occupations
The most common Services occupations in Osceola are Food Preparation & Serving (223 | 8.4%), Cleaning & Maintenance (128 | 4.8%), Healthcare Support (89 | 3.4%), Security & Protection (87 | 3.3%), and Law Enforcement (70 | 2.6%).
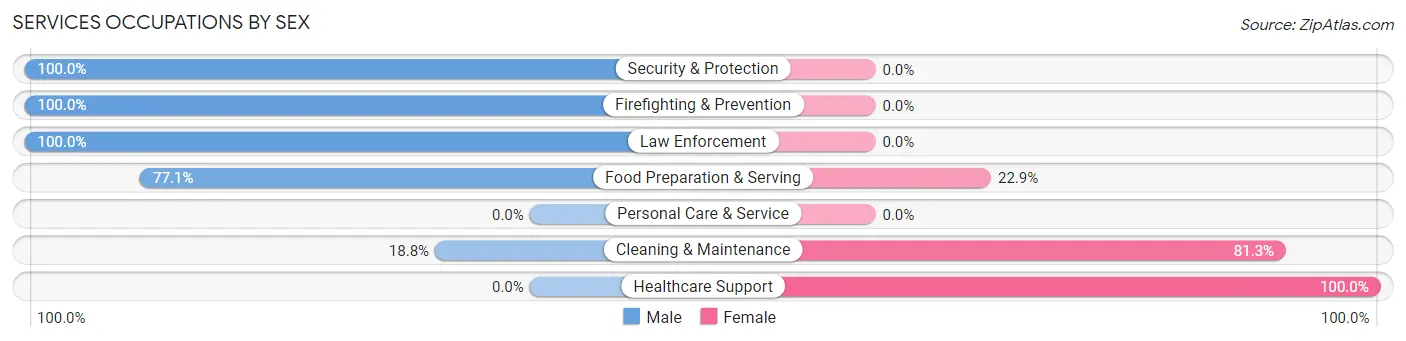
Services Occupations by Sex
Within the Services occupations in Osceola, the most male-oriented occupations are Security & Protection (100.0%), Firefighting & Prevention (100.0%), and Law Enforcement (100.0%), while the most female-oriented occupations are Healthcare Support (100.0%), Cleaning & Maintenance (81.2%), and Food Preparation & Serving (22.9%).
| Occupation | Male | Female |
| Healthcare Support | 0 (0.0%) | 89 (100.0%) |
| Security & Protection | 87 (100.0%) | 0 (0.0%) |
| Firefighting & Prevention | 17 (100.0%) | 0 (0.0%) |
| Law Enforcement | 70 (100.0%) | 0 (0.0%) |
| Food Preparation & Serving | 172 (77.1%) | 51 (22.9%) |
| Cleaning & Maintenance | 24 (18.8%) | 104 (81.2%) |
| Personal Care & Service | 0 (0.0%) | 0 (0.0%) |
| Total (Category) | 283 (53.7%) | 244 (46.3%) |
| Total (Overall) | 1,341 (50.6%) | 1,309 (49.4%) |
Sales and Office Occupations
The most common Sales and Office occupations in Osceola are Sales & Related (229 | 8.6%), and Office & Administration (154 | 5.8%).
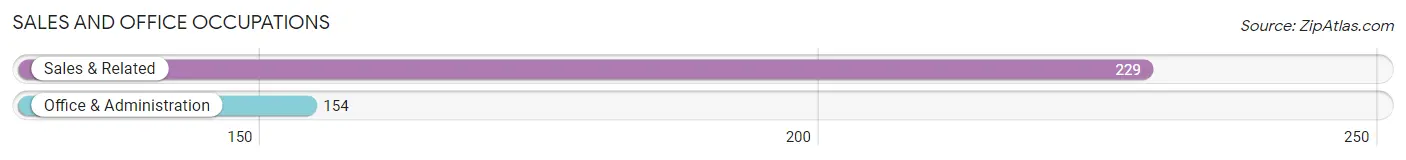
Sales and Office Occupations by Sex
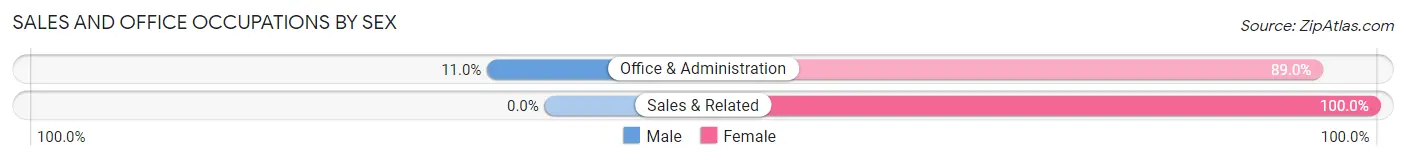
| Occupation | Male | Female |
| Sales & Related | 0 (0.0%) | 229 (100.0%) |
| Office & Administration | 17 (11.0%) | 137 (89.0%) |
| Total (Category) | 17 (4.4%) | 366 (95.6%) |
| Total (Overall) | 1,341 (50.6%) | 1,309 (49.4%) |
Natural Resources, Construction and Maintenance Occupations
The most common Natural Resources, Construction and Maintenance occupations in Osceola are Construction & Extraction (172 | 6.5%), Installation, Maintenance & Repair (46 | 1.7%), and Farming, Fishing & Forestry (1 | 0.0%).
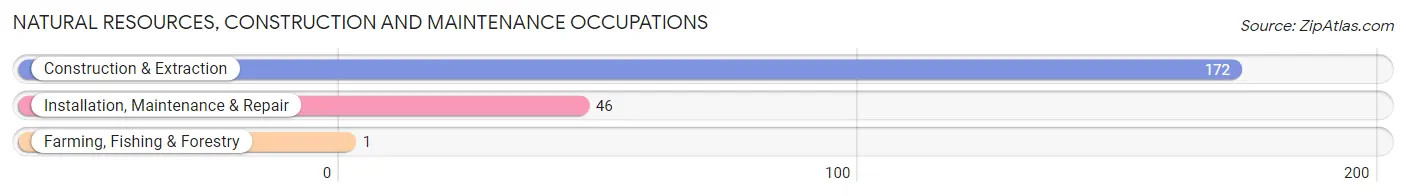
Natural Resources, Construction and Maintenance Occupations by Sex

| Occupation | Male | Female |
| Farming, Fishing & Forestry | 1 (100.0%) | 0 (0.0%) |
| Construction & Extraction | 172 (100.0%) | 0 (0.0%) |
| Installation, Maintenance & Repair | 46 (100.0%) | 0 (0.0%) |
| Total (Category) | 219 (100.0%) | 0 (0.0%) |
| Total (Overall) | 1,341 (50.6%) | 1,309 (49.4%) |
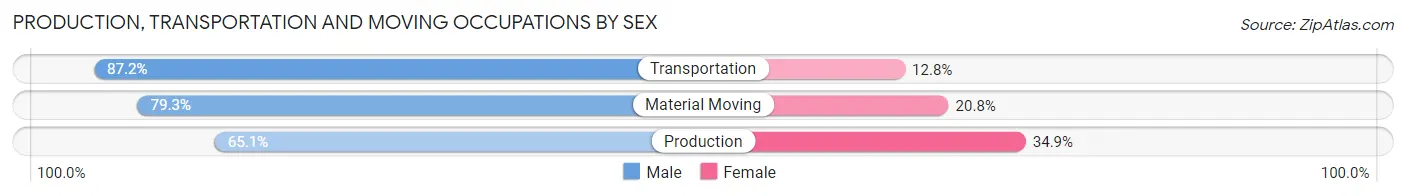
Production, Transportation and Moving Occupations
The most common Production, Transportation and Moving occupations in Osceola are Production (441 | 16.6%), Material Moving (265 | 10.0%), and Transportation (141 | 5.3%).
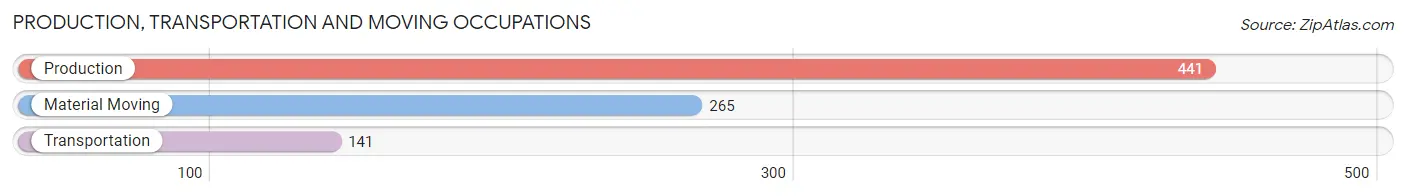
Production, Transportation and Moving Occupations by Sex
| Occupation | Male | Female |
| Production | 287 (65.1%) | 154 (34.9%) |
| Transportation | 123 (87.2%) | 18 (12.8%) |
| Material Moving | 210 (79.2%) | 55 (20.7%) |
| Total (Category) | 620 (73.2%) | 227 (26.8%) |
| Total (Overall) | 1,341 (50.6%) | 1,309 (49.4%) |
Employment Industries by Sex in Osceola
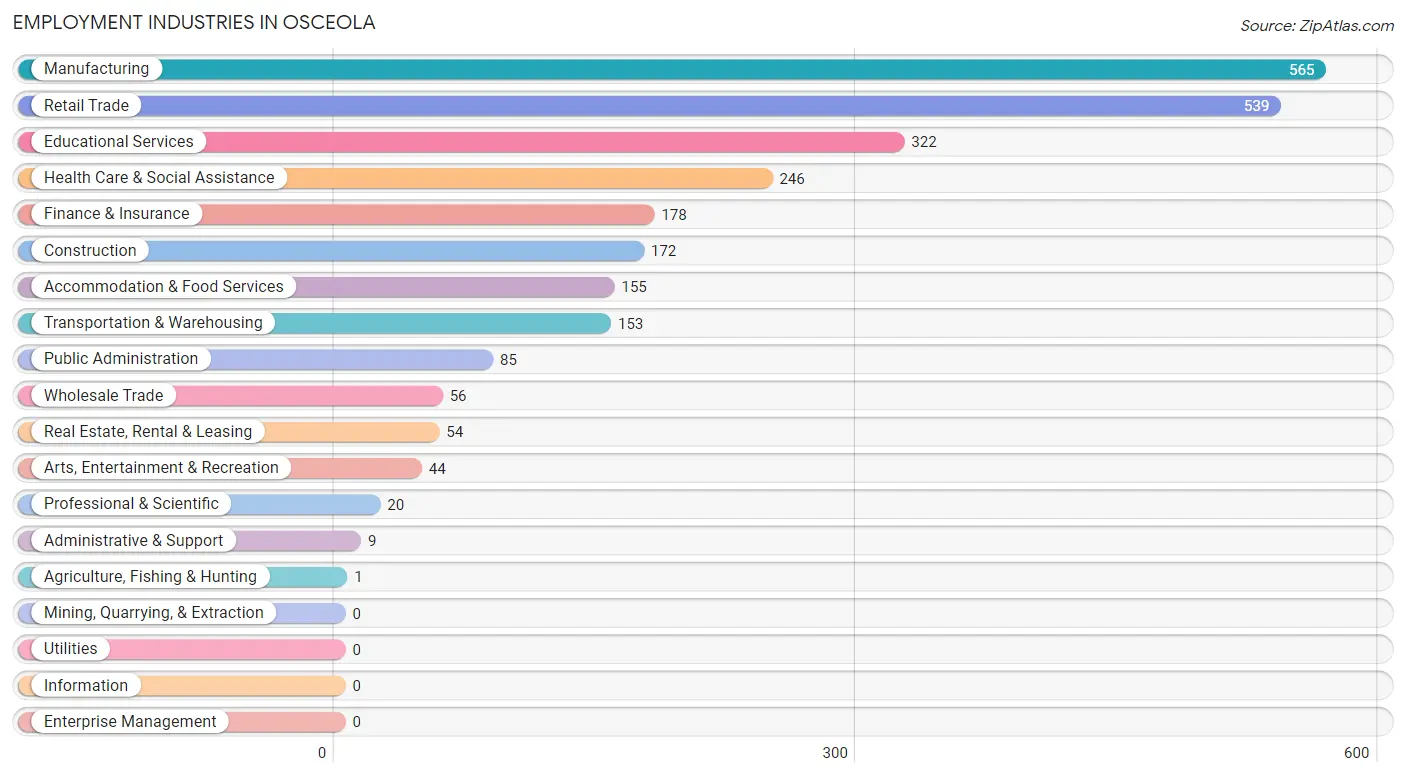
Employment Industries in Osceola
The major employment industries in Osceola include Manufacturing (565 | 21.3%), Retail Trade (539 | 20.3%), Educational Services (322 | 12.1%), Health Care & Social Assistance (246 | 9.3%), and Finance & Insurance (178 | 6.7%).
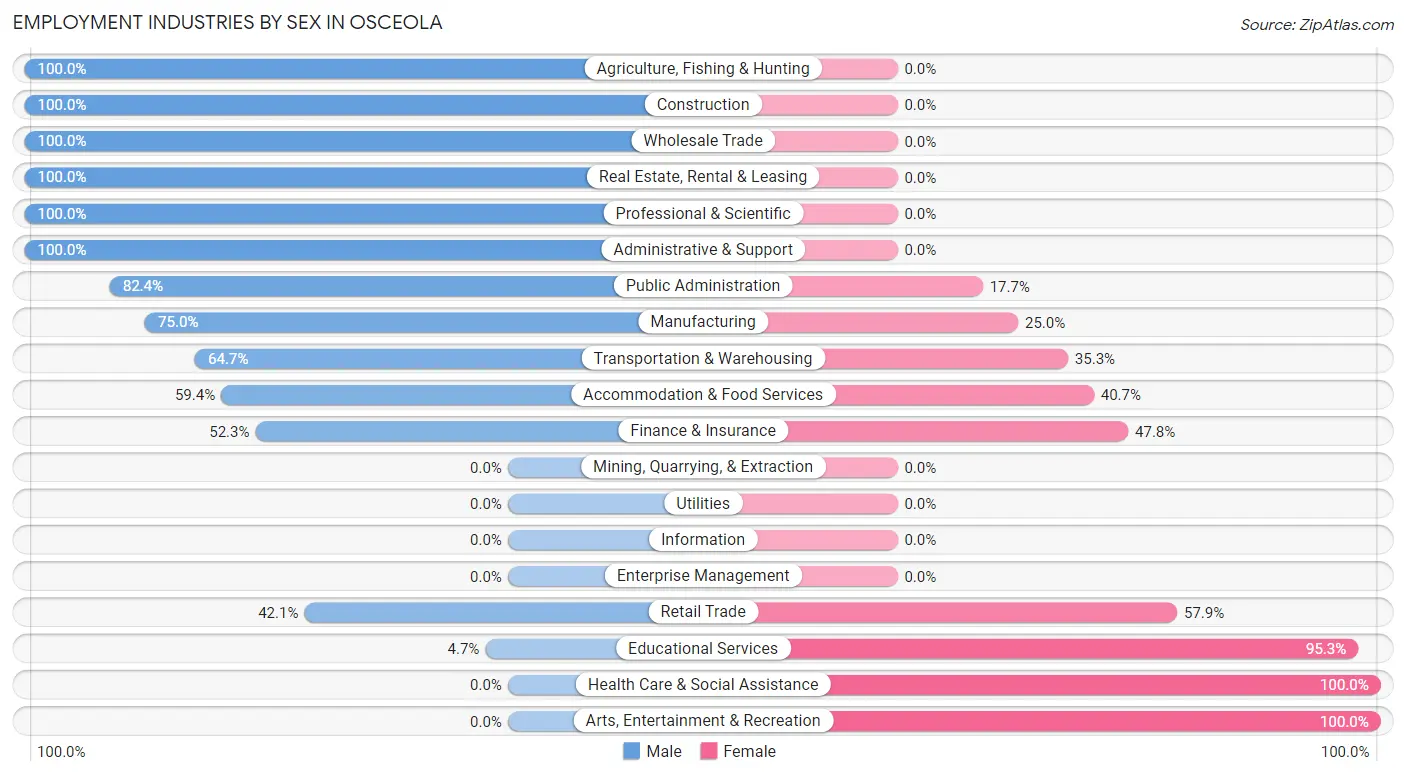
Employment Industries by Sex in Osceola
The Osceola industries that see more men than women are Agriculture, Fishing & Hunting (100.0%), Construction (100.0%), and Wholesale Trade (100.0%), whereas the industries that tend to have a higher number of women are Health Care & Social Assistance (100.0%), Arts, Entertainment & Recreation (100.0%), and Educational Services (95.3%).
| Industry | Male | Female |
| Agriculture, Fishing & Hunting | 1 (100.0%) | 0 (0.0%) |
| Mining, Quarrying, & Extraction | 0 (0.0%) | 0 (0.0%) |
| Construction | 172 (100.0%) | 0 (0.0%) |
| Manufacturing | 424 (75.0%) | 141 (25.0%) |
| Wholesale Trade | 56 (100.0%) | 0 (0.0%) |
| Retail Trade | 227 (42.1%) | 312 (57.9%) |
| Transportation & Warehousing | 99 (64.7%) | 54 (35.3%) |
| Utilities | 0 (0.0%) | 0 (0.0%) |
| Information | 0 (0.0%) | 0 (0.0%) |
| Finance & Insurance | 93 (52.2%) | 85 (47.7%) |
| Real Estate, Rental & Leasing | 54 (100.0%) | 0 (0.0%) |
| Professional & Scientific | 20 (100.0%) | 0 (0.0%) |
| Enterprise Management | 0 (0.0%) | 0 (0.0%) |
| Administrative & Support | 9 (100.0%) | 0 (0.0%) |
| Educational Services | 15 (4.7%) | 307 (95.3%) |
| Health Care & Social Assistance | 0 (0.0%) | 246 (100.0%) |
| Arts, Entertainment & Recreation | 0 (0.0%) | 44 (100.0%) |
| Accommodation & Food Services | 92 (59.4%) | 63 (40.6%) |
| Public Administration | 70 (82.4%) | 15 (17.6%) |
| Total | 1,341 (50.6%) | 1,309 (49.4%) |
Education in Osceola
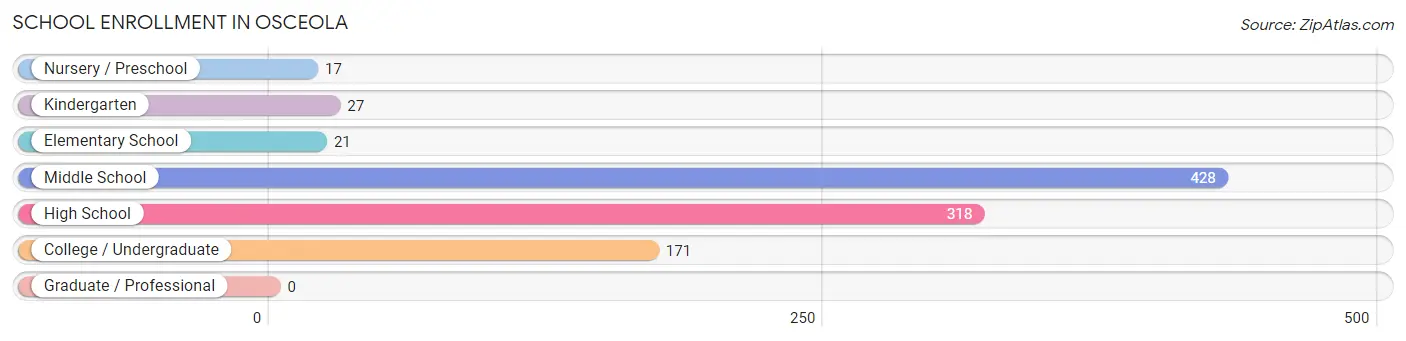
School Enrollment in Osceola
The most common levels of schooling among the 982 students in Osceola are middle school (428 | 43.6%), high school (318 | 32.4%), and college / undergraduate (171 | 17.4%).
| School Level | # Students | % Students |
| Nursery / Preschool | 17 | 1.7% |
| Kindergarten | 27 | 2.8% |
| Elementary School | 21 | 2.1% |
| Middle School | 428 | 43.6% |
| High School | 318 | 32.4% |
| College / Undergraduate | 171 | 17.4% |
| Graduate / Professional | 0 | 0.0% |
| Total | 982 | 100.0% |
School Enrollment by Age by Funding Source in Osceola
Out of a total of 982 students who are enrolled in schools in Osceola, 14 (1.4%) attend a private institution, while the remaining 968 (98.6%) are enrolled in public schools. The age group of 35 years and over has the highest likelihood of being enrolled in private schools, with 14 (12.7% in the age bracket) enrolled. Conversely, the age group of 3 to 4 year olds has the lowest likelihood of being enrolled in a private school, with 17 (100.0% in the age bracket) attending a public institution.
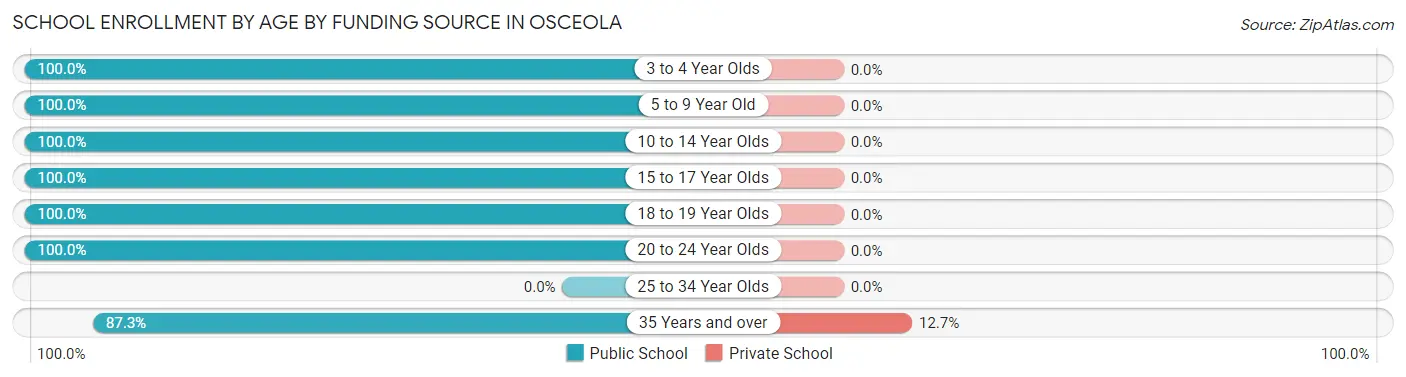
| Age Bracket | Public School | Private School |
| 3 to 4 Year Olds | 17 (100.0%) | 0 (0.0%) |
| 5 to 9 Year Old | 48 (100.0%) | 0 (0.0%) |
| 10 to 14 Year Olds | 398 (100.0%) | 0 (0.0%) |
| 15 to 17 Year Olds | 228 (100.0%) | 0 (0.0%) |
| 18 to 19 Year Olds | 137 (100.0%) | 0 (0.0%) |
| 20 to 24 Year Olds | 44 (100.0%) | 0 (0.0%) |
| 25 to 34 Year Olds | 0 (0.0%) | 0 (0.0%) |
| 35 Years and over | 96 (87.3%) | 14 (12.7%) |
| Total | 968 (98.6%) | 14 (1.4%) |
Educational Attainment by Field of Study in Osceola
Education (171 | 38.6%), science & technology (97 | 21.9%), business (69 | 15.6%), liberal arts & history (32 | 7.2%), and social sciences (20 | 4.5%) are the most common fields of study among 443 individuals in Osceola who have obtained a bachelor's degree or higher.
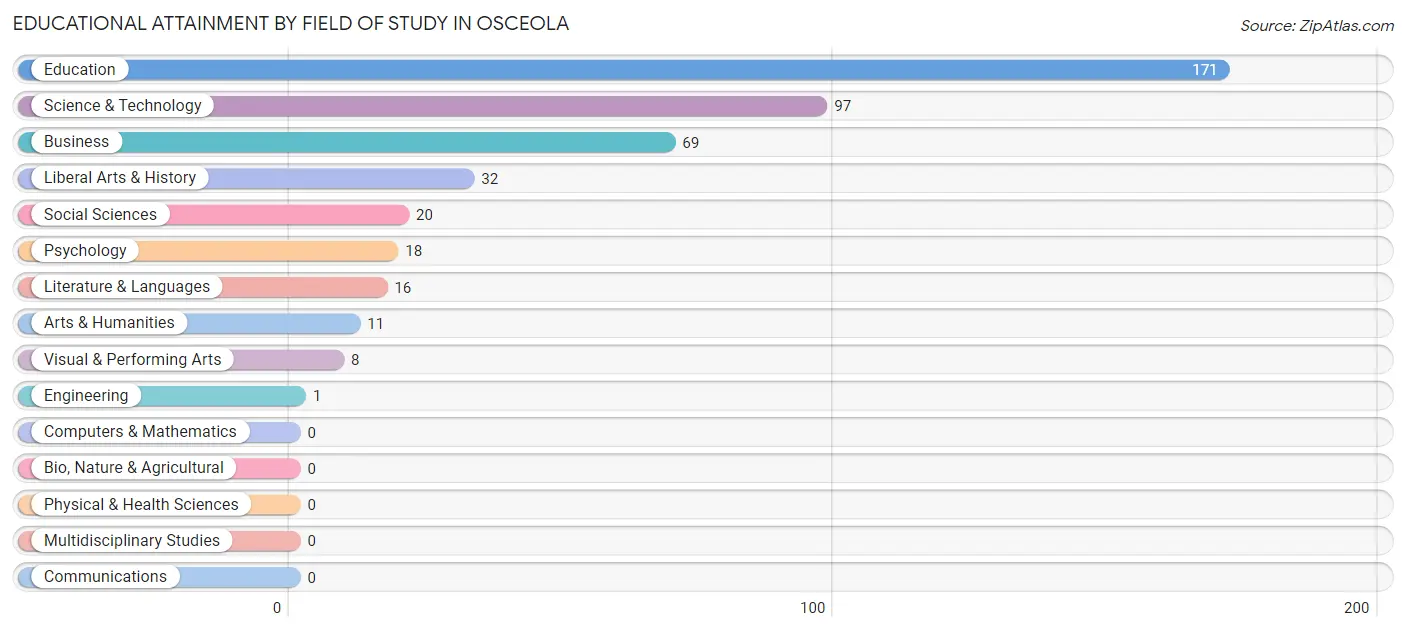
| Field of Study | # Graduates | % Graduates |
| Computers & Mathematics | 0 | 0.0% |
| Bio, Nature & Agricultural | 0 | 0.0% |
| Physical & Health Sciences | 0 | 0.0% |
| Psychology | 18 | 4.1% |
| Social Sciences | 20 | 4.5% |
| Engineering | 1 | 0.2% |
| Multidisciplinary Studies | 0 | 0.0% |
| Science & Technology | 97 | 21.9% |
| Business | 69 | 15.6% |
| Education | 171 | 38.6% |
| Literature & Languages | 16 | 3.6% |
| Liberal Arts & History | 32 | 7.2% |
| Visual & Performing Arts | 8 | 1.8% |
| Communications | 0 | 0.0% |
| Arts & Humanities | 11 | 2.5% |
| Total | 443 | 100.0% |
Transportation & Commute in Osceola
Vehicle Availability by Sex in Osceola
The most prevalent vehicle ownership categories in Osceola are males with 2 vehicles (416, accounting for 31.8%) and females with 2 vehicles (427, making up 34.1%).
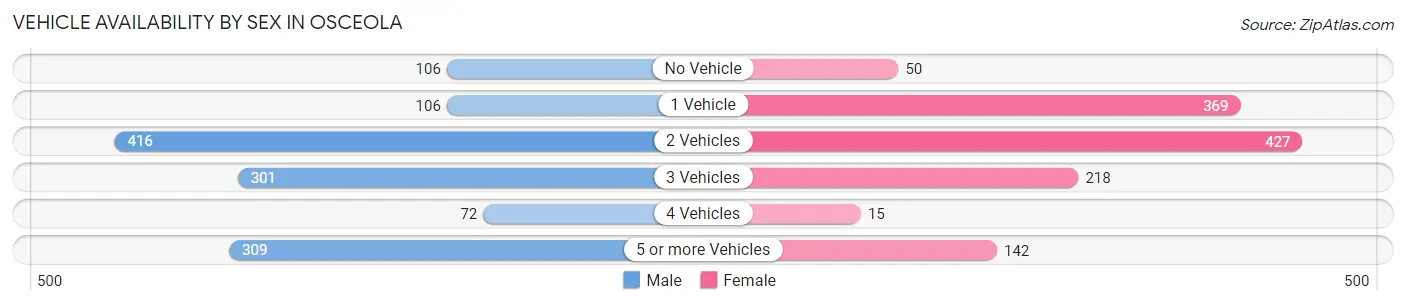
| Vehicles Available | Male | Female |
| No Vehicle | 106 (8.1%) | 50 (4.1%) |
| 1 Vehicle | 106 (8.1%) | 369 (30.2%) |
| 2 Vehicles | 416 (31.8%) | 427 (35.0%) |
| 3 Vehicles | 301 (23.0%) | 218 (17.8%) |
| 4 Vehicles | 72 (5.5%) | 15 (1.2%) |
| 5 or more Vehicles | 309 (23.6%) | 142 (11.6%) |
| Total | 1,310 (100.0%) | 1,221 (100.0%) |
Commute Time in Osceola
The most frequently occuring commute durations in Osceola are 5 to 9 minutes (810 commuters, 34.7%), less than 5 minutes (469 commuters, 20.1%), and 45 to 59 minutes (391 commuters, 16.7%).
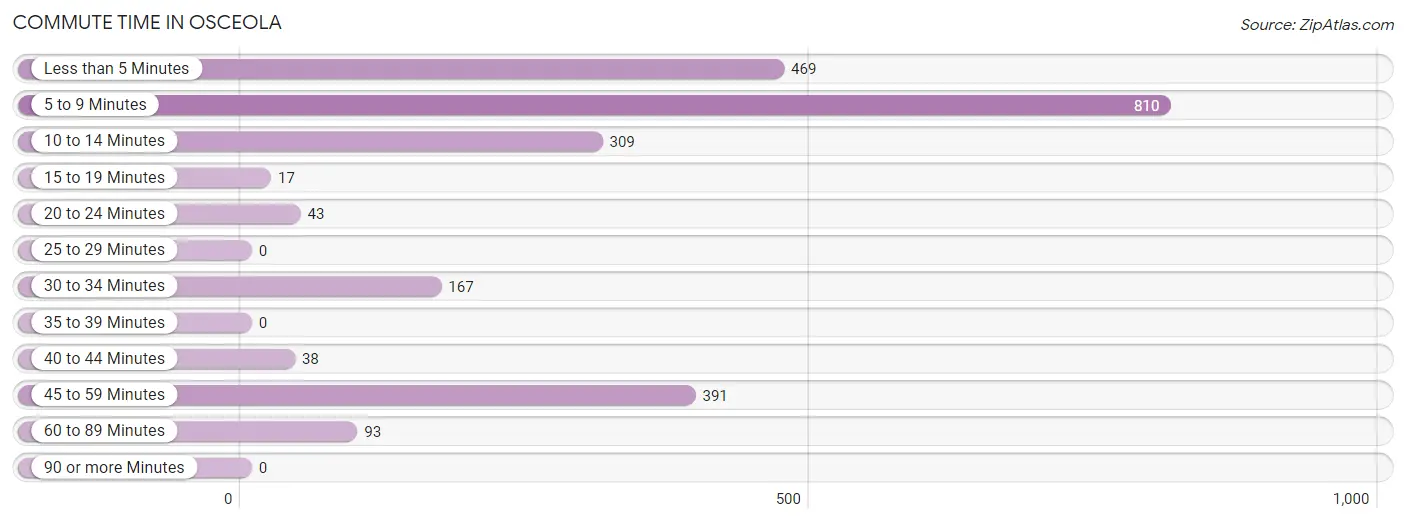
| Commute Time | # Commuters | % Commuters |
| Less than 5 Minutes | 469 | 20.1% |
| 5 to 9 Minutes | 810 | 34.7% |
| 10 to 14 Minutes | 309 | 13.2% |
| 15 to 19 Minutes | 17 | 0.7% |
| 20 to 24 Minutes | 43 | 1.8% |
| 25 to 29 Minutes | 0 | 0.0% |
| 30 to 34 Minutes | 167 | 7.1% |
| 35 to 39 Minutes | 0 | 0.0% |
| 40 to 44 Minutes | 38 | 1.6% |
| 45 to 59 Minutes | 391 | 16.7% |
| 60 to 89 Minutes | 93 | 4.0% |
| 90 or more Minutes | 0 | 0.0% |
Commute Time by Sex in Osceola
The most common commute times in Osceola are 5 to 9 minutes (457 commuters, 36.9%) for males and 5 to 9 minutes (353 commuters, 32.1%) for females.
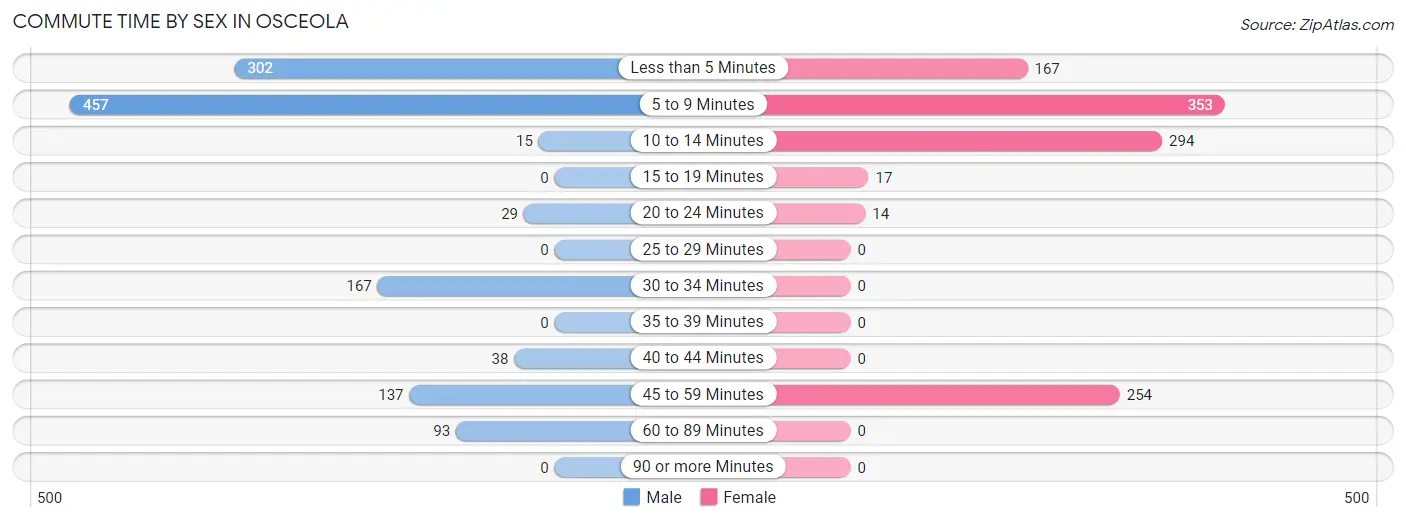
| Commute Time | Male | Female |
| Less than 5 Minutes | 302 (24.4%) | 167 (15.2%) |
| 5 to 9 Minutes | 457 (36.9%) | 353 (32.1%) |
| 10 to 14 Minutes | 15 (1.2%) | 294 (26.8%) |
| 15 to 19 Minutes | 0 (0.0%) | 17 (1.5%) |
| 20 to 24 Minutes | 29 (2.3%) | 14 (1.3%) |
| 25 to 29 Minutes | 0 (0.0%) | 0 (0.0%) |
| 30 to 34 Minutes | 167 (13.5%) | 0 (0.0%) |
| 35 to 39 Minutes | 0 (0.0%) | 0 (0.0%) |
| 40 to 44 Minutes | 38 (3.1%) | 0 (0.0%) |
| 45 to 59 Minutes | 137 (11.1%) | 254 (23.1%) |
| 60 to 89 Minutes | 93 (7.5%) | 0 (0.0%) |
| 90 or more Minutes | 0 (0.0%) | 0 (0.0%) |
Time of Departure to Work by Sex in Osceola
The most frequent times of departure to work in Osceola are 12:00 PM to 3:59 PM (237, 19.1%) for males and 6:30 AM to 6:59 AM (210, 19.1%) for females.
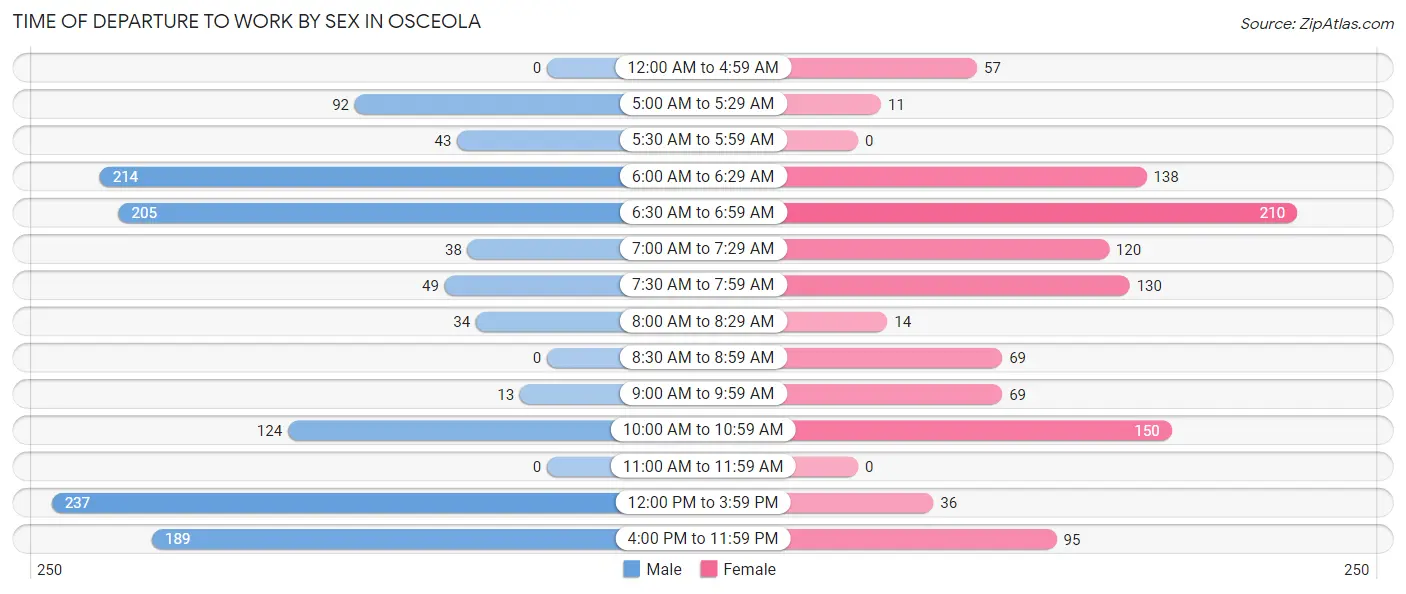
| Time of Departure | Male | Female |
| 12:00 AM to 4:59 AM | 0 (0.0%) | 57 (5.2%) |
| 5:00 AM to 5:29 AM | 92 (7.4%) | 11 (1.0%) |
| 5:30 AM to 5:59 AM | 43 (3.5%) | 0 (0.0%) |
| 6:00 AM to 6:29 AM | 214 (17.3%) | 138 (12.6%) |
| 6:30 AM to 6:59 AM | 205 (16.6%) | 210 (19.1%) |
| 7:00 AM to 7:29 AM | 38 (3.1%) | 120 (10.9%) |
| 7:30 AM to 7:59 AM | 49 (4.0%) | 130 (11.8%) |
| 8:00 AM to 8:29 AM | 34 (2.8%) | 14 (1.3%) |
| 8:30 AM to 8:59 AM | 0 (0.0%) | 69 (6.3%) |
| 9:00 AM to 9:59 AM | 13 (1.1%) | 69 (6.3%) |
| 10:00 AM to 10:59 AM | 124 (10.0%) | 150 (13.7%) |
| 11:00 AM to 11:59 AM | 0 (0.0%) | 0 (0.0%) |
| 12:00 PM to 3:59 PM | 237 (19.1%) | 36 (3.3%) |
| 4:00 PM to 11:59 PM | 189 (15.3%) | 95 (8.6%) |
| Total | 1,238 (100.0%) | 1,099 (100.0%) |
Housing Occupancy in Osceola
Occupancy by Ownership in Osceola
Of the total 2,299 dwellings in Osceola, owner-occupied units account for 1,383 (60.2%), while renter-occupied units make up 916 (39.8%).
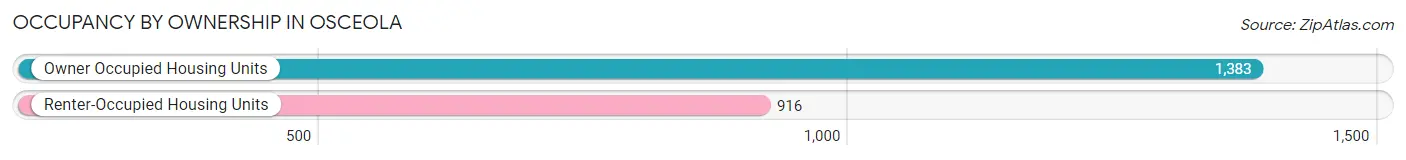
| Occupancy | # Housing Units | % Housing Units |
| Owner Occupied Housing Units | 1,383 | 60.2% |
| Renter-Occupied Housing Units | 916 | 39.8% |
| Total Occupied Housing Units | 2,299 | 100.0% |
Occupancy by Household Size in Osceola
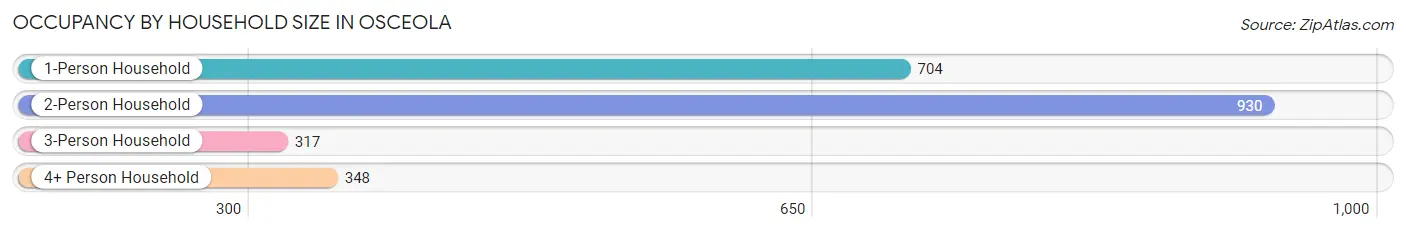
| Household Size | # Housing Units | % Housing Units |
| 1-Person Household | 704 | 30.6% |
| 2-Person Household | 930 | 40.5% |
| 3-Person Household | 317 | 13.8% |
| 4+ Person Household | 348 | 15.1% |
| Total Housing Units | 2,299 | 100.0% |
Occupancy by Ownership by Household Size in Osceola
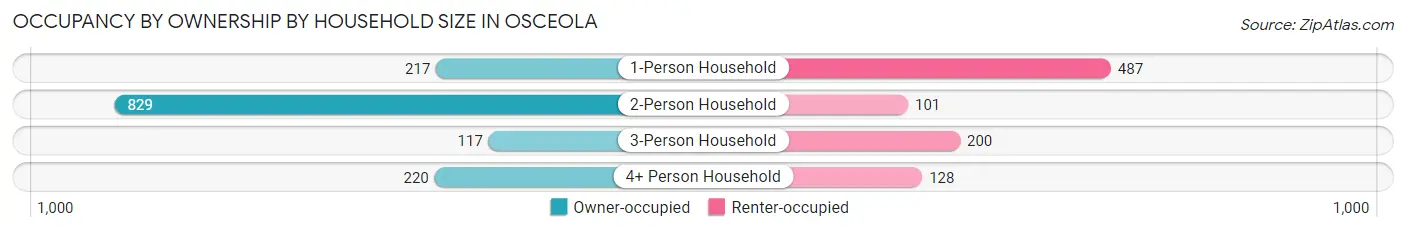
| Household Size | Owner-occupied | Renter-occupied |
| 1-Person Household | 217 (30.8%) | 487 (69.2%) |
| 2-Person Household | 829 (89.1%) | 101 (10.9%) |
| 3-Person Household | 117 (36.9%) | 200 (63.1%) |
| 4+ Person Household | 220 (63.2%) | 128 (36.8%) |
| Total Housing Units | 1,383 (60.2%) | 916 (39.8%) |
Occupancy by Educational Attainment in Osceola
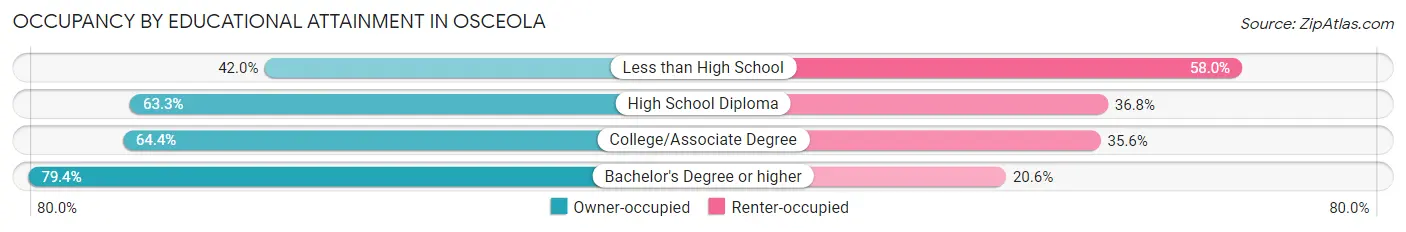
| Household Size | Owner-occupied | Renter-occupied |
| Less than High School | 241 (42.0%) | 333 (58.0%) |
| High School Diploma | 537 (63.2%) | 312 (36.7%) |
| College/Associate Degree | 389 (64.4%) | 215 (35.6%) |
| Bachelor's Degree or higher | 216 (79.4%) | 56 (20.6%) |
Occupancy by Age of Householder in Osceola
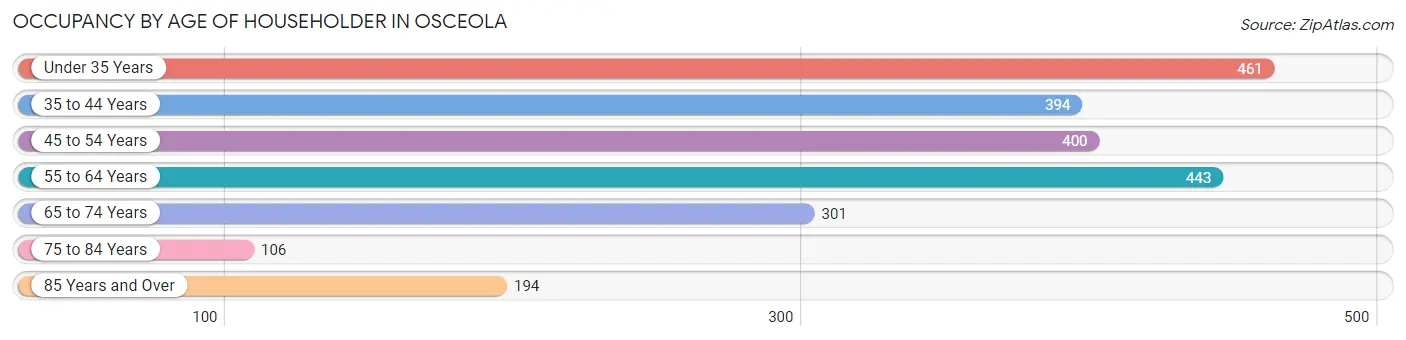
| Age Bracket | # Households | % Households |
| Under 35 Years | 461 | 20.1% |
| 35 to 44 Years | 394 | 17.1% |
| 45 to 54 Years | 400 | 17.4% |
| 55 to 64 Years | 443 | 19.3% |
| 65 to 74 Years | 301 | 13.1% |
| 75 to 84 Years | 106 | 4.6% |
| 85 Years and Over | 194 | 8.4% |
| Total | 2,299 | 100.0% |
Housing Finances in Osceola
Median Income by Occupancy in Osceola
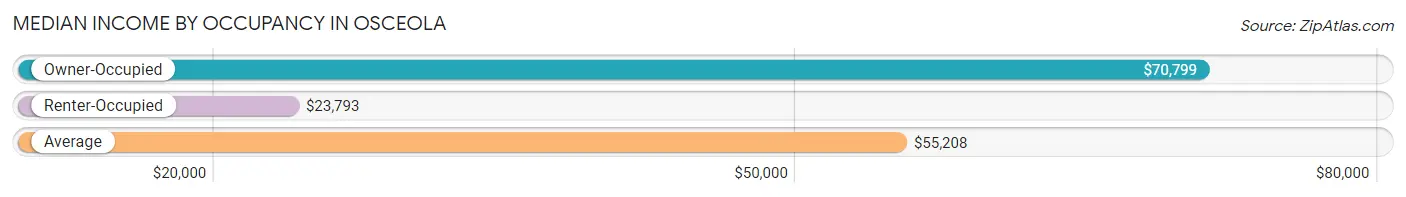
| Occupancy Type | # Households | Median Income |
| Owner-Occupied | 1,383 (60.2%) | $70,799 |
| Renter-Occupied | 916 (39.8%) | $23,793 |
| Average | 2,299 (100.0%) | $55,208 |
Occupancy by Householder Income Bracket in Osceola
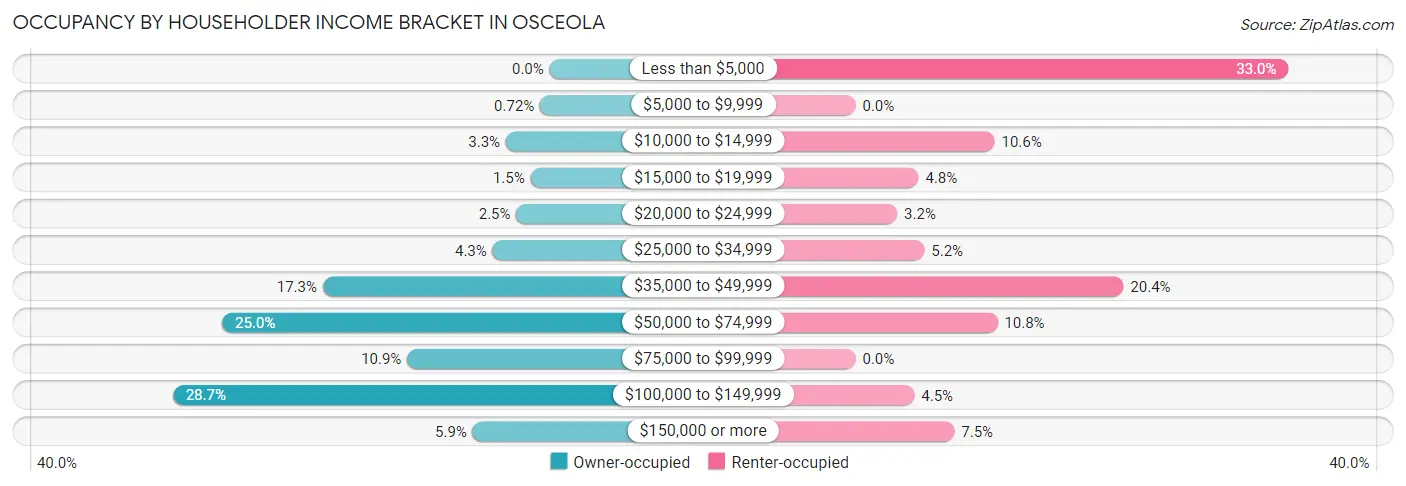
| Income Bracket | Owner-occupied | Renter-occupied |
| Less than $5,000 | 0 (0.0%) | 302 (33.0%) |
| $5,000 to $9,999 | 10 (0.7%) | 0 (0.0%) |
| $10,000 to $14,999 | 46 (3.3%) | 97 (10.6%) |
| $15,000 to $19,999 | 20 (1.5%) | 44 (4.8%) |
| $20,000 to $24,999 | 35 (2.5%) | 29 (3.2%) |
| $25,000 to $34,999 | 60 (4.3%) | 48 (5.2%) |
| $35,000 to $49,999 | 239 (17.3%) | 187 (20.4%) |
| $50,000 to $74,999 | 345 (24.9%) | 99 (10.8%) |
| $75,000 to $99,999 | 150 (10.8%) | 0 (0.0%) |
| $100,000 to $149,999 | 397 (28.7%) | 41 (4.5%) |
| $150,000 or more | 81 (5.9%) | 69 (7.5%) |
| Total | 1,383 (100.0%) | 916 (100.0%) |
Monthly Housing Cost Tiers in Osceola
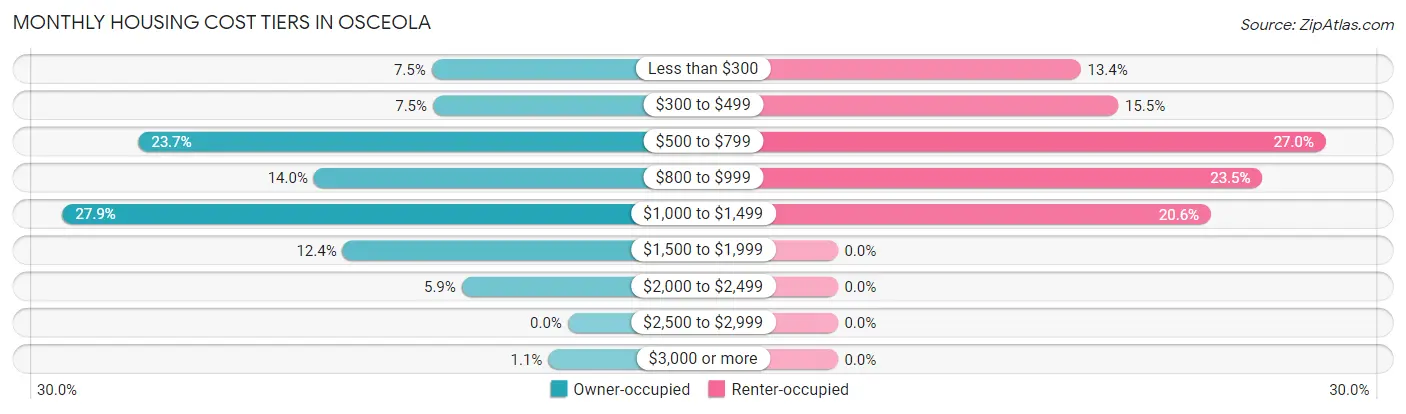
| Monthly Cost | Owner-occupied | Renter-occupied |
| Less than $300 | 104 (7.5%) | 123 (13.4%) |
| $300 to $499 | 103 (7.4%) | 142 (15.5%) |
| $500 to $799 | 328 (23.7%) | 247 (27.0%) |
| $800 to $999 | 194 (14.0%) | 215 (23.5%) |
| $1,000 to $1,499 | 386 (27.9%) | 189 (20.6%) |
| $1,500 to $1,999 | 172 (12.4%) | 0 (0.0%) |
| $2,000 to $2,499 | 81 (5.9%) | 0 (0.0%) |
| $2,500 to $2,999 | 0 (0.0%) | 0 (0.0%) |
| $3,000 or more | 15 (1.1%) | 0 (0.0%) |
| Total | 1,383 (100.0%) | 916 (100.0%) |
Physical Housing Characteristics in Osceola
Housing Structures in Osceola
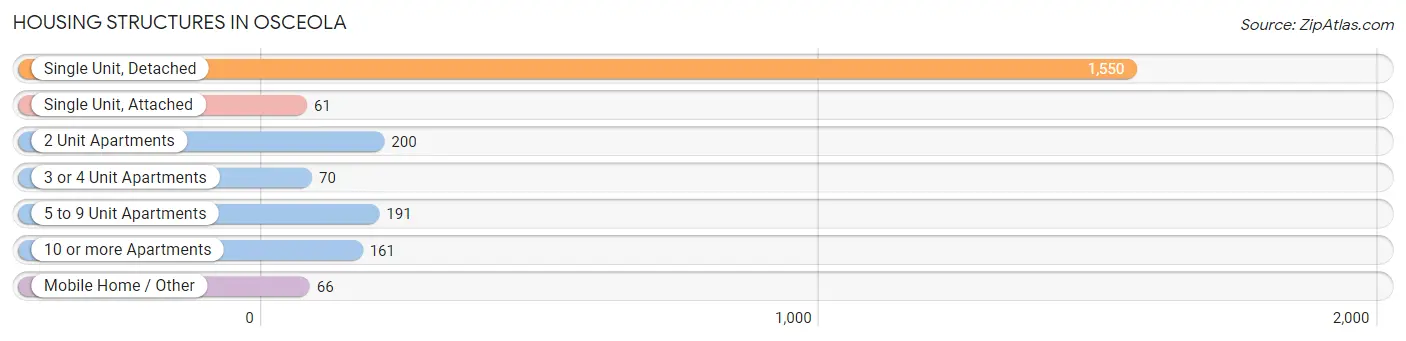
| Structure Type | # Housing Units | % Housing Units |
| Single Unit, Detached | 1,550 | 67.4% |
| Single Unit, Attached | 61 | 2.6% |
| 2 Unit Apartments | 200 | 8.7% |
| 3 or 4 Unit Apartments | 70 | 3.0% |
| 5 to 9 Unit Apartments | 191 | 8.3% |
| 10 or more Apartments | 161 | 7.0% |
| Mobile Home / Other | 66 | 2.9% |
| Total | 2,299 | 100.0% |
Housing Structures by Occupancy in Osceola
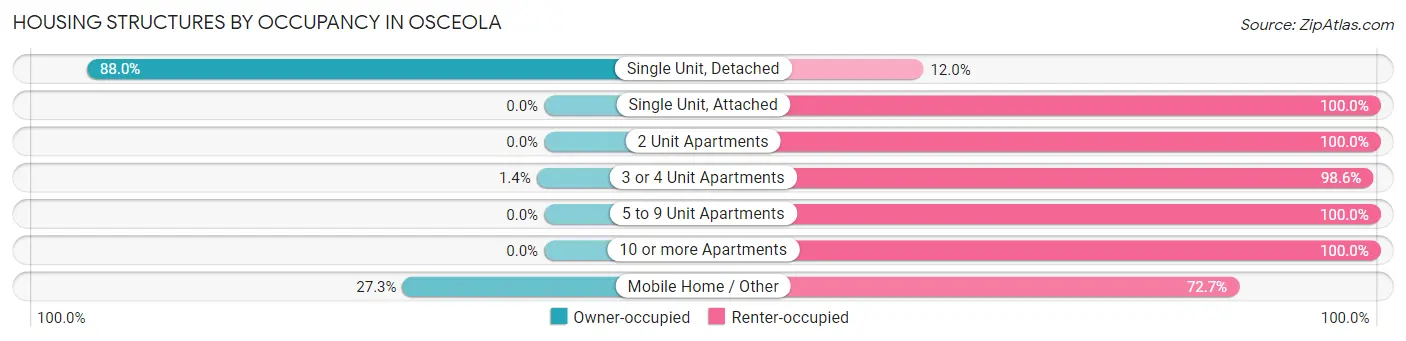
| Structure Type | Owner-occupied | Renter-occupied |
| Single Unit, Detached | 1,364 (88.0%) | 186 (12.0%) |
| Single Unit, Attached | 0 (0.0%) | 61 (100.0%) |
| 2 Unit Apartments | 0 (0.0%) | 200 (100.0%) |
| 3 or 4 Unit Apartments | 1 (1.4%) | 69 (98.6%) |
| 5 to 9 Unit Apartments | 0 (0.0%) | 191 (100.0%) |
| 10 or more Apartments | 0 (0.0%) | 161 (100.0%) |
| Mobile Home / Other | 18 (27.3%) | 48 (72.7%) |
| Total | 1,383 (60.2%) | 916 (39.8%) |
Housing Structures by Number of Rooms in Osceola
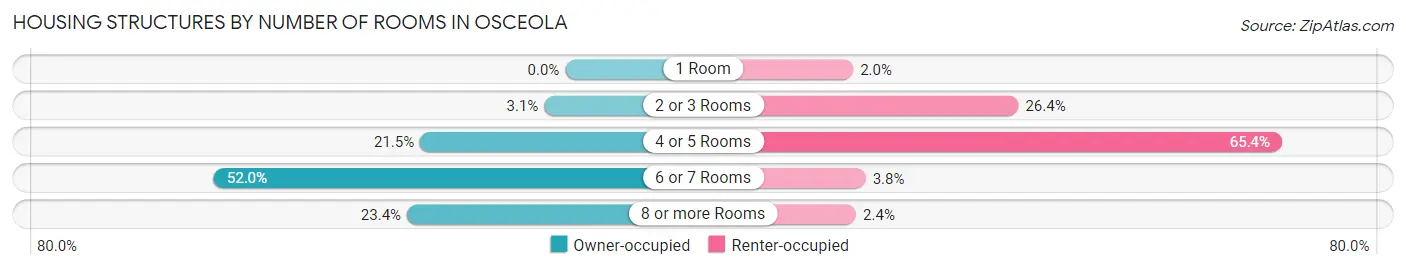
| Number of Rooms | Owner-occupied | Renter-occupied |
| 1 Room | 0 (0.0%) | 18 (2.0%) |
| 2 or 3 Rooms | 43 (3.1%) | 242 (26.4%) |
| 4 or 5 Rooms | 297 (21.5%) | 599 (65.4%) |
| 6 or 7 Rooms | 719 (52.0%) | 35 (3.8%) |
| 8 or more Rooms | 324 (23.4%) | 22 (2.4%) |
| Total | 1,383 (100.0%) | 916 (100.0%) |
Housing Structure by Heating Type in Osceola
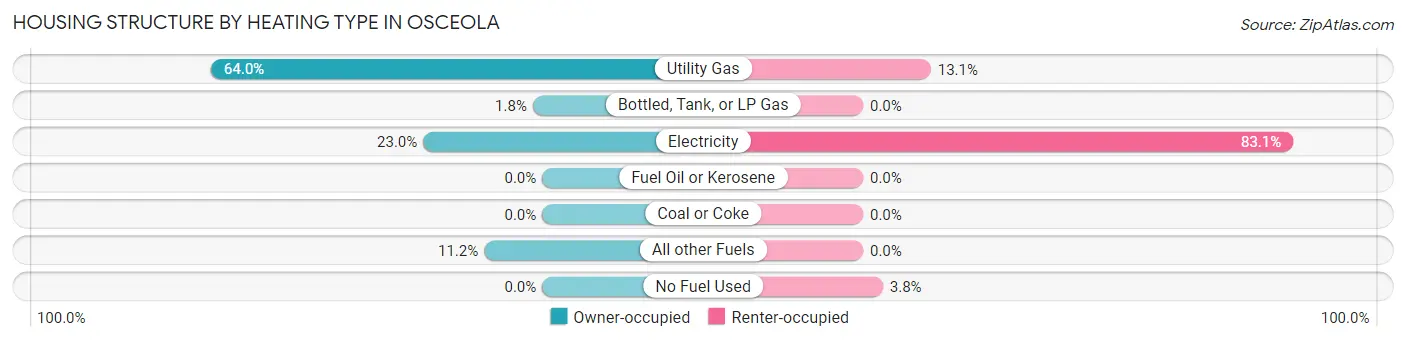
| Heating Type | Owner-occupied | Renter-occupied |
| Utility Gas | 885 (64.0%) | 120 (13.1%) |
| Bottled, Tank, or LP Gas | 25 (1.8%) | 0 (0.0%) |
| Electricity | 318 (23.0%) | 761 (83.1%) |
| Fuel Oil or Kerosene | 0 (0.0%) | 0 (0.0%) |
| Coal or Coke | 0 (0.0%) | 0 (0.0%) |
| All other Fuels | 155 (11.2%) | 0 (0.0%) |
| No Fuel Used | 0 (0.0%) | 35 (3.8%) |
| Total | 1,383 (100.0%) | 916 (100.0%) |
Household Vehicle Usage in Osceola
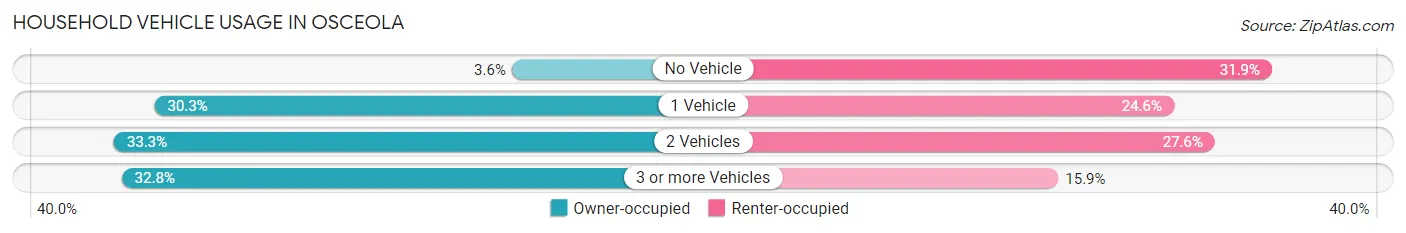
| Vehicles per Household | Owner-occupied | Renter-occupied |
| No Vehicle | 50 (3.6%) | 292 (31.9%) |
| 1 Vehicle | 419 (30.3%) | 225 (24.6%) |
| 2 Vehicles | 461 (33.3%) | 253 (27.6%) |
| 3 or more Vehicles | 453 (32.8%) | 146 (15.9%) |
| Total | 1,383 (100.0%) | 916 (100.0%) |
Real Estate & Mortgages in Osceola
Real Estate and Mortgage Overview in Osceola
| Characteristic | Without Mortgage | With Mortgage |
| Housing Units | 558 | 825 |
| Median Property Value | $92,500 | $123,100 |
| Median Household Income | - | - |
| Monthly Housing Costs | $572 | $15 |
| Real Estate Taxes | $1,722 | $25 |
Property Value by Mortgage Status in Osceola
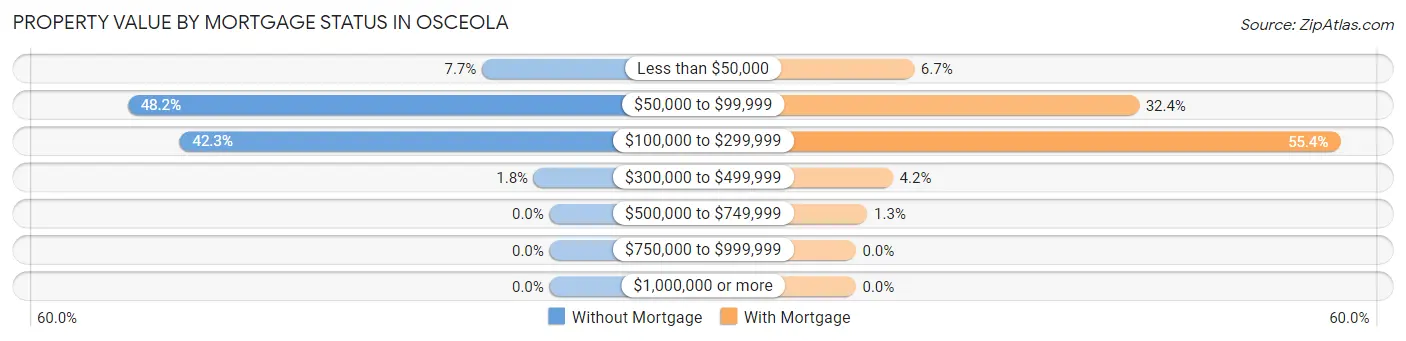
| Property Value | Without Mortgage | With Mortgage |
| Less than $50,000 | 43 (7.7%) | 55 (6.7%) |
| $50,000 to $99,999 | 269 (48.2%) | 267 (32.4%) |
| $100,000 to $299,999 | 236 (42.3%) | 457 (55.4%) |
| $300,000 to $499,999 | 10 (1.8%) | 35 (4.2%) |
| $500,000 to $749,999 | 0 (0.0%) | 11 (1.3%) |
| $750,000 to $999,999 | 0 (0.0%) | 0 (0.0%) |
| $1,000,000 or more | 0 (0.0%) | 0 (0.0%) |
| Total | 558 (100.0%) | 825 (100.0%) |
Household Income by Mortgage Status in Osceola
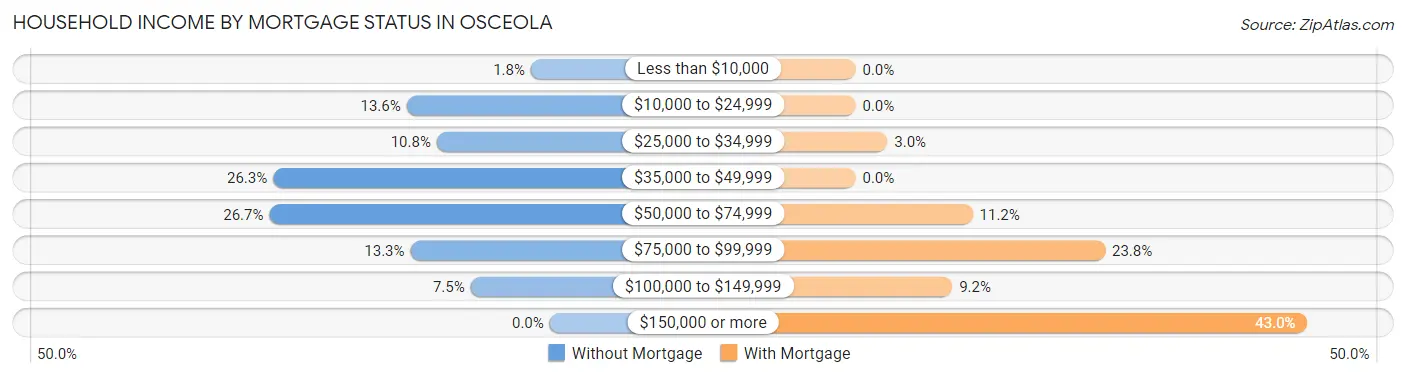
| Household Income | Without Mortgage | With Mortgage |
| Less than $10,000 | 10 (1.8%) | 0 (0.0%) |
| $10,000 to $24,999 | 76 (13.6%) | 0 (0.0%) |
| $25,000 to $34,999 | 60 (10.7%) | 25 (3.0%) |
| $35,000 to $49,999 | 147 (26.3%) | 0 (0.0%) |
| $50,000 to $74,999 | 149 (26.7%) | 92 (11.2%) |
| $75,000 to $99,999 | 74 (13.3%) | 196 (23.8%) |
| $100,000 to $149,999 | 42 (7.5%) | 76 (9.2%) |
| $150,000 or more | 0 (0.0%) | 355 (43.0%) |
| Total | 558 (100.0%) | 825 (100.0%) |
Property Value to Household Income Ratio in Osceola
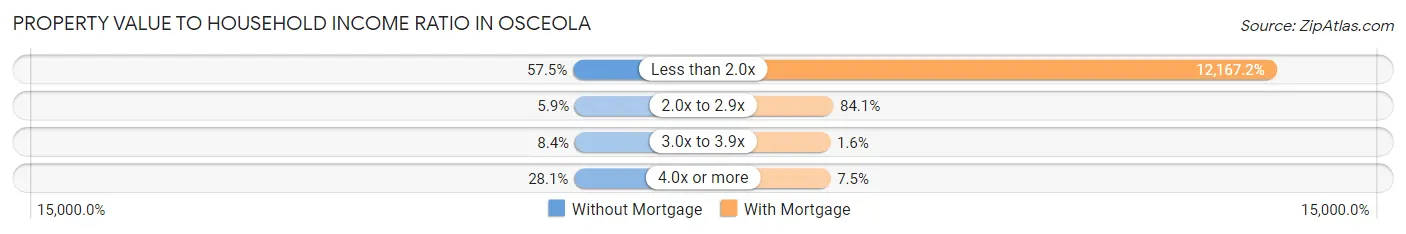
| Value-to-Income Ratio | Without Mortgage | With Mortgage |
| Less than 2.0x | 321 (57.5%) | 100,379 (12,167.1%) |
| 2.0x to 2.9x | 33 (5.9%) | 694 (84.1%) |
| 3.0x to 3.9x | 47 (8.4%) | 13 (1.6%) |
| 4.0x or more | 157 (28.1%) | 62 (7.5%) |
| Total | 558 (100.0%) | 825 (100.0%) |
Real Estate Taxes by Mortgage Status in Osceola
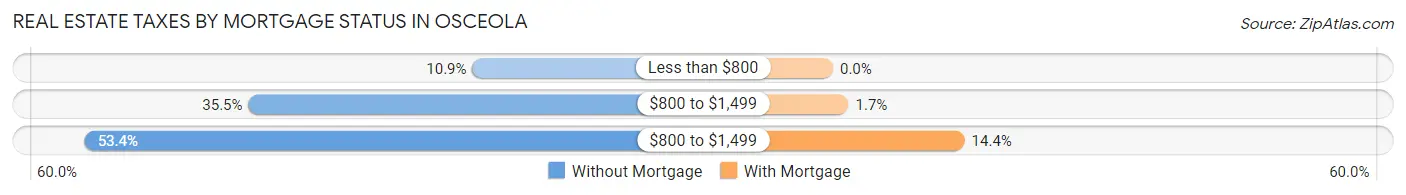
| Property Taxes | Without Mortgage | With Mortgage |
| Less than $800 | 61 (10.9%) | 0 (0.0%) |
| $800 to $1,499 | 198 (35.5%) | 14 (1.7%) |
| $800 to $1,499 | 298 (53.4%) | 119 (14.4%) |
| Total | 558 (100.0%) | 825 (100.0%) |
Health & Disability in Osceola
Health Insurance Coverage by Age in Osceola
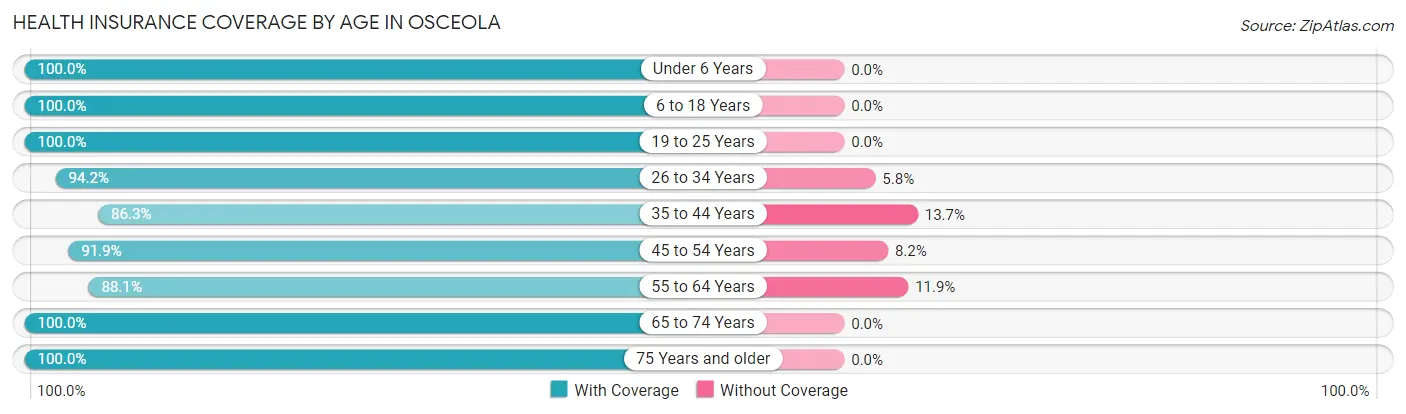
| Age Bracket | With Coverage | Without Coverage |
| Under 6 Years | 627 (100.0%) | 0 (0.0%) |
| 6 to 18 Years | 862 (100.0%) | 0 (0.0%) |
| 19 to 25 Years | 414 (100.0%) | 0 (0.0%) |
| 26 to 34 Years | 601 (94.2%) | 37 (5.8%) |
| 35 to 44 Years | 485 (86.3%) | 77 (13.7%) |
| 45 to 54 Years | 552 (91.8%) | 49 (8.2%) |
| 55 to 64 Years | 680 (88.1%) | 92 (11.9%) |
| 65 to 74 Years | 485 (100.0%) | 0 (0.0%) |
| 75 Years and older | 323 (100.0%) | 0 (0.0%) |
| Total | 5,029 (95.2%) | 255 (4.8%) |
Health Insurance Coverage by Citizenship Status in Osceola
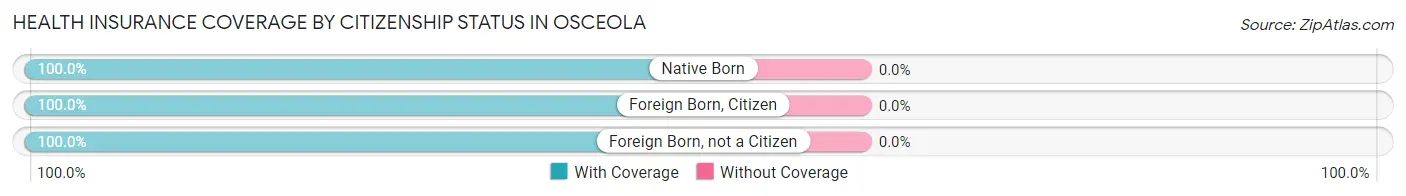
| Citizenship Status | With Coverage | Without Coverage |
| Native Born | 627 (100.0%) | 0 (0.0%) |
| Foreign Born, Citizen | 862 (100.0%) | 0 (0.0%) |
| Foreign Born, not a Citizen | 414 (100.0%) | 0 (0.0%) |
Health Insurance Coverage by Household Income in Osceola
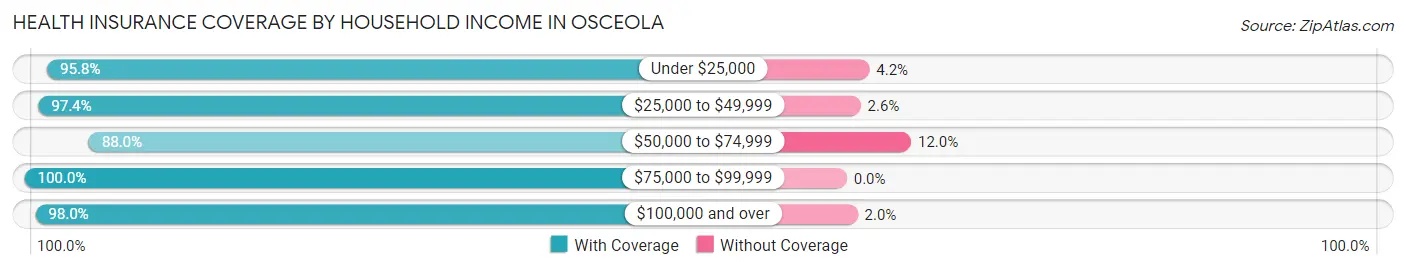
| Household Income | With Coverage | Without Coverage |
| Under $25,000 | 1,088 (95.8%) | 48 (4.2%) |
| $25,000 to $49,999 | 1,015 (97.4%) | 27 (2.6%) |
| $50,000 to $74,999 | 1,067 (88.0%) | 146 (12.0%) |
| $75,000 to $99,999 | 444 (100.0%) | 0 (0.0%) |
| $100,000 and over | 1,401 (98.0%) | 29 (2.0%) |
Public vs Private Health Insurance Coverage by Age in Osceola
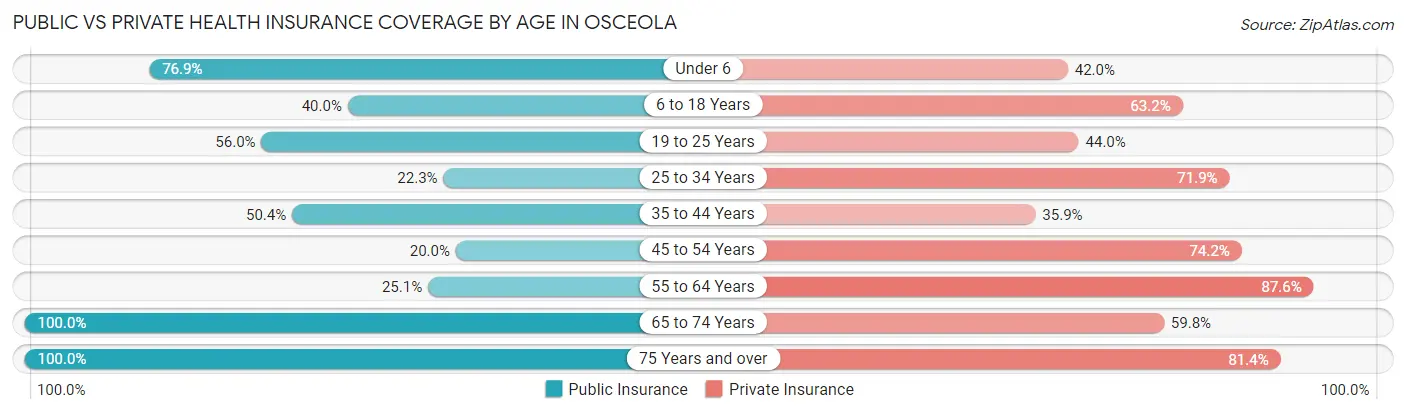
| Age Bracket | Public Insurance | Private Insurance |
| Under 6 | 482 (76.9%) | 263 (41.9%) |
| 6 to 18 Years | 345 (40.0%) | 545 (63.2%) |
| 19 to 25 Years | 232 (56.0%) | 182 (44.0%) |
| 25 to 34 Years | 142 (22.3%) | 459 (71.9%) |
| 35 to 44 Years | 283 (50.4%) | 202 (35.9%) |
| 45 to 54 Years | 120 (20.0%) | 446 (74.2%) |
| 55 to 64 Years | 194 (25.1%) | 676 (87.6%) |
| 65 to 74 Years | 485 (100.0%) | 290 (59.8%) |
| 75 Years and over | 323 (100.0%) | 263 (81.4%) |
| Total | 2,606 (49.3%) | 3,326 (62.9%) |
Disability Status by Sex by Age in Osceola
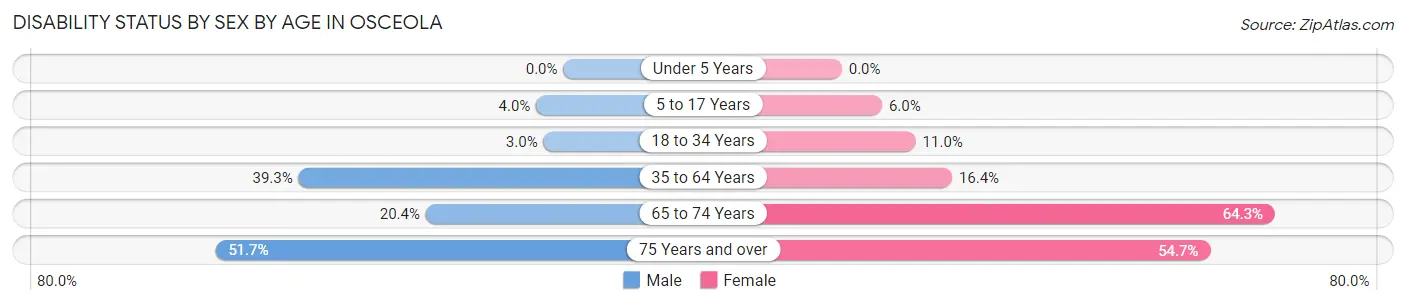
| Age Bracket | Male | Female |
| Under 5 Years | 0 (0.0%) | 0 (0.0%) |
| 5 to 17 Years | 19 (4.0%) | 18 (6.0%) |
| 18 to 34 Years | 18 (2.9%) | 69 (11.0%) |
| 35 to 64 Years | 381 (39.3%) | 158 (16.4%) |
| 65 to 74 Years | 47 (20.4%) | 164 (64.3%) |
| 75 Years and over | 46 (51.7%) | 128 (54.7%) |
Disability Class by Sex by Age in Osceola
Disability Class: Hearing Difficulty
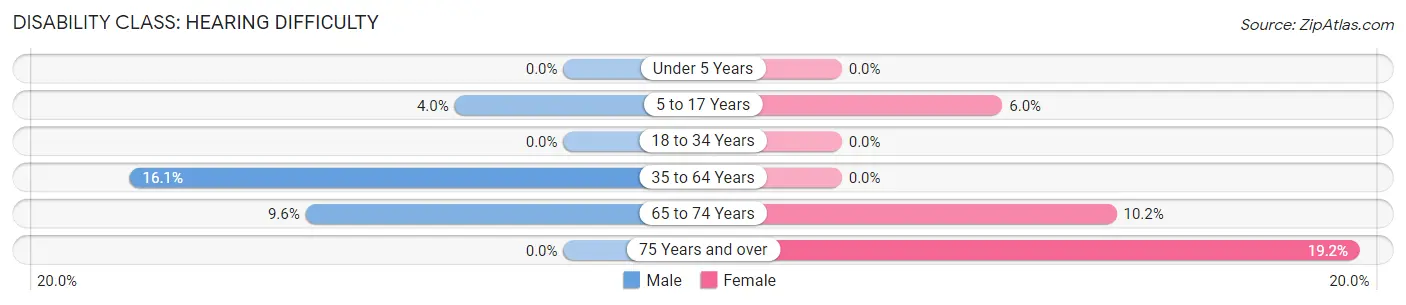
| Age Bracket | Male | Female |
| Under 5 Years | 0 (0.0%) | 0 (0.0%) |
| 5 to 17 Years | 19 (4.0%) | 18 (6.0%) |
| 18 to 34 Years | 0 (0.0%) | 0 (0.0%) |
| 35 to 64 Years | 156 (16.1%) | 0 (0.0%) |
| 65 to 74 Years | 22 (9.6%) | 26 (10.2%) |
| 75 Years and over | 0 (0.0%) | 45 (19.2%) |
Disability Class: Vision Difficulty
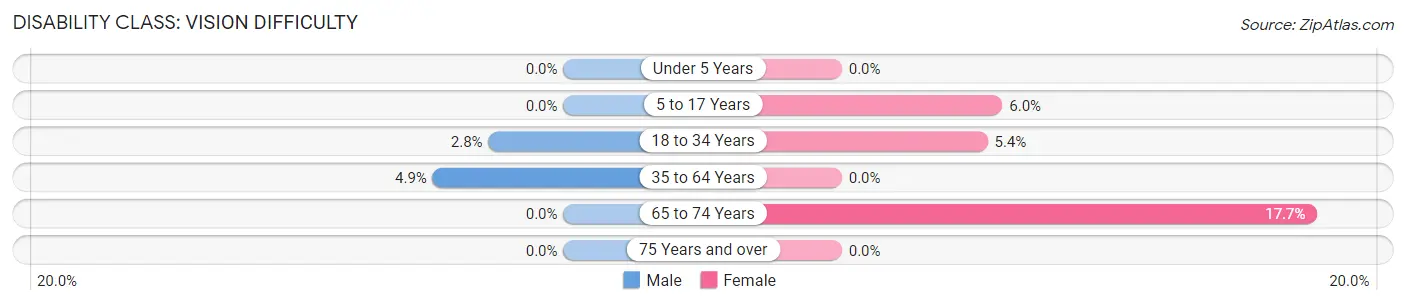
| Age Bracket | Male | Female |
| Under 5 Years | 0 (0.0%) | 0 (0.0%) |
| 5 to 17 Years | 0 (0.0%) | 18 (6.0%) |
| 18 to 34 Years | 17 (2.8%) | 34 (5.4%) |
| 35 to 64 Years | 47 (4.9%) | 0 (0.0%) |
| 65 to 74 Years | 0 (0.0%) | 45 (17.6%) |
| 75 Years and over | 0 (0.0%) | 0 (0.0%) |
Disability Class: Cognitive Difficulty
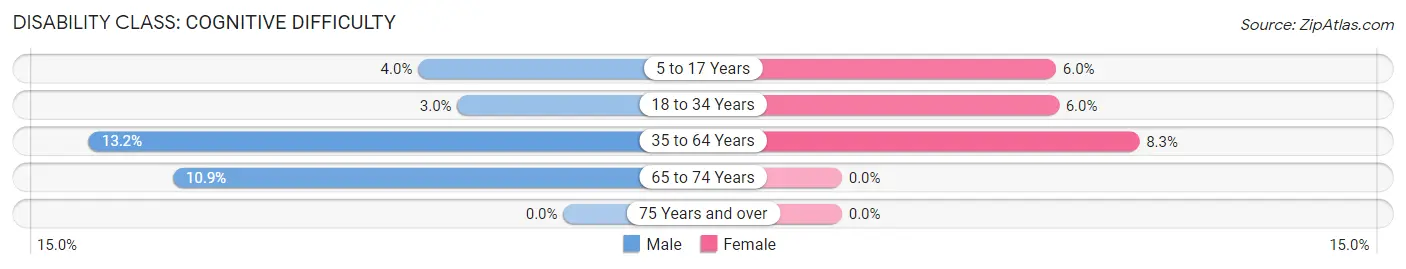
| Age Bracket | Male | Female |
| 5 to 17 Years | 19 (4.0%) | 18 (6.0%) |
| 18 to 34 Years | 18 (2.9%) | 38 (6.0%) |
| 35 to 64 Years | 128 (13.2%) | 80 (8.3%) |
| 65 to 74 Years | 25 (10.9%) | 0 (0.0%) |
| 75 Years and over | 0 (0.0%) | 0 (0.0%) |
Disability Class: Ambulatory Difficulty
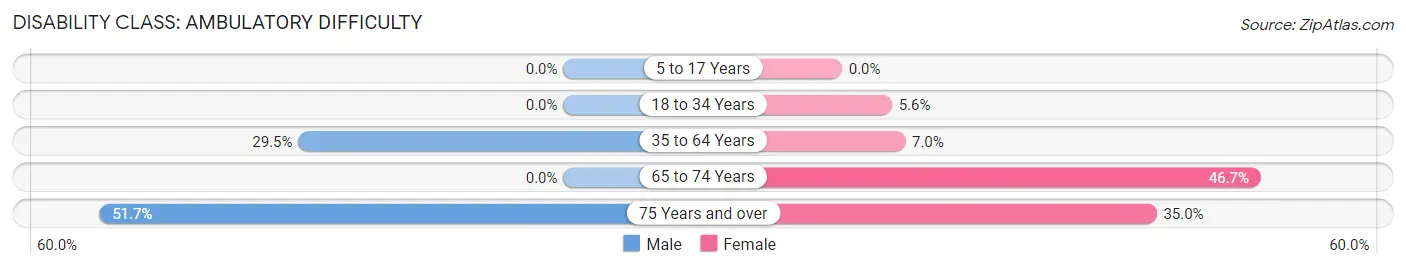
| Age Bracket | Male | Female |
| 5 to 17 Years | 0 (0.0%) | 0 (0.0%) |
| 18 to 34 Years | 0 (0.0%) | 35 (5.6%) |
| 35 to 64 Years | 286 (29.5%) | 68 (7.0%) |
| 65 to 74 Years | 0 (0.0%) | 119 (46.7%) |
| 75 Years and over | 46 (51.7%) | 82 (35.0%) |
Disability Class: Self-Care Difficulty
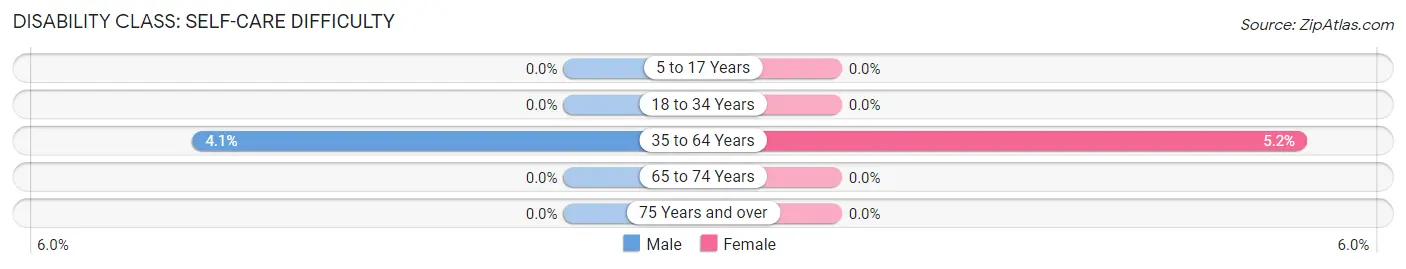
| Age Bracket | Male | Female |
| 5 to 17 Years | 0 (0.0%) | 0 (0.0%) |
| 18 to 34 Years | 0 (0.0%) | 0 (0.0%) |
| 35 to 64 Years | 40 (4.1%) | 50 (5.2%) |
| 65 to 74 Years | 0 (0.0%) | 0 (0.0%) |
| 75 Years and over | 0 (0.0%) | 0 (0.0%) |
Technology Access in Osceola
Computing Device Access in Osceola
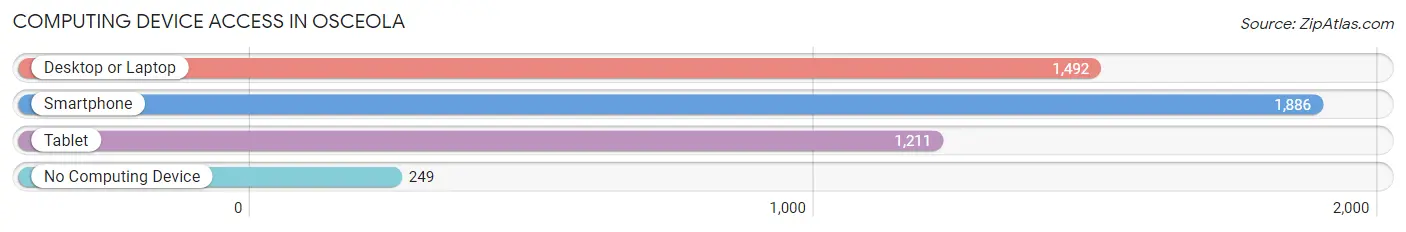
| Device Type | # Households | % Households |
| Desktop or Laptop | 1,492 | 64.9% |
| Smartphone | 1,886 | 82.0% |
| Tablet | 1,211 | 52.7% |
| No Computing Device | 249 | 10.8% |
| Total | 2,299 | 100.0% |
Internet Access in Osceola
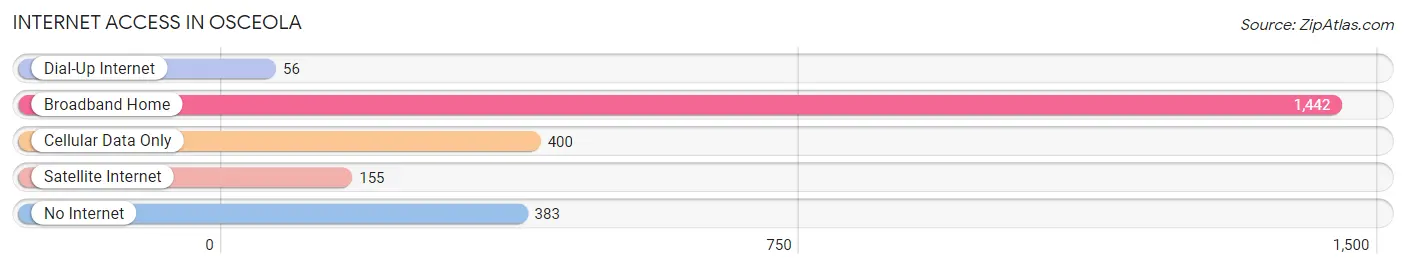
| Internet Type | # Households | % Households |
| Dial-Up Internet | 56 | 2.4% |
| Broadband Home | 1,442 | 62.7% |
| Cellular Data Only | 400 | 17.4% |
| Satellite Internet | 155 | 6.7% |
| No Internet | 383 | 16.7% |
| Total | 2,299 | 100.0% |
Osceola Summary
Osceola, Iowa is a small city located in Clarke County, Iowa, United States. It is the county seat of Clarke County and is located along the Middle River. The population of Osceola was 5,270 at the 2010 census, making it the largest city in Clarke County.
History
Osceola was founded in 1851 by a group of settlers from Ohio. The city was named after the Seminole leader Osceola, who was a leader of the Seminole tribe during the Second Seminole War. The city was incorporated in 1855 and was the first city in Clarke County.
Osceola was an important stop on the Chicago, Burlington and Quincy Railroad, which ran through the city. The railroad was a major factor in the growth of the city, as it allowed for the transportation of goods and people to and from the city.
In the late 19th century, Osceola was a major center for the production of agricultural products, such as corn, wheat, oats, and hay. The city was also home to several manufacturing companies, including a flour mill, a brickyard, and a furniture factory.
Geography
Osceola is located at 41°02'N 93°45'W (41.03, -93.75). The city is situated in the rolling hills of southern Iowa, and is located along the Middle River. The city has a total area of 4.2 square miles, all of which is land.
Economy
Osceola's economy is largely based on agriculture and manufacturing. The city is home to several manufacturing companies, including a flour mill, a brickyard, and a furniture factory. The city is also home to several agricultural businesses, including a dairy farm, a hog farm, and a grain elevator.
Osceola is also home to several retail businesses, including a grocery store, a hardware store, and a variety of restaurants. The city is also home to several medical facilities, including a hospital and a clinic.
Demographics
As of the 2010 census, the population of Osceola was 5,270. The racial makeup of the city was 95.2% White, 0.7% African American, 0.3% Native American, 0.7% Asian, 0.1% Pacific Islander, 1.3% from other races, and 1.7% from two or more races. Hispanic or Latino of any race were 3.2% of the population.
The median income for a household in Osceola was $41,944, and the median income for a family was $50,917. The per capita income for the city was $20,845. About 8.3% of families and 10.7% of the population were below the poverty line, including 14.2% of those under age 18 and 8.2% of those age 65 or over.
Common Questions
What is Per Capita Income in Osceola?
Per Capita income in Osceola is $28,635.
What is the Median Family Income in Osceola?
Median Family Income in Osceola is $66,594.
What is the Median Household income in Osceola?
Median Household Income in Osceola is $55,208.
What is Income or Wage Gap in Osceola?
Income or Wage Gap in Osceola is 31.4%.
Women in Osceola earn 68.6 cents for every dollar earned by a man.
What is Inequality or Gini Index in Osceola?
Inequality or Gini Index in Osceola is 0.47.
What is the Total Population of Osceola?
Total Population of Osceola is 5,455.
What is the Total Male Population of Osceola?
Total Male Population of Osceola is 2,801.
What is the Total Female Population of Osceola?
Total Female Population of Osceola is 2,654.
What is the Ratio of Males per 100 Females in Osceola?
There are 105.54 Males per 100 Females in Osceola.
What is the Ratio of Females per 100 Males in Osceola?
There are 94.75 Females per 100 Males in Osceola.
What is the Median Population Age in Osceola?
Median Population Age in Osceola is 36.6 Years.
What is the Average Family Size in Osceola
Average Family Size in Osceola is 2.8 People.
What is the Average Household Size in Osceola
Average Household Size in Osceola is 2.3 People.
How Large is the Labor Force in Osceola?
There are 2,854 People in the Labor Forcein in Osceola.
What is the Percentage of People in the Labor Force in Osceola?
66.0% of People are in the Labor Force in Osceola.
What is the Unemployment Rate in Osceola?
Unemployment Rate in Osceola is 5.8%.