Meservey, IA Map & Demographics
Meservey Map
Meservey Overview
$22,236
PER CAPITA INCOME
$66,875
AVG FAMILY INCOME
$56,250
AVG HOUSEHOLD INCOME
21.7%
WAGE / INCOME GAP [ % ]
78.3¢/ $1
WAGE / INCOME GAP [ $ ]
0.44
INEQUALITY / GINI INDEX
281
TOTAL POPULATION
134
MALE POPULATION
147
FEMALE POPULATION
91.16
MALES / 100 FEMALES
109.70
FEMALES / 100 MALES
30.3
MEDIAN AGE
3.6
AVG FAMILY SIZE
3.1
AVG HOUSEHOLD SIZE
105
LABOR FORCE [ PEOPLE ]
55.0%
PERCENT IN LABOR FORCE
1.0%
UNEMPLOYMENT RATE
Meservey Zip Codes
Meservey Area Codes
Income in Meservey
Income Overview in Meservey
Per Capita Income in Meservey is $22,236, while median incomes of families and households are $66,875 and $56,250 respectively.
| Characteristic | Number | Measure |
| Per Capita Income | 281 | $22,236 |
| Median Family Income | 65 | $66,875 |
| Mean Family Income | 65 | $72,028 |
| Median Household Income | 90 | $56,250 |
| Mean Household Income | 90 | $67,183 |
| Income Deficit | 65 | $0 |
| Wage / Income Gap (%) | 281 | 21.67% |
| Wage / Income Gap ($) | 281 | 78.33¢ per $1 |
| Gini / Inequality Index | 281 | 0.44 |
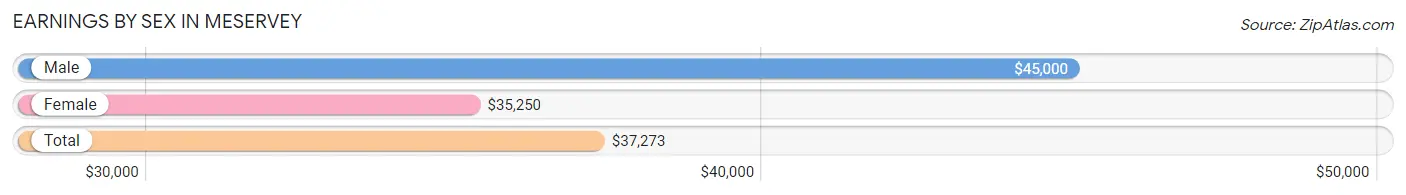
Earnings by Sex in Meservey
Average Earnings in Meservey are $37,273, $45,000 for men and $35,250 for women, a difference of 21.7%.
| Sex | Number | Average Earnings |
| Male | 56 (50.0%) | $45,000 |
| Female | 56 (50.0%) | $35,250 |
| Total | 112 (100.0%) | $37,273 |
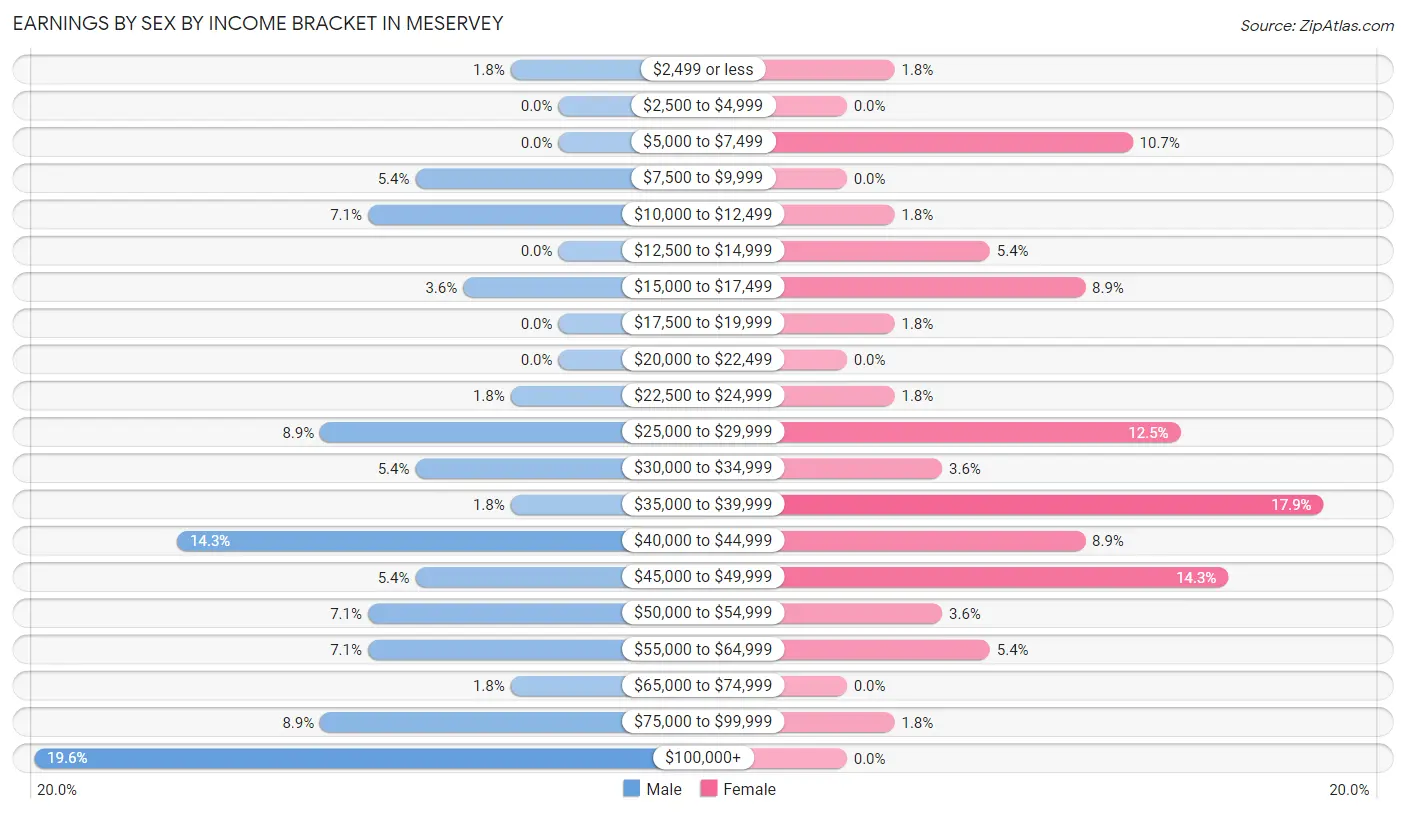
Earnings by Sex by Income Bracket in Meservey
The most common earnings brackets in Meservey are $100,000+ for men (11 | 19.6%) and $35,000 to $39,999 for women (10 | 17.9%).
| Income | Male | Female |
| $2,499 or less | 1 (1.8%) | 1 (1.8%) |
| $2,500 to $4,999 | 0 (0.0%) | 0 (0.0%) |
| $5,000 to $7,499 | 0 (0.0%) | 6 (10.7%) |
| $7,500 to $9,999 | 3 (5.4%) | 0 (0.0%) |
| $10,000 to $12,499 | 4 (7.1%) | 1 (1.8%) |
| $12,500 to $14,999 | 0 (0.0%) | 3 (5.4%) |
| $15,000 to $17,499 | 2 (3.6%) | 5 (8.9%) |
| $17,500 to $19,999 | 0 (0.0%) | 1 (1.8%) |
| $20,000 to $22,499 | 0 (0.0%) | 0 (0.0%) |
| $22,500 to $24,999 | 1 (1.8%) | 1 (1.8%) |
| $25,000 to $29,999 | 5 (8.9%) | 7 (12.5%) |
| $30,000 to $34,999 | 3 (5.4%) | 2 (3.6%) |
| $35,000 to $39,999 | 1 (1.8%) | 10 (17.9%) |
| $40,000 to $44,999 | 8 (14.3%) | 5 (8.9%) |
| $45,000 to $49,999 | 3 (5.4%) | 8 (14.3%) |
| $50,000 to $54,999 | 4 (7.1%) | 2 (3.6%) |
| $55,000 to $64,999 | 4 (7.1%) | 3 (5.4%) |
| $65,000 to $74,999 | 1 (1.8%) | 0 (0.0%) |
| $75,000 to $99,999 | 5 (8.9%) | 1 (1.8%) |
| $100,000+ | 11 (19.6%) | 0 (0.0%) |
| Total | 56 (100.0%) | 56 (100.0%) |
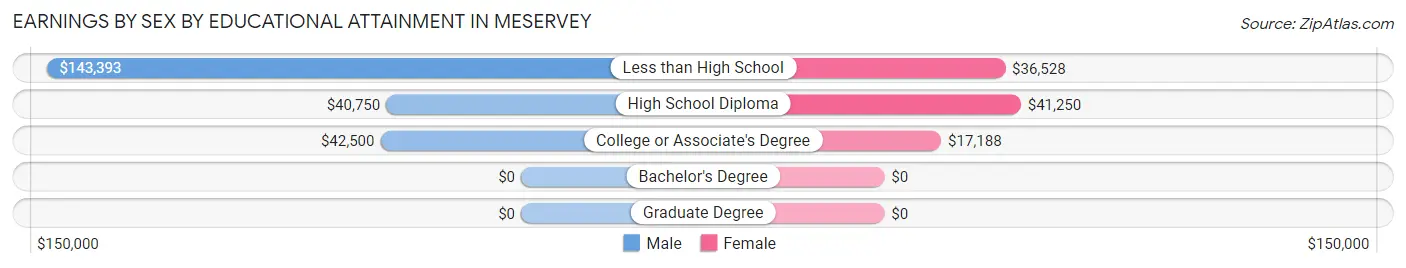
Earnings by Sex by Educational Attainment in Meservey
Average earnings in Meservey are $45,000 for men and $35,750 for women, a difference of 20.6%. Men with an educational attainment of less than high school enjoy the highest average annual earnings of $143,393, while those with high school diploma education earn the least with $40,750. Women with an educational attainment of high school diploma earn the most with the average annual earnings of $41,250, while those with college or associate's degree education have the smallest earnings of $17,188.
| Educational Attainment | Male Income | Female Income |
| Less than High School | $143,393 | $36,528 |
| High School Diploma | $40,750 | $41,250 |
| College or Associate's Degree | $42,500 | $17,188 |
| Bachelor's Degree | - | - |
| Graduate Degree | - | - |
| Total | $45,000 | $35,750 |
Family Income in Meservey
Family Income Brackets in Meservey
According to the Meservey family income data, there are 20 families falling into the $100,000 to $149,999 income range, which is the most common income bracket and makes up 30.8% of all families.
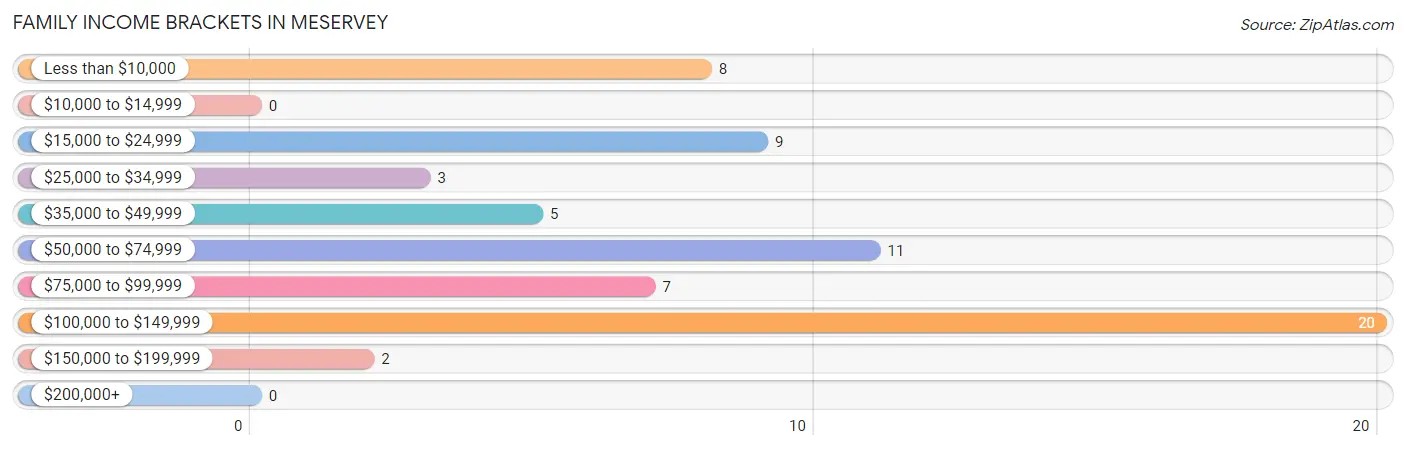
| Income Bracket | # Families | % Families |
| Less than $10,000 | 8 | 12.3% |
| $10,000 to $14,999 | 0 | 0.0% |
| $15,000 to $24,999 | 9 | 13.8% |
| $25,000 to $34,999 | 3 | 4.6% |
| $35,000 to $49,999 | 5 | 7.7% |
| $50,000 to $74,999 | 11 | 16.9% |
| $75,000 to $99,999 | 7 | 10.8% |
| $100,000 to $149,999 | 20 | 30.8% |
| $150,000 to $199,999 | 2 | 3.1% |
| $200,000+ | 0 | 0.0% |
Family Income by Famaliy Size in Meservey
4-person families (10 | 15.4%) account for the highest median family income in Meservey with $91,250 per family, while 2-person families (22 | 33.9%) have the highest median income of $26,875 per family member.
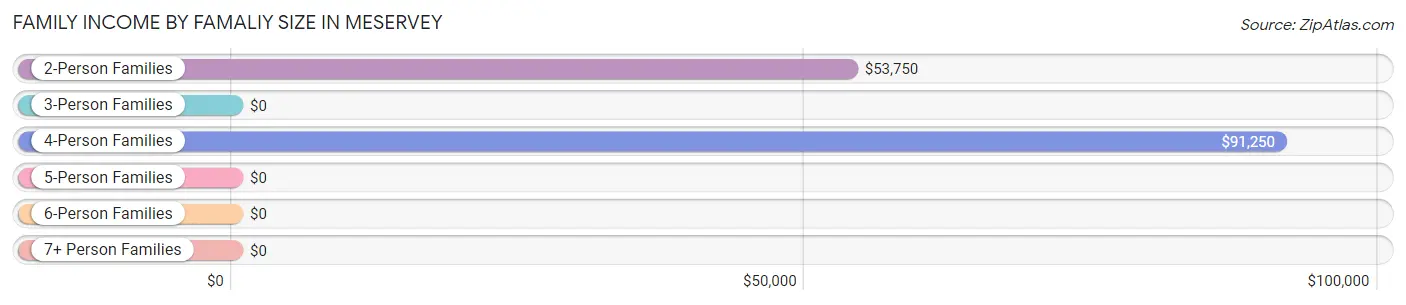
| Income Bracket | # Families | Median Income |
| 2-Person Families | 22 (33.9%) | $53,750 |
| 3-Person Families | 25 (38.5%) | $0 |
| 4-Person Families | 10 (15.4%) | $91,250 |
| 5-Person Families | 6 (9.2%) | $0 |
| 6-Person Families | 2 (3.1%) | $0 |
| 7+ Person Families | 0 (0.0%) | $0 |
| Total | 65 (100.0%) | $66,875 |
Family Income by Number of Earners in Meservey
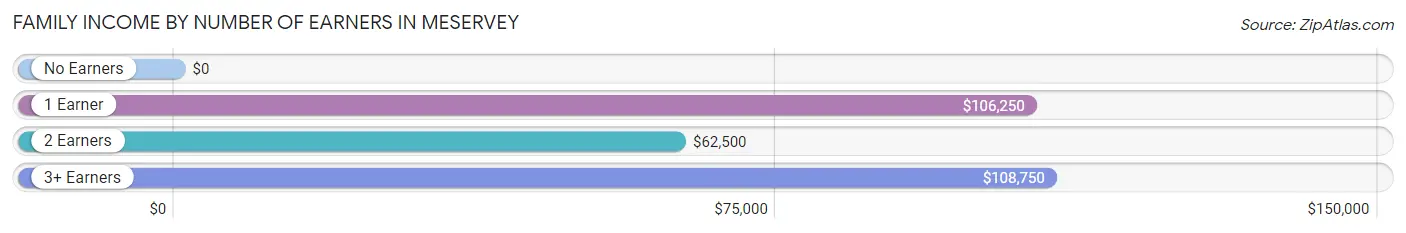
| Number of Earners | # Families | Median Income |
| No Earners | 19 (29.2%) | $0 |
| 1 Earner | 18 (27.7%) | $106,250 |
| 2 Earners | 22 (33.9%) | $62,500 |
| 3+ Earners | 6 (9.2%) | $108,750 |
| Total | 65 (100.0%) | $66,875 |
Household Income in Meservey
Household Income Brackets in Meservey
With 15 households falling in the category, the $15,000 to $24,999 income range is the most frequent in Meservey, accounting for 16.7% of all households.
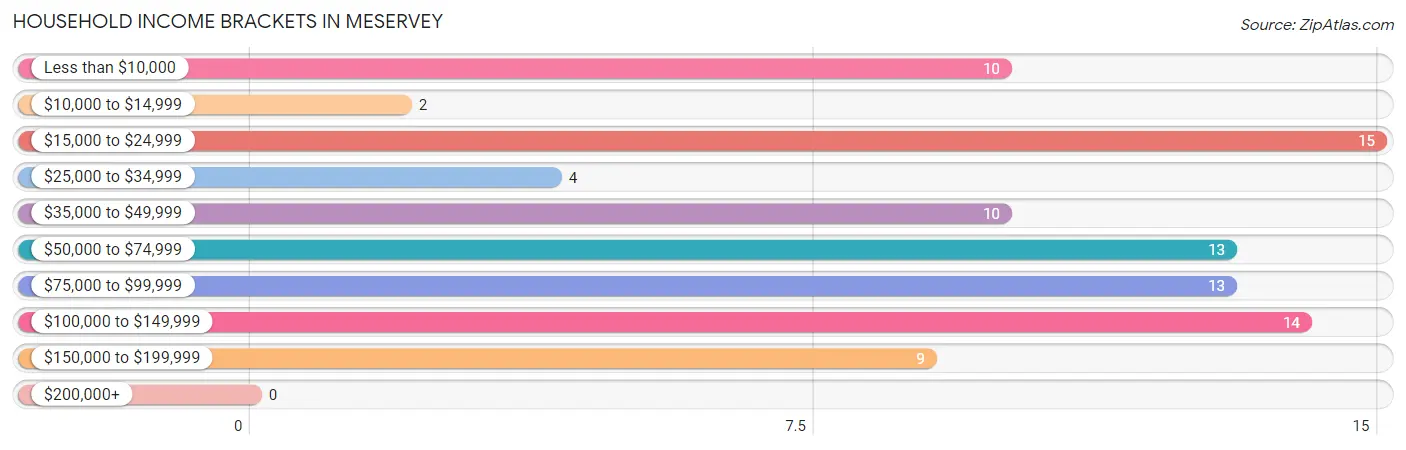
| Income Bracket | # Households | % Households |
| Less than $10,000 | 10 | 11.1% |
| $10,000 to $14,999 | 2 | 2.2% |
| $15,000 to $24,999 | 15 | 16.7% |
| $25,000 to $34,999 | 4 | 4.4% |
| $35,000 to $49,999 | 10 | 11.1% |
| $50,000 to $74,999 | 13 | 14.4% |
| $75,000 to $99,999 | 13 | 14.4% |
| $100,000 to $149,999 | 14 | 15.6% |
| $150,000 to $199,999 | 9 | 10.0% |
| $200,000+ | 0 | 0.0% |
Household Income by Householder Age in Meservey
The median household income in Meservey is $56,250, with the highest median household income of $91,250 found in the 45 to 64 years age bracket for the primary householder. A total of 27 households (30.0%) fall into this category. Meanwhile, the 15 to 24 years age bracket for the primary householder has the lowest median household income of $0, with 2 households (2.2%) in this group.
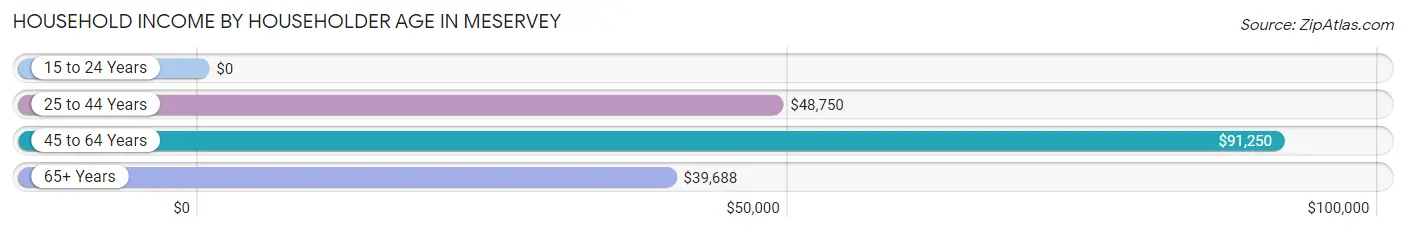
| Income Bracket | # Households | Median Income |
| 15 to 24 Years | 2 (2.2%) | $0 |
| 25 to 44 Years | 36 (40.0%) | $48,750 |
| 45 to 64 Years | 27 (30.0%) | $91,250 |
| 65+ Years | 25 (27.8%) | $39,688 |
| Total | 90 (100.0%) | $56,250 |
Poverty in Meservey
Income Below Poverty by Sex and Age in Meservey
With 33.6% poverty level for males and 29.9% for females among the residents of Meservey, 6 to 11 year old males and under 5 year old females are the most vulnerable to poverty, with 31 males (86.1%) and 15 females (75.0%) in their respective age groups living below the poverty level.
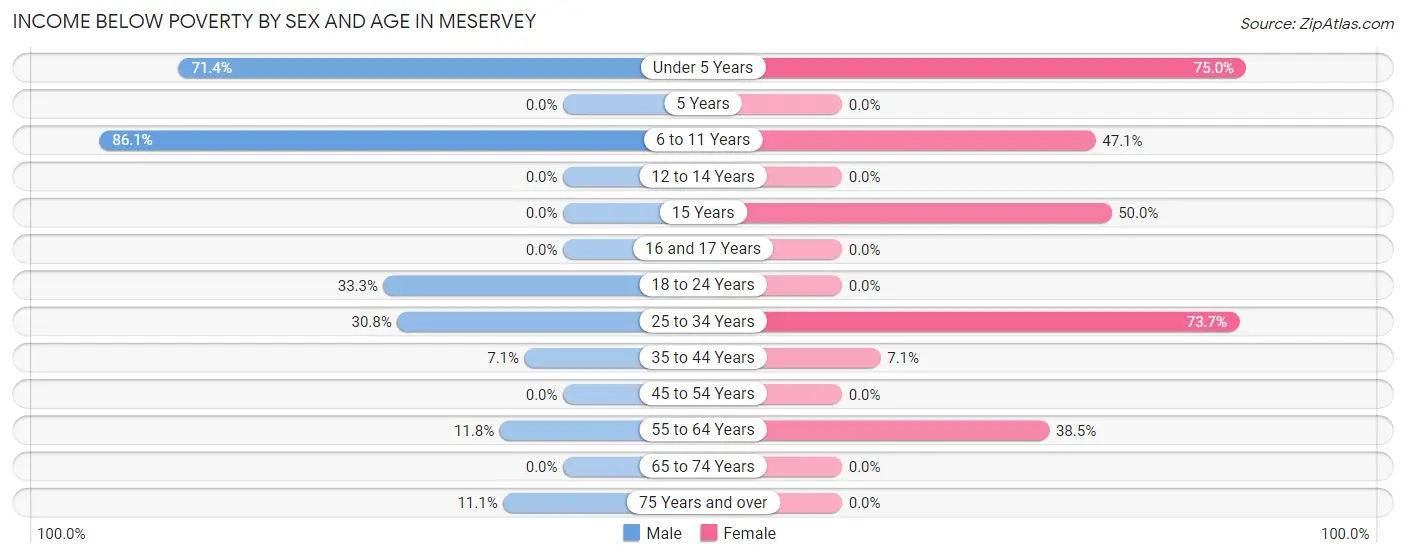
| Age Bracket | Male | Female |
| Under 5 Years | 5 (71.4%) | 15 (75.0%) |
| 5 Years | 0 (0.0%) | 0 (0.0%) |
| 6 to 11 Years | 31 (86.1%) | 8 (47.1%) |
| 12 to 14 Years | 0 (0.0%) | 0 (0.0%) |
| 15 Years | 0 (0.0%) | 1 (50.0%) |
| 16 and 17 Years | 0 (0.0%) | 0 (0.0%) |
| 18 to 24 Years | 1 (33.3%) | 0 (0.0%) |
| 25 to 34 Years | 4 (30.8%) | 14 (73.7%) |
| 35 to 44 Years | 1 (7.1%) | 1 (7.1%) |
| 45 to 54 Years | 0 (0.0%) | 0 (0.0%) |
| 55 to 64 Years | 2 (11.8%) | 5 (38.5%) |
| 65 to 74 Years | 0 (0.0%) | 0 (0.0%) |
| 75 Years and over | 1 (11.1%) | 0 (0.0%) |
| Total | 45 (33.6%) | 44 (29.9%) |
Income Above Poverty by Sex and Age in Meservey
According to the poverty statistics in Meservey, males aged 15 years and females aged 5 years are the age groups that are most secure financially, with 100.0% of males and 100.0% of females in these age groups living above the poverty line.
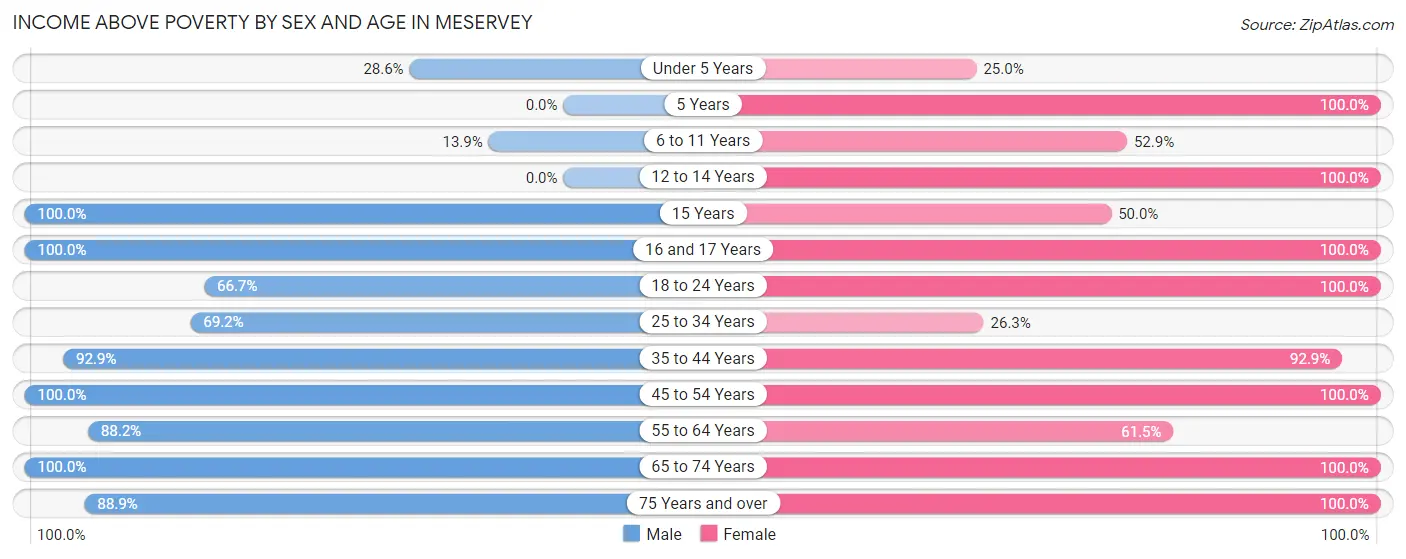
| Age Bracket | Male | Female |
| Under 5 Years | 2 (28.6%) | 5 (25.0%) |
| 5 Years | 0 (0.0%) | 3 (100.0%) |
| 6 to 11 Years | 5 (13.9%) | 9 (52.9%) |
| 12 to 14 Years | 0 (0.0%) | 4 (100.0%) |
| 15 Years | 1 (100.0%) | 1 (50.0%) |
| 16 and 17 Years | 15 (100.0%) | 12 (100.0%) |
| 18 to 24 Years | 2 (66.7%) | 8 (100.0%) |
| 25 to 34 Years | 9 (69.2%) | 5 (26.3%) |
| 35 to 44 Years | 13 (92.9%) | 13 (92.9%) |
| 45 to 54 Years | 9 (100.0%) | 16 (100.0%) |
| 55 to 64 Years | 15 (88.2%) | 8 (61.5%) |
| 65 to 74 Years | 10 (100.0%) | 15 (100.0%) |
| 75 Years and over | 8 (88.9%) | 4 (100.0%) |
| Total | 89 (66.4%) | 103 (70.1%) |
Income Below Poverty Among Married-Couple Families in Meservey
The poverty statistics for married-couple families in Meservey show that 14.0% or 6 of the total 43 families live below the poverty line. Families with 3 or 4 children have the highest poverty rate of 50.0%, comprising of 2 families. On the other hand, families with no children have the lowest poverty rate of 0.0%, which includes 0 families.
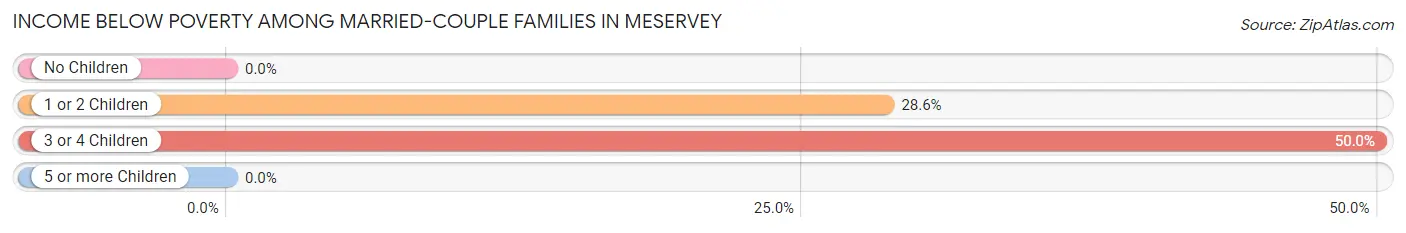
| Children | Above Poverty | Below Poverty |
| No Children | 25 (100.0%) | 0 (0.0%) |
| 1 or 2 Children | 10 (71.4%) | 4 (28.6%) |
| 3 or 4 Children | 2 (50.0%) | 2 (50.0%) |
| 5 or more Children | 0 (0.0%) | 0 (0.0%) |
| Total | 37 (86.1%) | 6 (14.0%) |
Income Below Poverty Among Single-Parent Households in Meservey
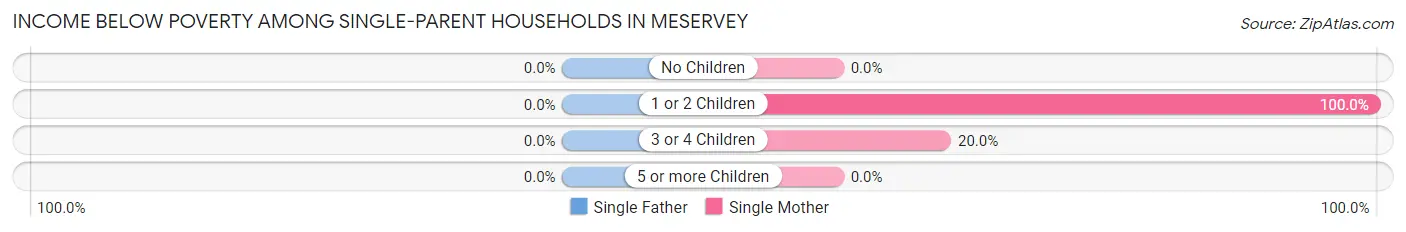
| Children | Single Father | Single Mother |
| No Children | 0 (0.0%) | 0 (0.0%) |
| 1 or 2 Children | 0 (0.0%) | 8 (100.0%) |
| 3 or 4 Children | 0 (0.0%) | 1 (20.0%) |
| 5 or more Children | 0 (0.0%) | 0 (0.0%) |
| Total | 0 (0.0%) | 9 (64.3%) |
Income Below Poverty Among Married-Couple vs Single-Parent Households in Meservey
The poverty data for Meservey shows that 6 of the married-couple family households (14.0%) and 9 of the single-parent households (40.9%) are living below the poverty level. Within the married-couple family households, those with 3 or 4 children have the highest poverty rate, with 2 households (50.0%) falling below the poverty line. Among the single-parent households, those with 1 or 2 children have the highest poverty rate, with 8 household (53.3%) living below poverty.
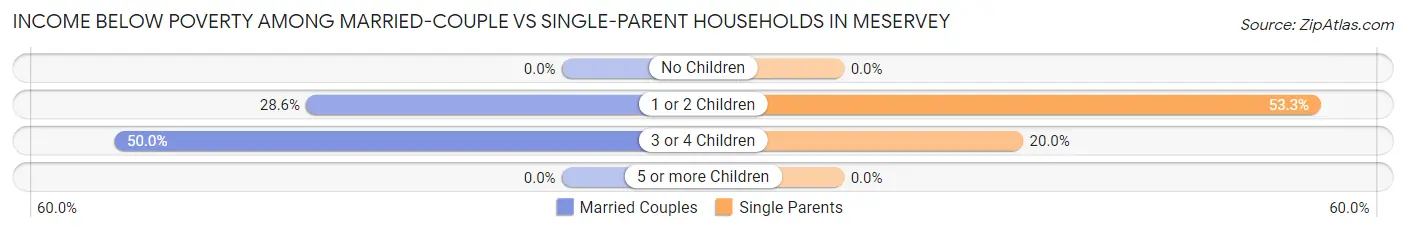
| Children | Married-Couple Families | Single-Parent Households |
| No Children | 0 (0.0%) | 0 (0.0%) |
| 1 or 2 Children | 4 (28.6%) | 8 (53.3%) |
| 3 or 4 Children | 2 (50.0%) | 1 (20.0%) |
| 5 or more Children | 0 (0.0%) | 0 (0.0%) |
| Total | 6 (14.0%) | 9 (40.9%) |
Race in Meservey
The most populous races in Meservey are White / Caucasian (206 | 73.3%), Two or more Races (70 | 24.9%), and Hispanic or Latino (55 | 19.6%).
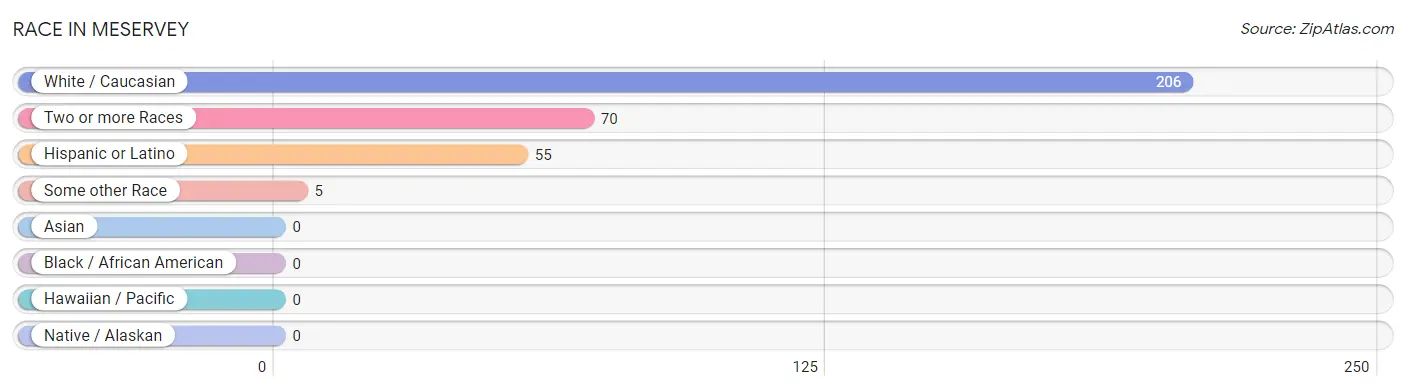
| Race | # Population | % Population |
| Asian | 0 | 0.0% |
| Black / African American | 0 | 0.0% |
| Hawaiian / Pacific | 0 | 0.0% |
| Hispanic or Latino | 55 | 19.6% |
| Native / Alaskan | 0 | 0.0% |
| White / Caucasian | 206 | 73.3% |
| Two or more Races | 70 | 24.9% |
| Some other Race | 5 | 1.8% |
| Total | 281 | 100.0% |
Ancestry in Meservey
The most populous ancestries reported in Meservey are German (66 | 23.5%), Mexican (54 | 19.2%), Norwegian (12 | 4.3%), Irish (11 | 3.9%), and English (8 | 2.9%), together accounting for 53.7% of all Meservey residents.
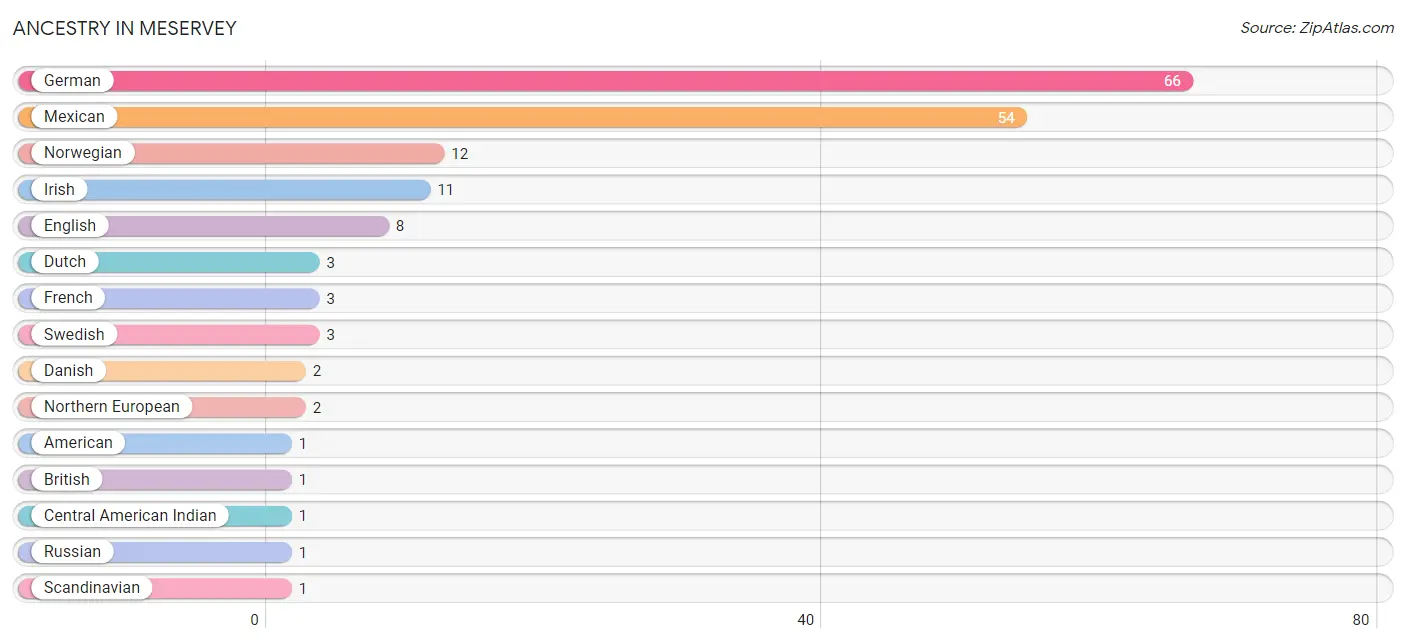
| Ancestry | # Population | % Population |
| American | 1 | 0.4% |
| British | 1 | 0.4% |
| Central American Indian | 1 | 0.4% |
| Danish | 2 | 0.7% |
| Dutch | 3 | 1.1% |
| English | 8 | 2.9% |
| French | 3 | 1.1% |
| German | 66 | 23.5% |
| Irish | 11 | 3.9% |
| Mexican | 54 | 19.2% |
| Northern European | 2 | 0.7% |
| Norwegian | 12 | 4.3% |
| Russian | 1 | 0.4% |
| Scandinavian | 1 | 0.4% |
| Scotch-Irish | 1 | 0.4% |
| Swedish | 3 | 1.1% |
| Swiss | 1 | 0.4% | View All 17 Rows |
Immigrants in Meservey
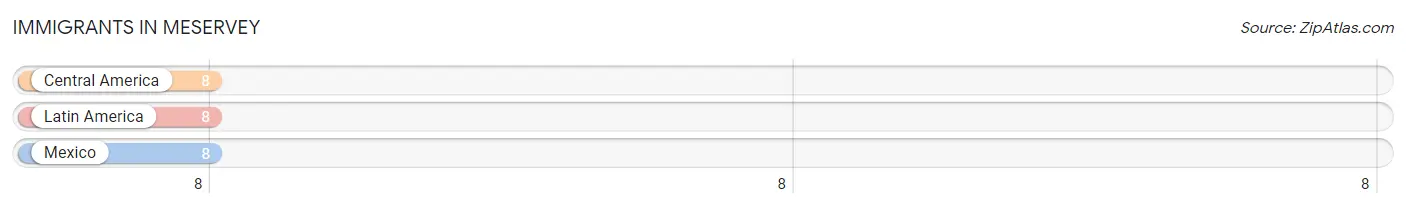
The most numerous immigrant groups reported in Meservey came from Central America (8 | 2.9%), Latin America (8 | 2.9%), and Mexico (8 | 2.9%), together accounting for 8.6% of all Meservey residents.
| Immigration Origin | # Population | % Population |
| Central America | 8 | 2.9% |
| Latin America | 8 | 2.9% |
| Mexico | 8 | 2.9% | View All 3 Rows |
Sex and Age in Meservey
Sex and Age in Meservey
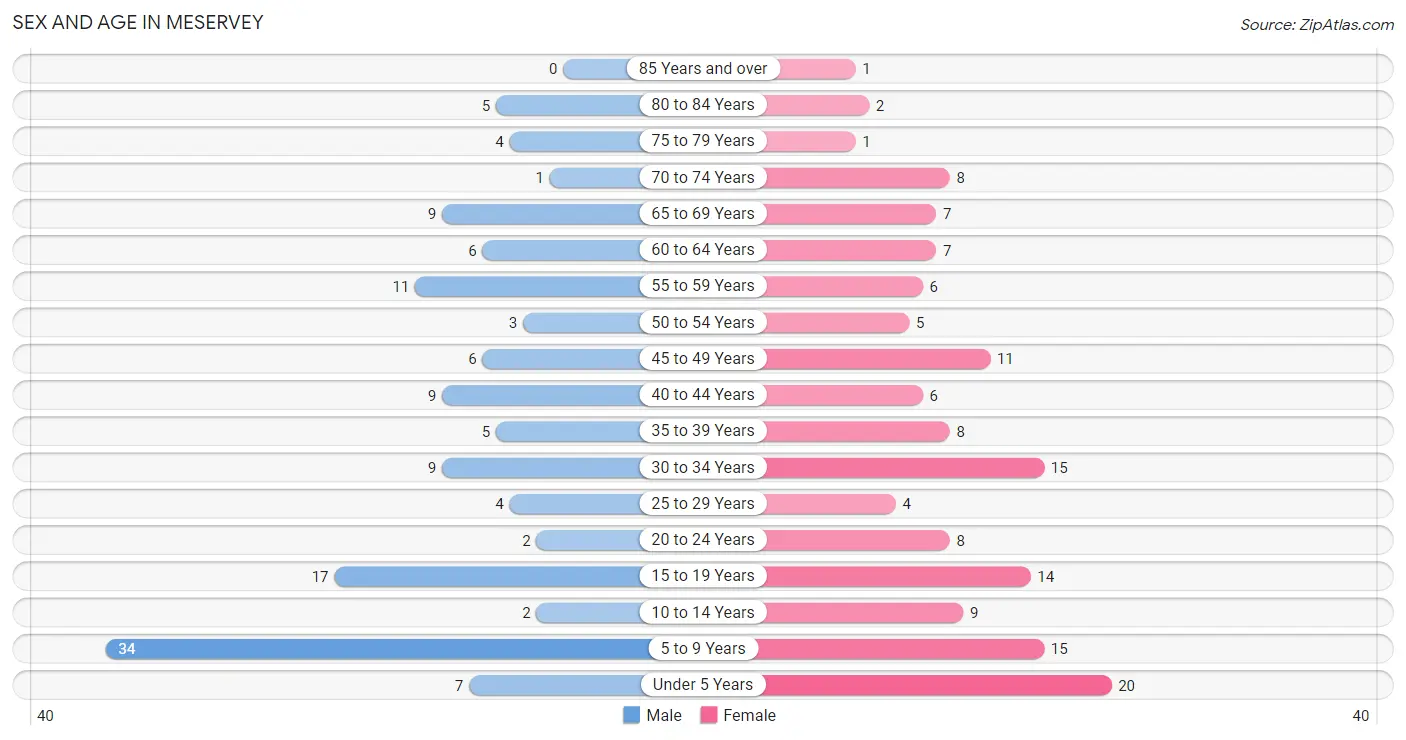
The most populous age groups in Meservey are 5 to 9 Years (34 | 25.4%) for men and Under 5 Years (20 | 13.6%) for women.
| Age Bracket | Male | Female |
| Under 5 Years | 7 (5.2%) | 20 (13.6%) |
| 5 to 9 Years | 34 (25.4%) | 15 (10.2%) |
| 10 to 14 Years | 2 (1.5%) | 9 (6.1%) |
| 15 to 19 Years | 17 (12.7%) | 14 (9.5%) |
| 20 to 24 Years | 2 (1.5%) | 8 (5.4%) |
| 25 to 29 Years | 4 (3.0%) | 4 (2.7%) |
| 30 to 34 Years | 9 (6.7%) | 15 (10.2%) |
| 35 to 39 Years | 5 (3.7%) | 8 (5.4%) |
| 40 to 44 Years | 9 (6.7%) | 6 (4.1%) |
| 45 to 49 Years | 6 (4.5%) | 11 (7.5%) |
| 50 to 54 Years | 3 (2.2%) | 5 (3.4%) |
| 55 to 59 Years | 11 (8.2%) | 6 (4.1%) |
| 60 to 64 Years | 6 (4.5%) | 7 (4.8%) |
| 65 to 69 Years | 9 (6.7%) | 7 (4.8%) |
| 70 to 74 Years | 1 (0.7%) | 8 (5.4%) |
| 75 to 79 Years | 4 (3.0%) | 1 (0.7%) |
| 80 to 84 Years | 5 (3.7%) | 2 (1.4%) |
| 85 Years and over | 0 (0.0%) | 1 (0.7%) |
| Total | 134 (100.0%) | 147 (100.0%) |
Families and Households in Meservey
Median Family Size in Meservey
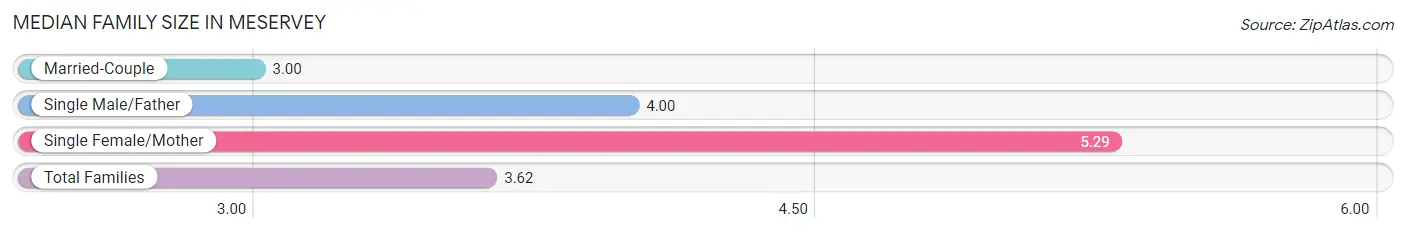
The median family size in Meservey is 3.62 persons per family, with single female/mother families (14 | 21.5%) accounting for the largest median family size of 5.29 persons per family. On the other hand, married-couple families (43 | 66.1%) represent the smallest median family size with 3.00 persons per family.
| Family Type | # Families | Family Size |
| Married-Couple | 43 (66.1%) | 3.00 |
| Single Male/Father | 8 (12.3%) | 4.00 |
| Single Female/Mother | 14 (21.5%) | 5.29 |
| Total Families | 65 (100.0%) | 3.62 |
Median Household Size in Meservey
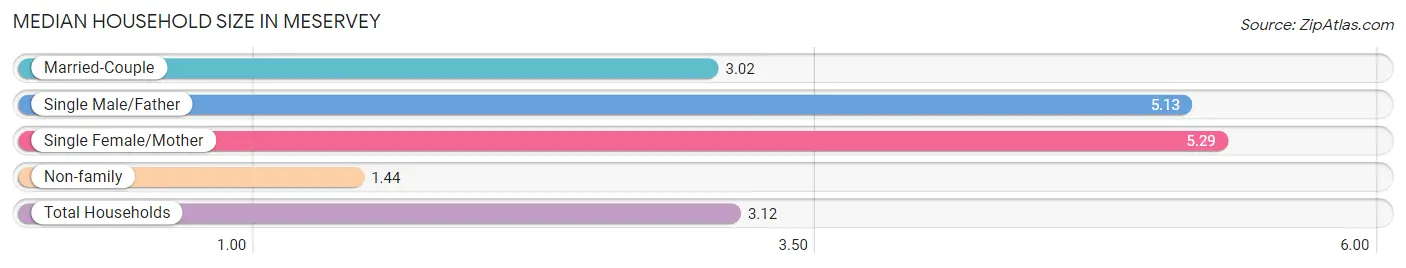
The median household size in Meservey is 3.12 persons per household, with single female/mother households (14 | 15.6%) accounting for the largest median household size of 5.29 persons per household. non-family households (25 | 27.8%) represent the smallest median household size with 1.44 persons per household.
| Household Type | # Households | Household Size |
| Married-Couple | 43 (47.8%) | 3.02 |
| Single Male/Father | 8 (8.9%) | 5.13 |
| Single Female/Mother | 14 (15.6%) | 5.29 |
| Non-family | 25 (27.8%) | 1.44 |
| Total Households | 90 (100.0%) | 3.12 |
Household Size by Marriage Status in Meservey
Out of a total of 90 households in Meservey, 65 (72.2%) are family households, while 25 (27.8%) are nonfamily households. The most numerous type of family households are 2-person households, comprising 22, and the most common type of nonfamily households are 1-person households, comprising 18.
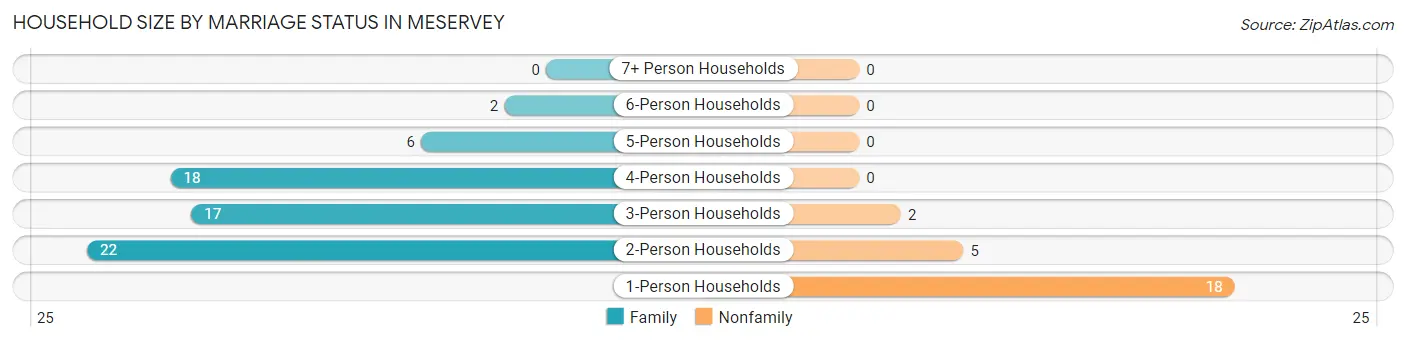
| Household Size | Family Households | Nonfamily Households |
| 1-Person Households | - | 18 (20.0%) |
| 2-Person Households | 22 (24.4%) | 5 (5.6%) |
| 3-Person Households | 17 (18.9%) | 2 (2.2%) |
| 4-Person Households | 18 (20.0%) | 0 (0.0%) |
| 5-Person Households | 6 (6.7%) | 0 (0.0%) |
| 6-Person Households | 2 (2.2%) | 0 (0.0%) |
| 7+ Person Households | 0 (0.0%) | 0 (0.0%) |
| Total | 65 (72.2%) | 25 (27.8%) |
Female Fertility in Meservey
Fertility by Age in Meservey
Average fertility rate in Meservey is 75.0 births per 1,000 women. Women in the age bracket of 20 to 34 years have the highest fertility rate with 185.0 births per 1,000 women. Women in the age bracket of 20 to 34 years acount for 100.0% of all women with births.
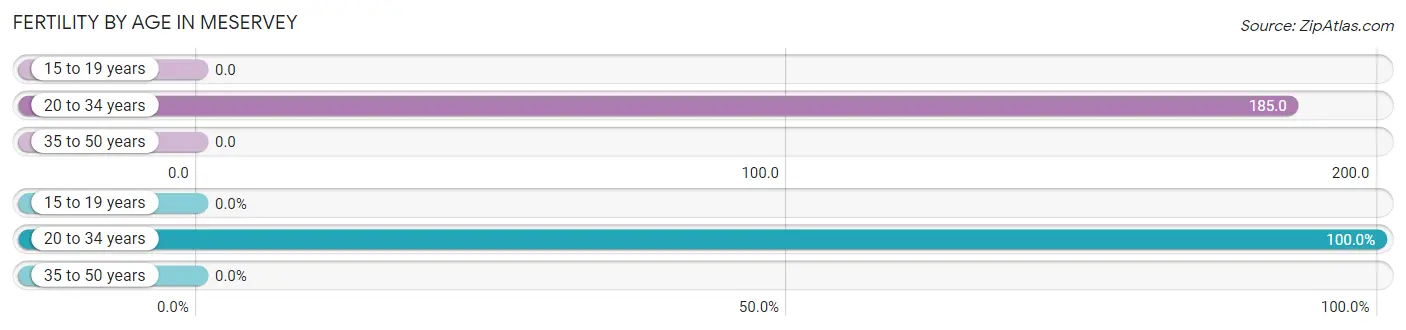
| Age Bracket | Women with Births | Births / 1,000 Women |
| 15 to 19 years | 0 (0.0%) | 0.0 |
| 20 to 34 years | 5 (100.0%) | 185.0 |
| 35 to 50 years | 0 (0.0%) | 0.0 |
| Total | 5 (100.0%) | 75.0 |
Fertility by Age by Marriage Status in Meservey
40.0% of women with births (5) in Meservey are married. The highest percentage of unmarried women with births falls into 20 to 34 years age bracket with 60.0% of them unmarried at the time of birth, while the lowest percentage of unmarried women with births belong to 20 to 34 years age bracket with 60.0% of them unmarried.
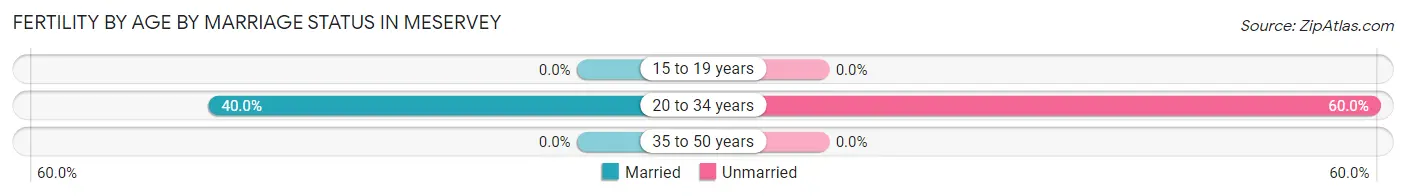
| Age Bracket | Married | Unmarried |
| 15 to 19 years | 0 (0.0%) | 0 (0.0%) |
| 20 to 34 years | 2 (40.0%) | 3 (60.0%) |
| 35 to 50 years | 0 (0.0%) | 0 (0.0%) |
| Total | 2 (40.0%) | 3 (60.0%) |
Fertility by Education in Meservey
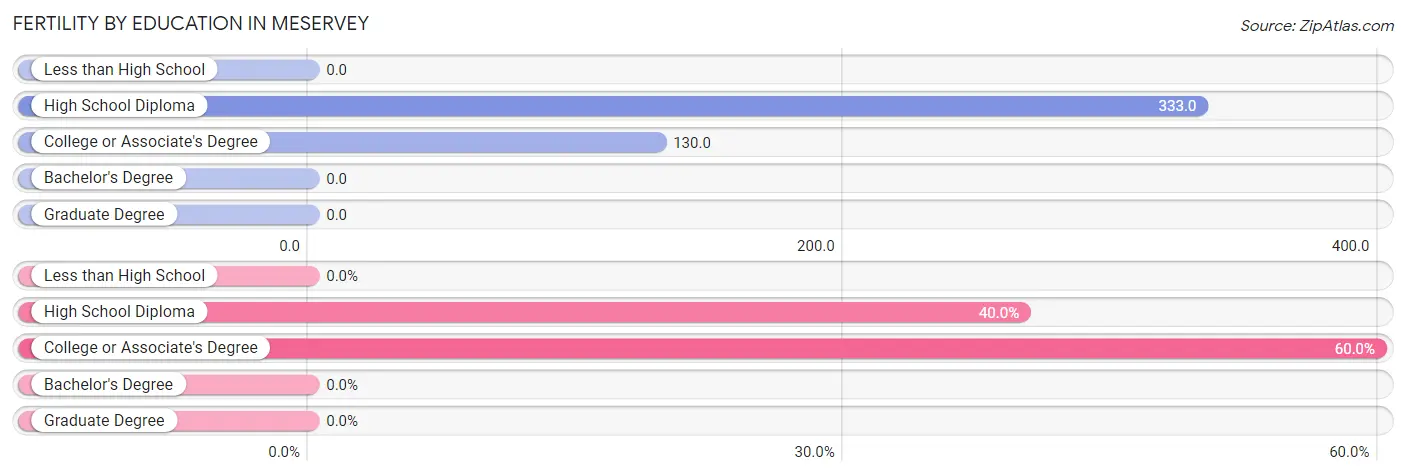
| Educational Attainment | Women with Births | Births / 1,000 Women |
| Less than High School | 0 (0.0%) | 0.0 |
| High School Diploma | 2 (40.0%) | 333.0 |
| College or Associate's Degree | 3 (60.0%) | 130.0 |
| Bachelor's Degree | 0 (0.0%) | 0.0 |
| Graduate Degree | 0 (0.0%) | 0.0 |
| Total | 5 (100.0%) | 75.0 |
Fertility by Education by Marriage Status in Meservey
60.0% of women with births in Meservey are unmarried. Women with the educational attainment of high school diploma are most likely to be married with 100.0% of them married at childbirth, while women with the educational attainment of college or associate's degree are least likely to be married with 100.0% of them unmarried at childbirth.
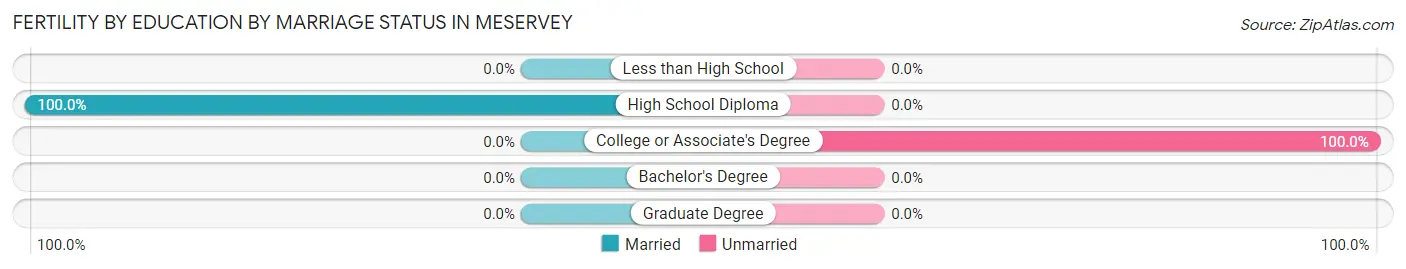
| Educational Attainment | Married | Unmarried |
| Less than High School | 0 (0.0%) | 0 (0.0%) |
| High School Diploma | 2 (100.0%) | 0 (0.0%) |
| College or Associate's Degree | 0 (0.0%) | 3 (100.0%) |
| Bachelor's Degree | 0 (0.0%) | 0 (0.0%) |
| Graduate Degree | 0 (0.0%) | 0 (0.0%) |
| Total | 2 (40.0%) | 3 (60.0%) |
Employment Characteristics in Meservey
Employment by Class of Employer in Meservey
Among the 103 employed individuals in Meservey, private company employees (84 | 81.6%), not-for-profit organizations (7 | 6.8%), and self-employed (not incorporated) (4 | 3.9%) make up the most common classes of employment.
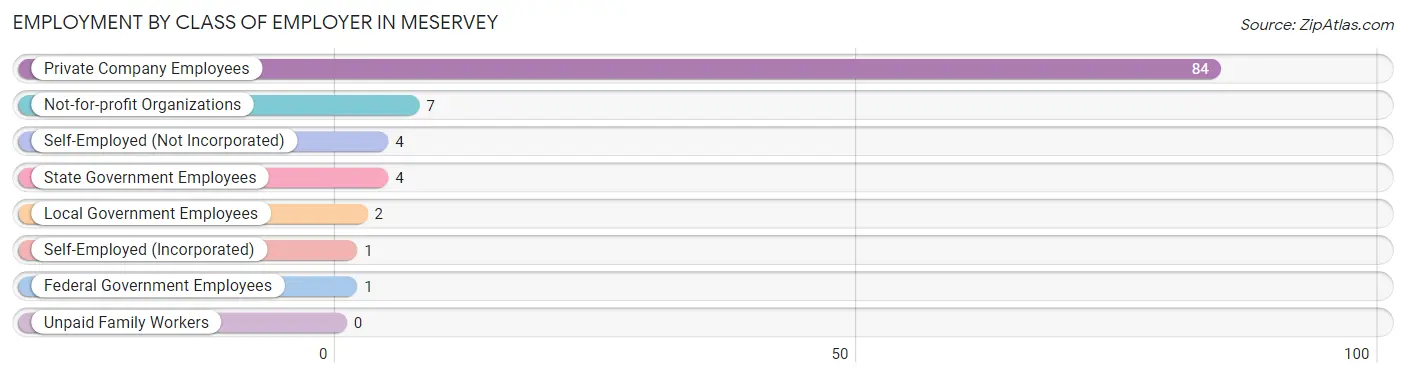
| Employer Class | # Employees | % Employees |
| Private Company Employees | 84 | 81.6% |
| Self-Employed (Incorporated) | 1 | 1.0% |
| Self-Employed (Not Incorporated) | 4 | 3.9% |
| Not-for-profit Organizations | 7 | 6.8% |
| Local Government Employees | 2 | 1.9% |
| State Government Employees | 4 | 3.9% |
| Federal Government Employees | 1 | 1.0% |
| Unpaid Family Workers | 0 | 0.0% |
| Total | 103 | 100.0% |
Employment Status by Age in Meservey
According to the labor force statistics for Meservey, out of the total population over 16 years of age (191), 55.0% or 105 individuals are in the labor force, with 1.0% or 1 of them unemployed. The age group with the highest labor force participation rate is 20 to 24 years, with 100.0% or 10 individuals in the labor force. Within the labor force, the 45 to 54 years age range has the highest percentage of unemployed individuals, with 4.2% or 1 of them being unemployed.
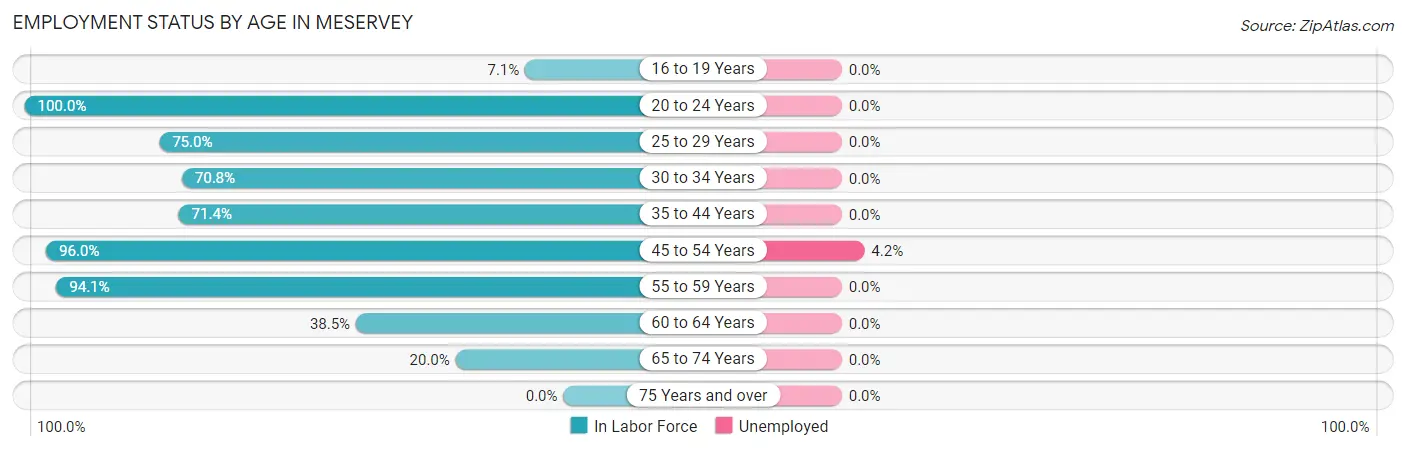
| Age Bracket | In Labor Force | Unemployed |
| 16 to 19 Years | 2 (7.1%) | 0 (0.0%) |
| 20 to 24 Years | 10 (100.0%) | 0 (0.0%) |
| 25 to 29 Years | 6 (75.0%) | 0 (0.0%) |
| 30 to 34 Years | 17 (70.8%) | 0 (0.0%) |
| 35 to 44 Years | 20 (71.4%) | 0 (0.0%) |
| 45 to 54 Years | 24 (96.0%) | 1 (4.2%) |
| 55 to 59 Years | 16 (94.1%) | 0 (0.0%) |
| 60 to 64 Years | 5 (38.5%) | 0 (0.0%) |
| 65 to 74 Years | 5 (20.0%) | 0 (0.0%) |
| 75 Years and over | 0 (0.0%) | 0 (0.0%) |
| Total | 105 (55.0%) | 1 (1.0%) |
Employment Status by Educational Attainment in Meservey
According to labor force statistics for Meservey, 76.5% of individuals (88) out of the total population between 25 and 64 years of age (115) are in the labor force, with 1.1% or 1 of them being unemployed. The group with the highest labor force participation rate are those with the educational attainment of college / associate degree, with 83.7% or 36 individuals in the labor force. Within the labor force, individuals with high school diploma education have the highest percentage of unemployment, with 4.3% or 1 of them being unemployed.
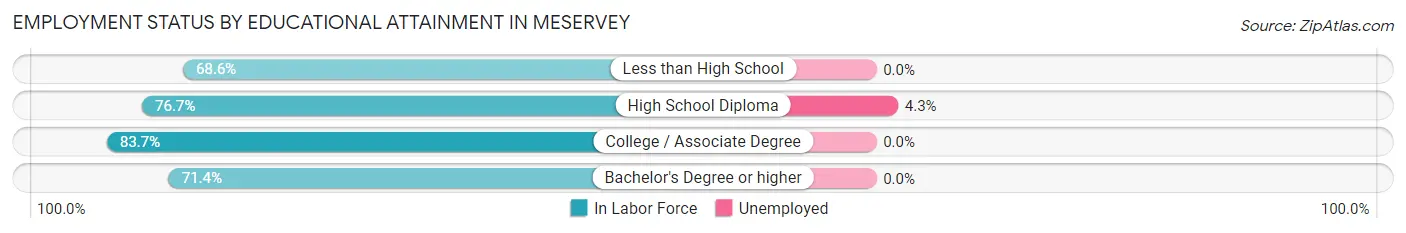
| Educational Attainment | In Labor Force | Unemployed |
| Less than High School | 24 (68.6%) | 0 (0.0%) |
| High School Diploma | 23 (76.7%) | 1 (4.3%) |
| College / Associate Degree | 36 (83.7%) | 0 (0.0%) |
| Bachelor's Degree or higher | 5 (71.4%) | 0 (0.0%) |
| Total | 88 (76.5%) | 1 (1.1%) |
Employment Occupations by Sex in Meservey
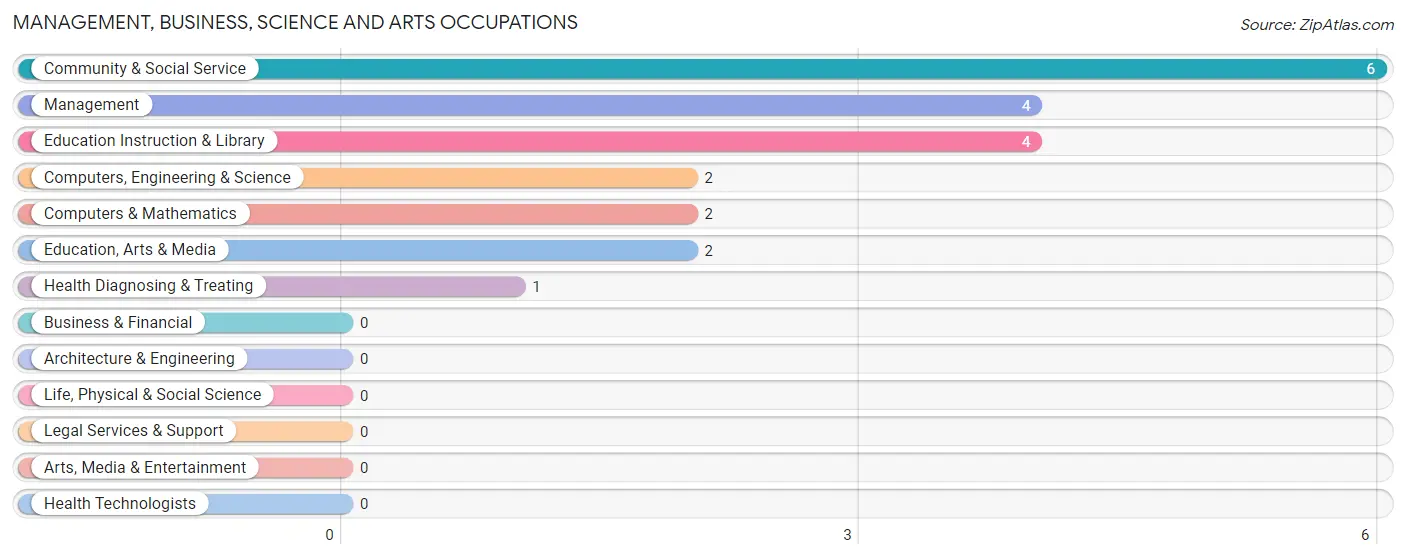
Management, Business, Science and Arts Occupations
The most common Management, Business, Science and Arts occupations in Meservey are Community & Social Service (6 | 5.8%), Management (4 | 3.8%), Education Instruction & Library (4 | 3.8%), Computers, Engineering & Science (2 | 1.9%), and Computers & Mathematics (2 | 1.9%).
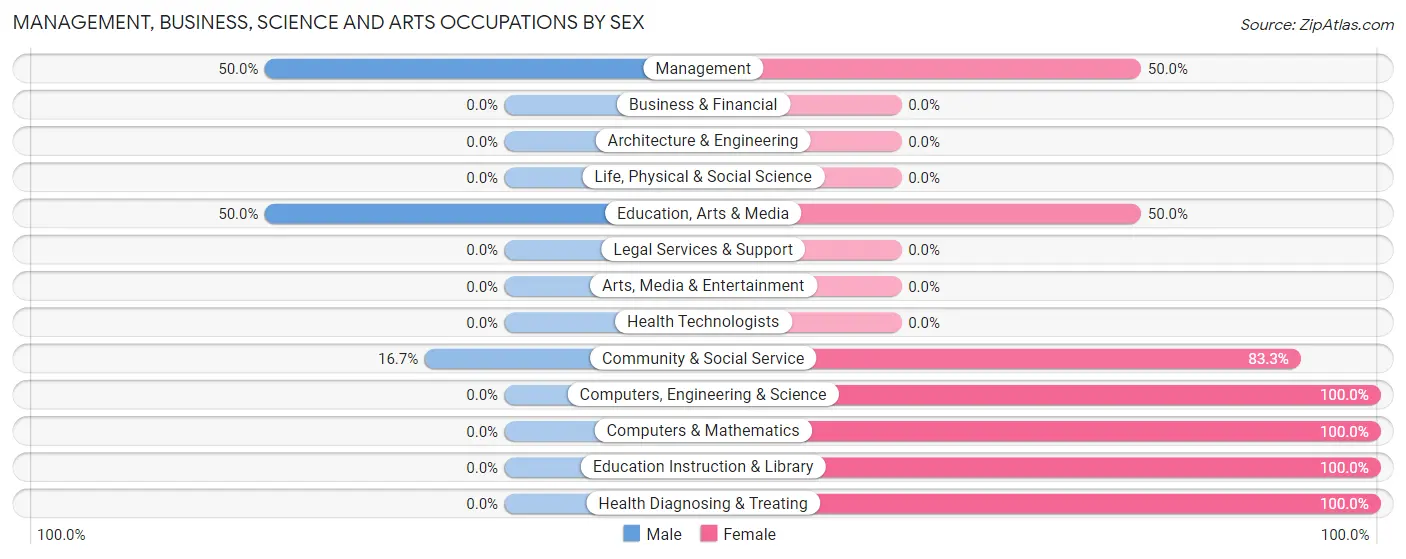
Management, Business, Science and Arts Occupations by Sex
Within the Management, Business, Science and Arts occupations in Meservey, the most male-oriented occupations are Management (50.0%), Education, Arts & Media (50.0%), and Community & Social Service (16.7%), while the most female-oriented occupations are Computers, Engineering & Science (100.0%), Computers & Mathematics (100.0%), and Education Instruction & Library (100.0%).
| Occupation | Male | Female |
| Management | 2 (50.0%) | 2 (50.0%) |
| Business & Financial | 0 (0.0%) | 0 (0.0%) |
| Computers, Engineering & Science | 0 (0.0%) | 2 (100.0%) |
| Computers & Mathematics | 0 (0.0%) | 2 (100.0%) |
| Architecture & Engineering | 0 (0.0%) | 0 (0.0%) |
| Life, Physical & Social Science | 0 (0.0%) | 0 (0.0%) |
| Community & Social Service | 1 (16.7%) | 5 (83.3%) |
| Education, Arts & Media | 1 (50.0%) | 1 (50.0%) |
| Legal Services & Support | 0 (0.0%) | 0 (0.0%) |
| Education Instruction & Library | 0 (0.0%) | 4 (100.0%) |
| Arts, Media & Entertainment | 0 (0.0%) | 0 (0.0%) |
| Health Diagnosing & Treating | 0 (0.0%) | 1 (100.0%) |
| Health Technologists | 0 (0.0%) | 0 (0.0%) |
| Total (Category) | 3 (23.1%) | 10 (76.9%) |
| Total (Overall) | 51 (49.0%) | 53 (51.0%) |
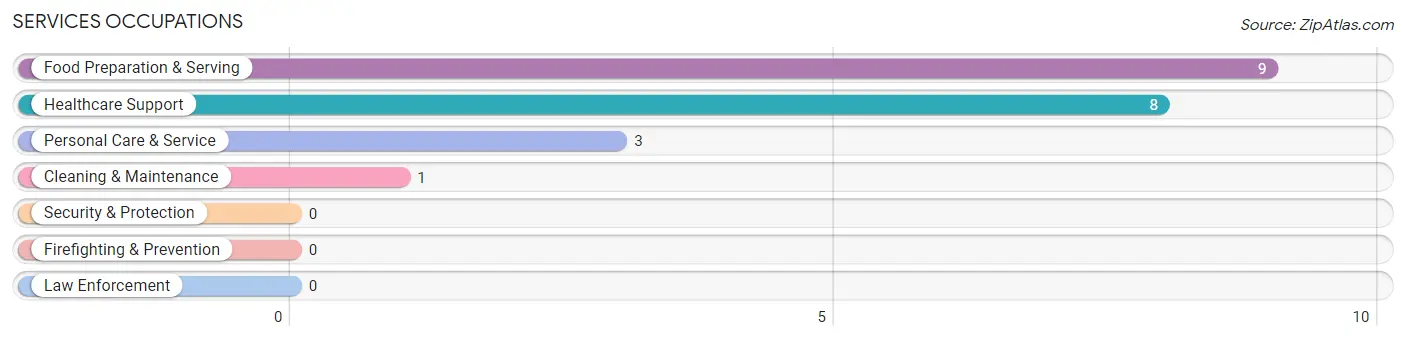
Services Occupations
The most common Services occupations in Meservey are Food Preparation & Serving (9 | 8.6%), Healthcare Support (8 | 7.7%), Personal Care & Service (3 | 2.9%), and Cleaning & Maintenance (1 | 1.0%).
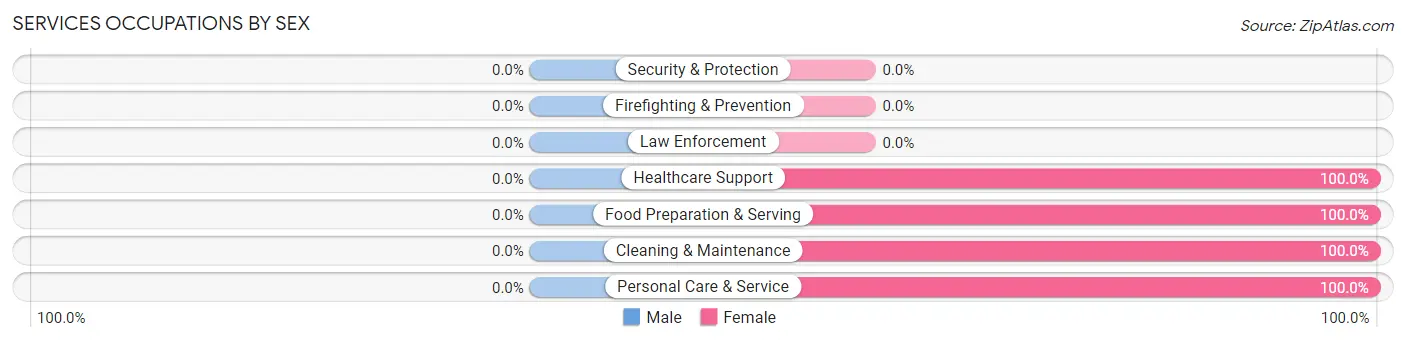
Services Occupations by Sex
| Occupation | Male | Female |
| Healthcare Support | 0 (0.0%) | 8 (100.0%) |
| Security & Protection | 0 (0.0%) | 0 (0.0%) |
| Firefighting & Prevention | 0 (0.0%) | 0 (0.0%) |
| Law Enforcement | 0 (0.0%) | 0 (0.0%) |
| Food Preparation & Serving | 0 (0.0%) | 9 (100.0%) |
| Cleaning & Maintenance | 0 (0.0%) | 1 (100.0%) |
| Personal Care & Service | 0 (0.0%) | 3 (100.0%) |
| Total (Category) | 0 (0.0%) | 21 (100.0%) |
| Total (Overall) | 51 (49.0%) | 53 (51.0%) |
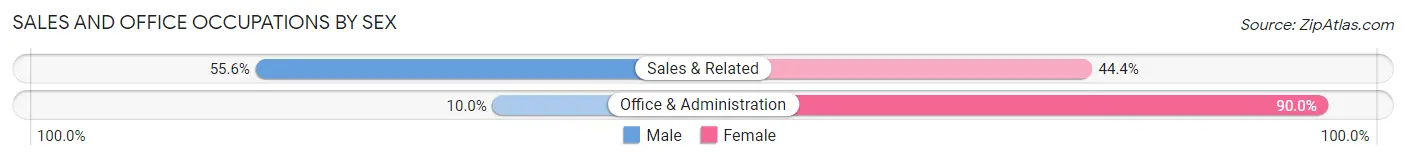
Sales and Office Occupations
The most common Sales and Office occupations in Meservey are Sales & Related (18 | 17.3%), and Office & Administration (10 | 9.6%).

Sales and Office Occupations by Sex
| Occupation | Male | Female |
| Sales & Related | 10 (55.6%) | 8 (44.4%) |
| Office & Administration | 1 (10.0%) | 9 (90.0%) |
| Total (Category) | 11 (39.3%) | 17 (60.7%) |
| Total (Overall) | 51 (49.0%) | 53 (51.0%) |
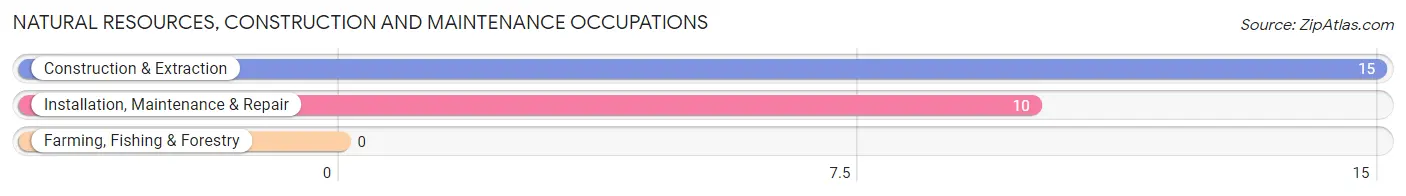
Natural Resources, Construction and Maintenance Occupations
The most common Natural Resources, Construction and Maintenance occupations in Meservey are Construction & Extraction (15 | 14.4%), and Installation, Maintenance & Repair (10 | 9.6%).
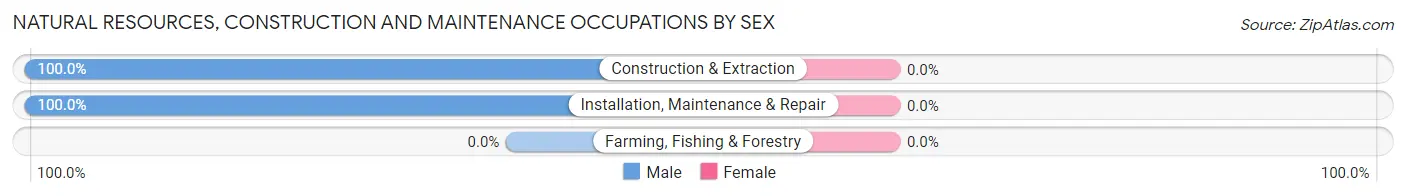
Natural Resources, Construction and Maintenance Occupations by Sex
| Occupation | Male | Female |
| Farming, Fishing & Forestry | 0 (0.0%) | 0 (0.0%) |
| Construction & Extraction | 15 (100.0%) | 0 (0.0%) |
| Installation, Maintenance & Repair | 10 (100.0%) | 0 (0.0%) |
| Total (Category) | 25 (100.0%) | 0 (0.0%) |
| Total (Overall) | 51 (49.0%) | 53 (51.0%) |
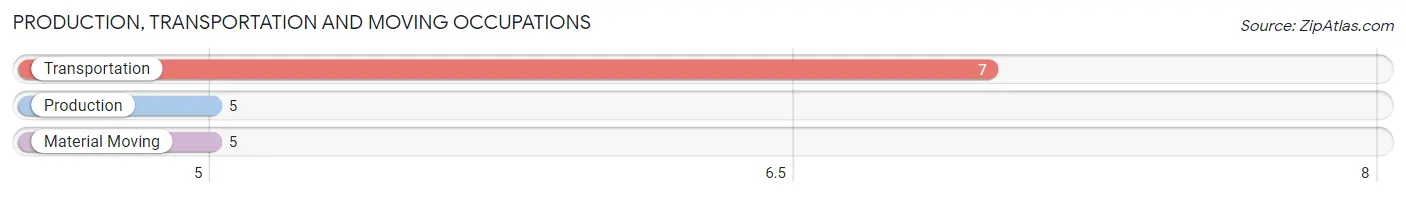
Production, Transportation and Moving Occupations
The most common Production, Transportation and Moving occupations in Meservey are Transportation (7 | 6.7%), Production (5 | 4.8%), and Material Moving (5 | 4.8%).
Production, Transportation and Moving Occupations by Sex
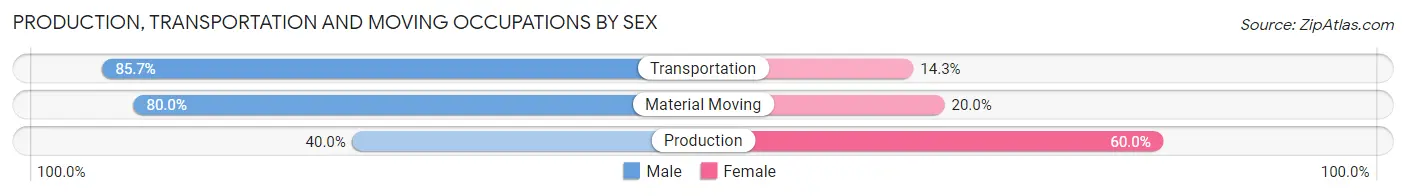
| Occupation | Male | Female |
| Production | 2 (40.0%) | 3 (60.0%) |
| Transportation | 6 (85.7%) | 1 (14.3%) |
| Material Moving | 4 (80.0%) | 1 (20.0%) |
| Total (Category) | 12 (70.6%) | 5 (29.4%) |
| Total (Overall) | 51 (49.0%) | 53 (51.0%) |
Employment Industries by Sex in Meservey
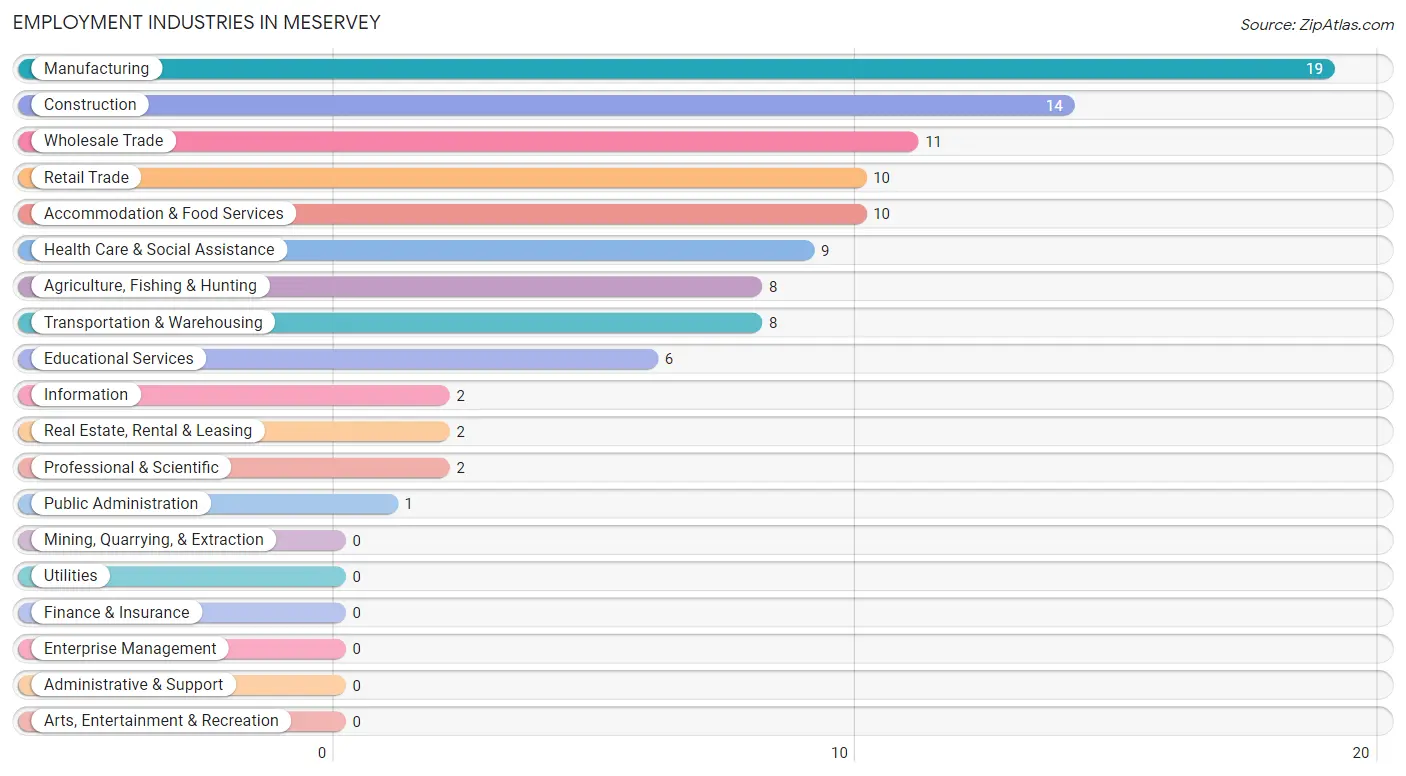
Employment Industries in Meservey
The major employment industries in Meservey include Manufacturing (19 | 18.3%), Construction (14 | 13.5%), Wholesale Trade (11 | 10.6%), Retail Trade (10 | 9.6%), and Accommodation & Food Services (10 | 9.6%).
Employment Industries by Sex in Meservey
The Meservey industries that see more men than women are Construction (100.0%), Information (100.0%), and Real Estate, Rental & Leasing (100.0%), whereas the industries that tend to have a higher number of women are Professional & Scientific (100.0%), Educational Services (100.0%), and Health Care & Social Assistance (100.0%).
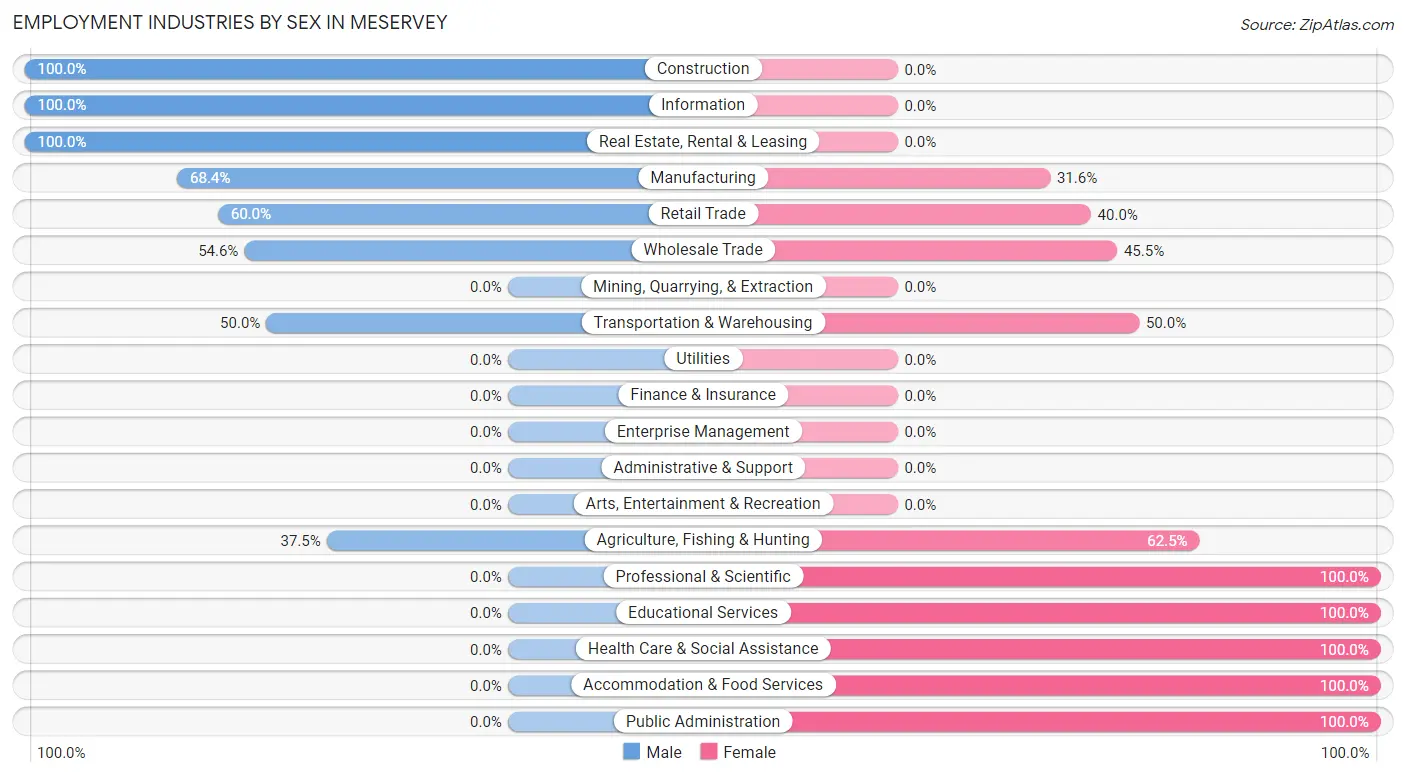
| Industry | Male | Female |
| Agriculture, Fishing & Hunting | 3 (37.5%) | 5 (62.5%) |
| Mining, Quarrying, & Extraction | 0 (0.0%) | 0 (0.0%) |
| Construction | 14 (100.0%) | 0 (0.0%) |
| Manufacturing | 13 (68.4%) | 6 (31.6%) |
| Wholesale Trade | 6 (54.5%) | 5 (45.5%) |
| Retail Trade | 6 (60.0%) | 4 (40.0%) |
| Transportation & Warehousing | 4 (50.0%) | 4 (50.0%) |
| Utilities | 0 (0.0%) | 0 (0.0%) |
| Information | 2 (100.0%) | 0 (0.0%) |
| Finance & Insurance | 0 (0.0%) | 0 (0.0%) |
| Real Estate, Rental & Leasing | 2 (100.0%) | 0 (0.0%) |
| Professional & Scientific | 0 (0.0%) | 2 (100.0%) |
| Enterprise Management | 0 (0.0%) | 0 (0.0%) |
| Administrative & Support | 0 (0.0%) | 0 (0.0%) |
| Educational Services | 0 (0.0%) | 6 (100.0%) |
| Health Care & Social Assistance | 0 (0.0%) | 9 (100.0%) |
| Arts, Entertainment & Recreation | 0 (0.0%) | 0 (0.0%) |
| Accommodation & Food Services | 0 (0.0%) | 10 (100.0%) |
| Public Administration | 0 (0.0%) | 1 (100.0%) |
| Total | 51 (49.0%) | 53 (51.0%) |
Education in Meservey
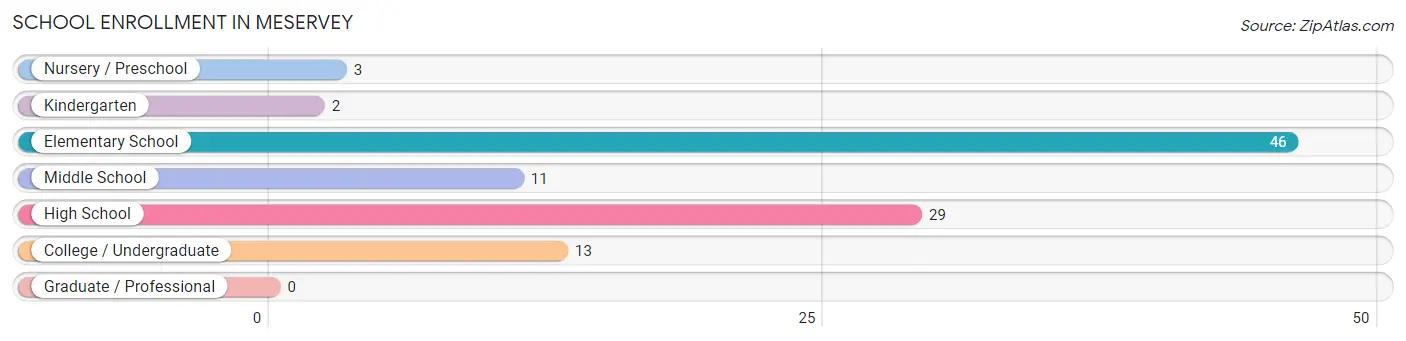
School Enrollment in Meservey
The most common levels of schooling among the 104 students in Meservey are elementary school (46 | 44.2%), high school (29 | 27.9%), and college / undergraduate (13 | 12.5%).
| School Level | # Students | % Students |
| Nursery / Preschool | 3 | 2.9% |
| Kindergarten | 2 | 1.9% |
| Elementary School | 46 | 44.2% |
| Middle School | 11 | 10.6% |
| High School | 29 | 27.9% |
| College / Undergraduate | 13 | 12.5% |
| Graduate / Professional | 0 | 0.0% |
| Total | 104 | 100.0% |
School Enrollment by Age by Funding Source in Meservey
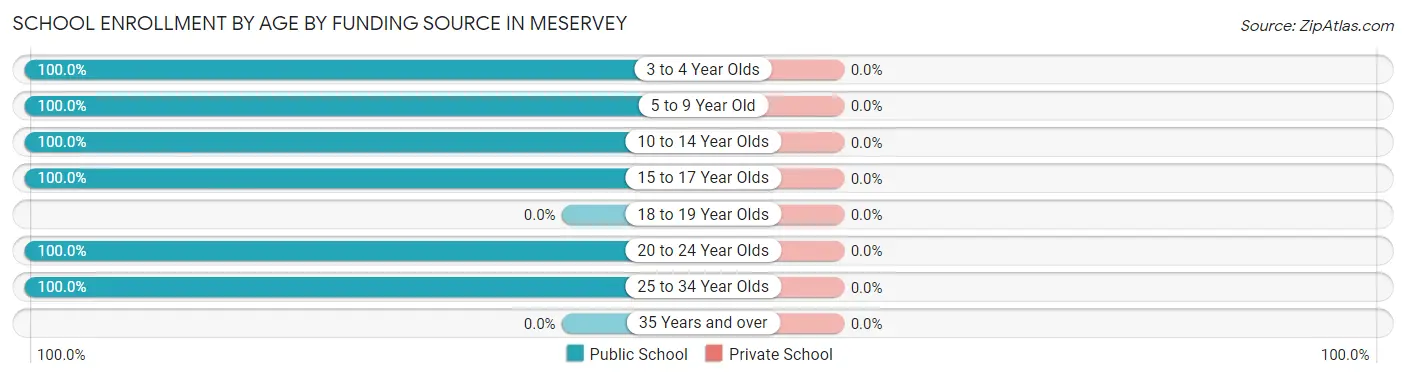
| Age Bracket | Public School | Private School |
| 3 to 4 Year Olds | 1 (100.0%) | 0 (0.0%) |
| 5 to 9 Year Old | 49 (100.0%) | 0 (0.0%) |
| 10 to 14 Year Olds | 11 (100.0%) | 0 (0.0%) |
| 15 to 17 Year Olds | 30 (100.0%) | 0 (0.0%) |
| 18 to 19 Year Olds | 0 (0.0%) | 0 (0.0%) |
| 20 to 24 Year Olds | 4 (100.0%) | 0 (0.0%) |
| 25 to 34 Year Olds | 9 (100.0%) | 0 (0.0%) |
| 35 Years and over | 0 (0.0%) | 0 (0.0%) |
| Total | 104 (100.0%) | 0 (0.0%) |
Educational Attainment by Field of Study in Meservey
Education (5 | 33.3%), arts & humanities (3 | 20.0%), business (2 | 13.3%), bio, nature & agricultural (1 | 6.7%), and psychology (1 | 6.7%) are the most common fields of study among 15 individuals in Meservey who have obtained a bachelor's degree or higher.
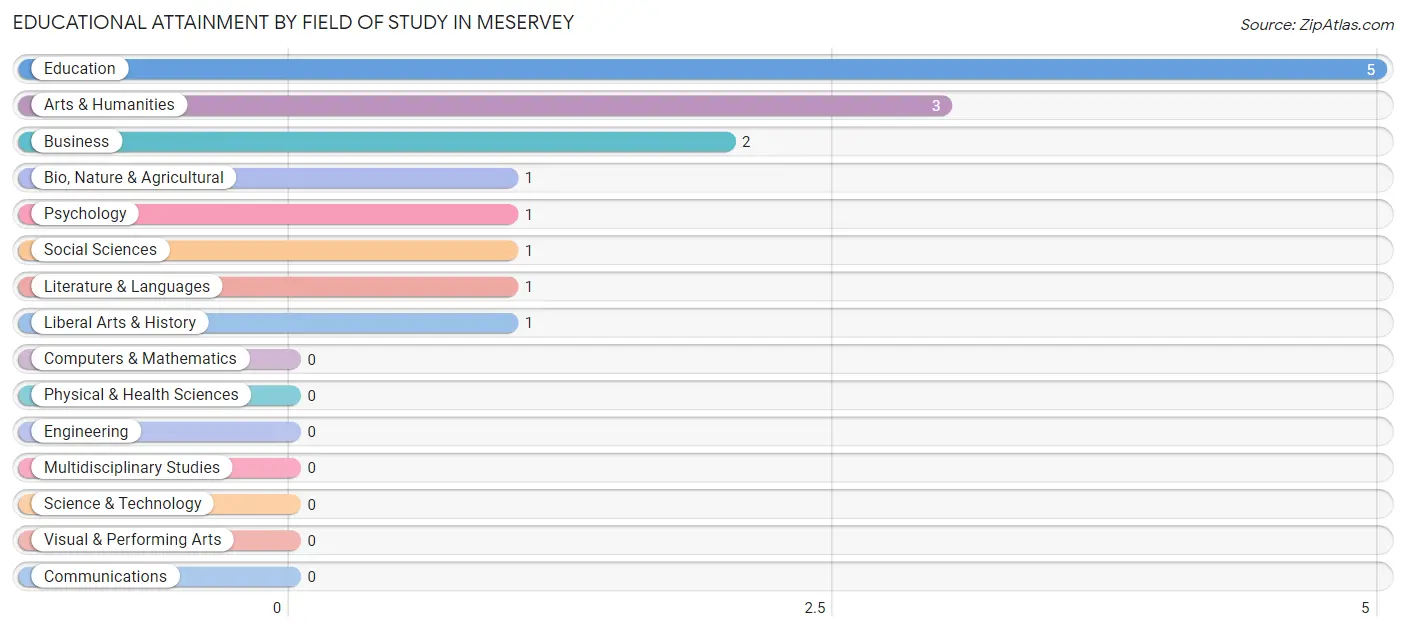
| Field of Study | # Graduates | % Graduates |
| Computers & Mathematics | 0 | 0.0% |
| Bio, Nature & Agricultural | 1 | 6.7% |
| Physical & Health Sciences | 0 | 0.0% |
| Psychology | 1 | 6.7% |
| Social Sciences | 1 | 6.7% |
| Engineering | 0 | 0.0% |
| Multidisciplinary Studies | 0 | 0.0% |
| Science & Technology | 0 | 0.0% |
| Business | 2 | 13.3% |
| Education | 5 | 33.3% |
| Literature & Languages | 1 | 6.7% |
| Liberal Arts & History | 1 | 6.7% |
| Visual & Performing Arts | 0 | 0.0% |
| Communications | 0 | 0.0% |
| Arts & Humanities | 3 | 20.0% |
| Total | 15 | 100.0% |
Transportation & Commute in Meservey
Vehicle Availability by Sex in Meservey
The most prevalent vehicle ownership categories in Meservey are males with 2 vehicles (28, accounting for 54.9%) and females with 2 vehicles (28, making up 53.8%).
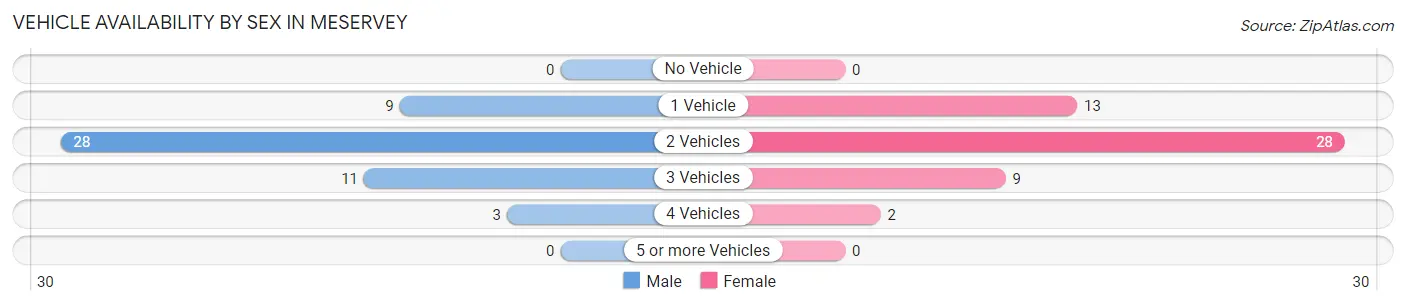
| Vehicles Available | Male | Female |
| No Vehicle | 0 (0.0%) | 0 (0.0%) |
| 1 Vehicle | 9 (17.6%) | 13 (25.0%) |
| 2 Vehicles | 28 (54.9%) | 28 (53.8%) |
| 3 Vehicles | 11 (21.6%) | 9 (17.3%) |
| 4 Vehicles | 3 (5.9%) | 2 (3.8%) |
| 5 or more Vehicles | 0 (0.0%) | 0 (0.0%) |
| Total | 51 (100.0%) | 52 (100.0%) |
Commute Time in Meservey
The most frequently occuring commute durations in Meservey are 30 to 34 minutes (23 commuters, 22.3%), 20 to 24 minutes (19 commuters, 18.4%), and 40 to 44 minutes (13 commuters, 12.6%).
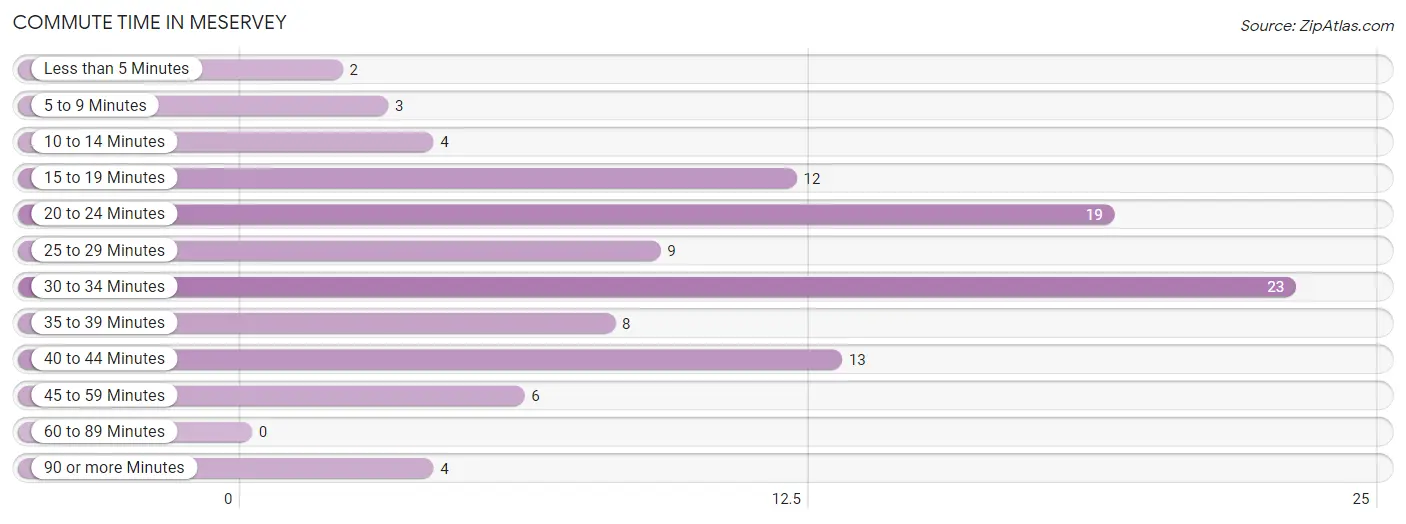
| Commute Time | # Commuters | % Commuters |
| Less than 5 Minutes | 2 | 1.9% |
| 5 to 9 Minutes | 3 | 2.9% |
| 10 to 14 Minutes | 4 | 3.9% |
| 15 to 19 Minutes | 12 | 11.7% |
| 20 to 24 Minutes | 19 | 18.4% |
| 25 to 29 Minutes | 9 | 8.7% |
| 30 to 34 Minutes | 23 | 22.3% |
| 35 to 39 Minutes | 8 | 7.8% |
| 40 to 44 Minutes | 13 | 12.6% |
| 45 to 59 Minutes | 6 | 5.8% |
| 60 to 89 Minutes | 0 | 0.0% |
| 90 or more Minutes | 4 | 3.9% |
Commute Time by Sex in Meservey
The most common commute times in Meservey are 15 to 19 minutes (12 commuters, 23.5%) for males and 30 to 34 minutes (19 commuters, 36.5%) for females.
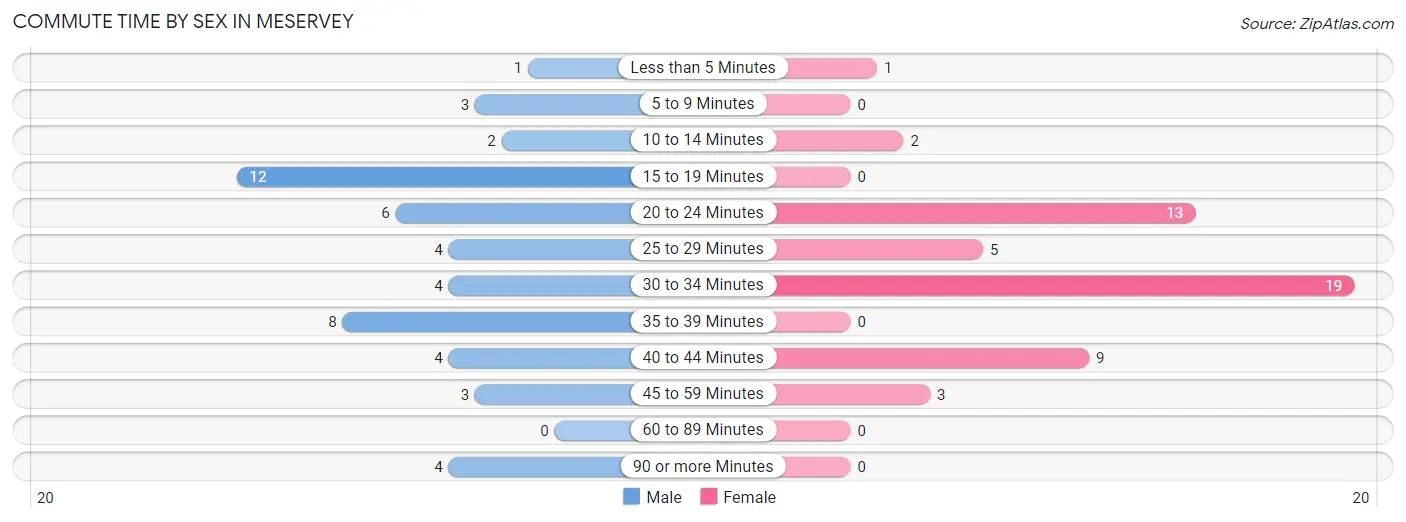
| Commute Time | Male | Female |
| Less than 5 Minutes | 1 (2.0%) | 1 (1.9%) |
| 5 to 9 Minutes | 3 (5.9%) | 0 (0.0%) |
| 10 to 14 Minutes | 2 (3.9%) | 2 (3.8%) |
| 15 to 19 Minutes | 12 (23.5%) | 0 (0.0%) |
| 20 to 24 Minutes | 6 (11.8%) | 13 (25.0%) |
| 25 to 29 Minutes | 4 (7.8%) | 5 (9.6%) |
| 30 to 34 Minutes | 4 (7.8%) | 19 (36.5%) |
| 35 to 39 Minutes | 8 (15.7%) | 0 (0.0%) |
| 40 to 44 Minutes | 4 (7.8%) | 9 (17.3%) |
| 45 to 59 Minutes | 3 (5.9%) | 3 (5.8%) |
| 60 to 89 Minutes | 0 (0.0%) | 0 (0.0%) |
| 90 or more Minutes | 4 (7.8%) | 0 (0.0%) |
Time of Departure to Work by Sex in Meservey
The most frequent times of departure to work in Meservey are 7:00 AM to 7:29 AM (16, 31.4%) for males and 7:00 AM to 7:29 AM (23, 44.2%) for females.
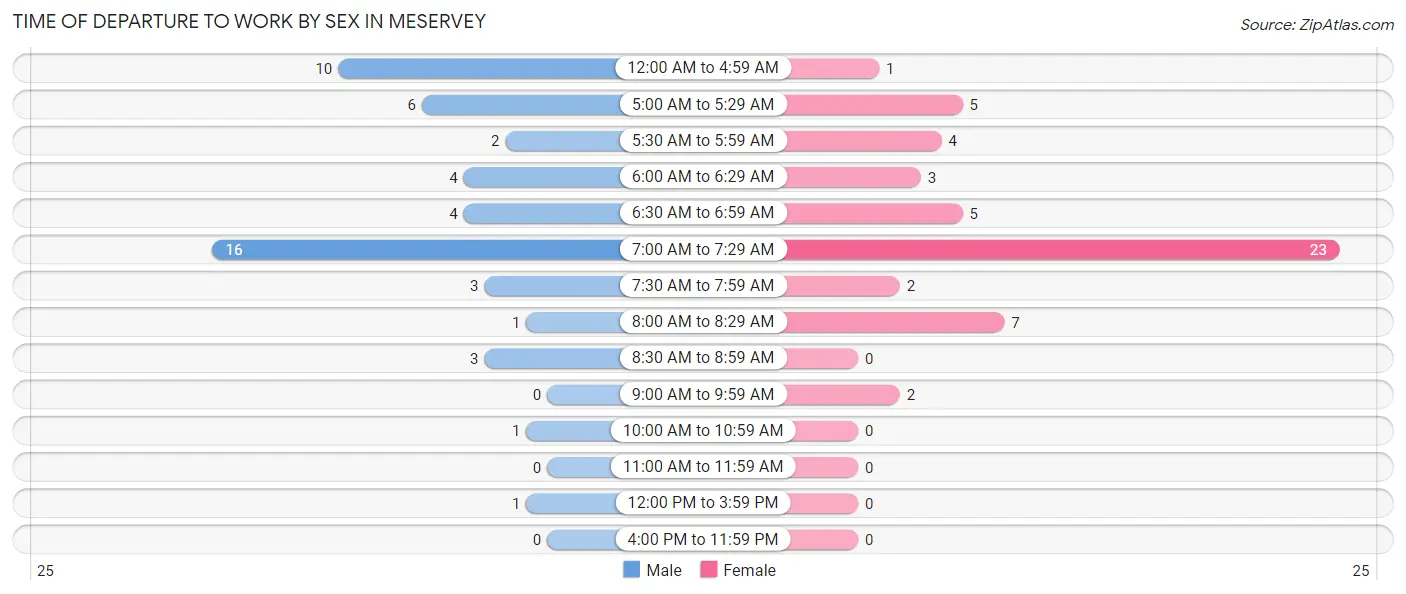
| Time of Departure | Male | Female |
| 12:00 AM to 4:59 AM | 10 (19.6%) | 1 (1.9%) |
| 5:00 AM to 5:29 AM | 6 (11.8%) | 5 (9.6%) |
| 5:30 AM to 5:59 AM | 2 (3.9%) | 4 (7.7%) |
| 6:00 AM to 6:29 AM | 4 (7.8%) | 3 (5.8%) |
| 6:30 AM to 6:59 AM | 4 (7.8%) | 5 (9.6%) |
| 7:00 AM to 7:29 AM | 16 (31.4%) | 23 (44.2%) |
| 7:30 AM to 7:59 AM | 3 (5.9%) | 2 (3.8%) |
| 8:00 AM to 8:29 AM | 1 (2.0%) | 7 (13.5%) |
| 8:30 AM to 8:59 AM | 3 (5.9%) | 0 (0.0%) |
| 9:00 AM to 9:59 AM | 0 (0.0%) | 2 (3.8%) |
| 10:00 AM to 10:59 AM | 1 (2.0%) | 0 (0.0%) |
| 11:00 AM to 11:59 AM | 0 (0.0%) | 0 (0.0%) |
| 12:00 PM to 3:59 PM | 1 (2.0%) | 0 (0.0%) |
| 4:00 PM to 11:59 PM | 0 (0.0%) | 0 (0.0%) |
| Total | 51 (100.0%) | 52 (100.0%) |
Housing Occupancy in Meservey
Occupancy by Ownership in Meservey
Of the total 90 dwellings in Meservey, owner-occupied units account for 61 (67.8%), while renter-occupied units make up 29 (32.2%).
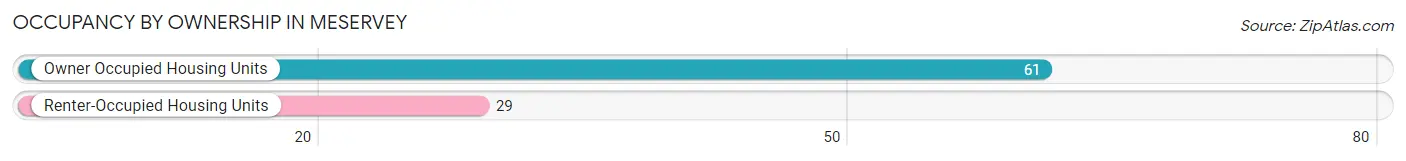
| Occupancy | # Housing Units | % Housing Units |
| Owner Occupied Housing Units | 61 | 67.8% |
| Renter-Occupied Housing Units | 29 | 32.2% |
| Total Occupied Housing Units | 90 | 100.0% |
Occupancy by Household Size in Meservey

| Household Size | # Housing Units | % Housing Units |
| 1-Person Household | 18 | 20.0% |
| 2-Person Household | 27 | 30.0% |
| 3-Person Household | 19 | 21.1% |
| 4+ Person Household | 26 | 28.9% |
| Total Housing Units | 90 | 100.0% |
Occupancy by Ownership by Household Size in Meservey
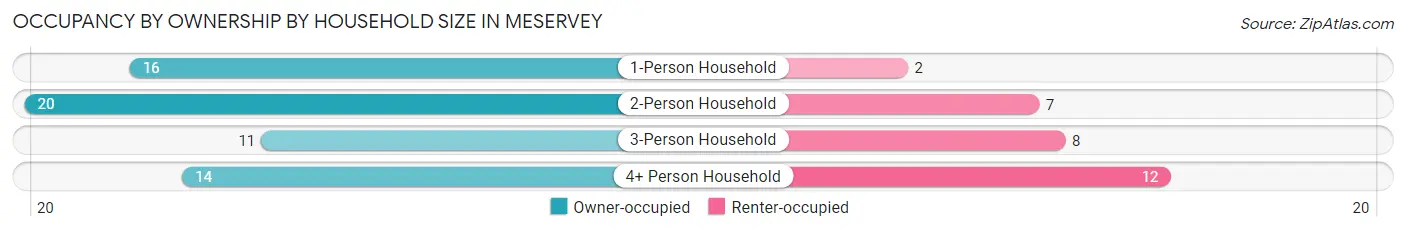
| Household Size | Owner-occupied | Renter-occupied |
| 1-Person Household | 16 (88.9%) | 2 (11.1%) |
| 2-Person Household | 20 (74.1%) | 7 (25.9%) |
| 3-Person Household | 11 (57.9%) | 8 (42.1%) |
| 4+ Person Household | 14 (53.8%) | 12 (46.2%) |
| Total Housing Units | 61 (67.8%) | 29 (32.2%) |
Occupancy by Educational Attainment in Meservey
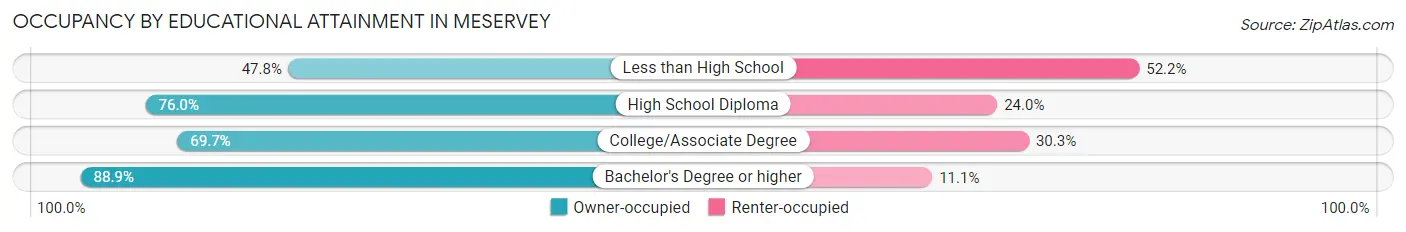
| Household Size | Owner-occupied | Renter-occupied |
| Less than High School | 11 (47.8%) | 12 (52.2%) |
| High School Diploma | 19 (76.0%) | 6 (24.0%) |
| College/Associate Degree | 23 (69.7%) | 10 (30.3%) |
| Bachelor's Degree or higher | 8 (88.9%) | 1 (11.1%) |
Occupancy by Age of Householder in Meservey
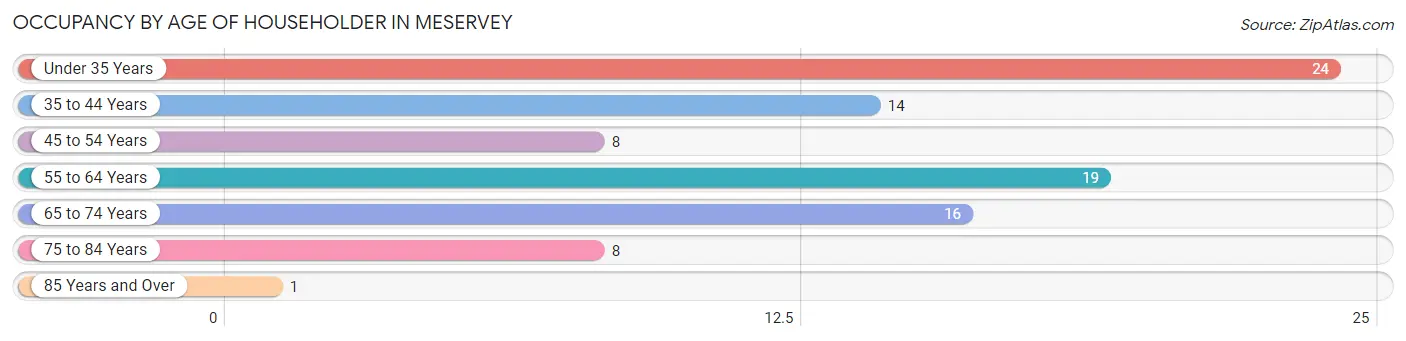
| Age Bracket | # Households | % Households |
| Under 35 Years | 24 | 26.7% |
| 35 to 44 Years | 14 | 15.6% |
| 45 to 54 Years | 8 | 8.9% |
| 55 to 64 Years | 19 | 21.1% |
| 65 to 74 Years | 16 | 17.8% |
| 75 to 84 Years | 8 | 8.9% |
| 85 Years and Over | 1 | 1.1% |
| Total | 90 | 100.0% |
Housing Finances in Meservey
Median Income by Occupancy in Meservey
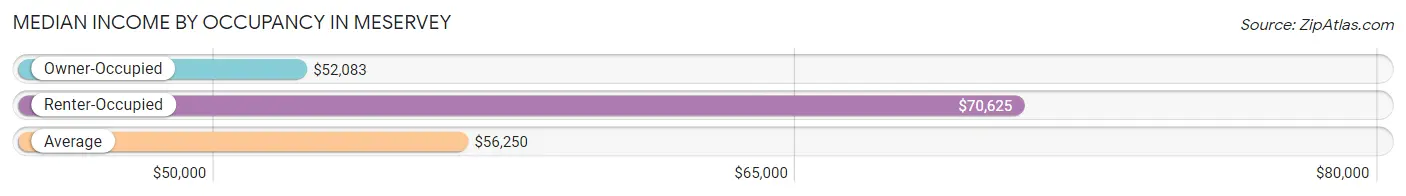
| Occupancy Type | # Households | Median Income |
| Owner-Occupied | 61 (67.8%) | $52,083 |
| Renter-Occupied | 29 (32.2%) | $70,625 |
| Average | 90 (100.0%) | $56,250 |
Occupancy by Householder Income Bracket in Meservey
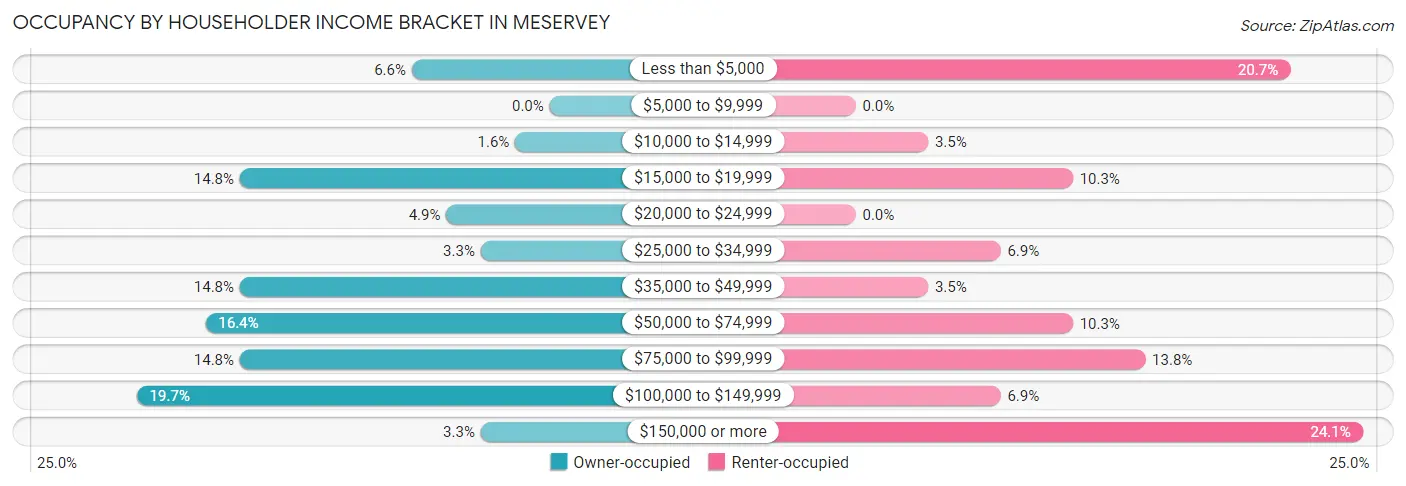
| Income Bracket | Owner-occupied | Renter-occupied |
| Less than $5,000 | 4 (6.6%) | 6 (20.7%) |
| $5,000 to $9,999 | 0 (0.0%) | 0 (0.0%) |
| $10,000 to $14,999 | 1 (1.6%) | 1 (3.5%) |
| $15,000 to $19,999 | 9 (14.7%) | 3 (10.3%) |
| $20,000 to $24,999 | 3 (4.9%) | 0 (0.0%) |
| $25,000 to $34,999 | 2 (3.3%) | 2 (6.9%) |
| $35,000 to $49,999 | 9 (14.7%) | 1 (3.5%) |
| $50,000 to $74,999 | 10 (16.4%) | 3 (10.3%) |
| $75,000 to $99,999 | 9 (14.7%) | 4 (13.8%) |
| $100,000 to $149,999 | 12 (19.7%) | 2 (6.9%) |
| $150,000 or more | 2 (3.3%) | 7 (24.1%) |
| Total | 61 (100.0%) | 29 (100.0%) |
Monthly Housing Cost Tiers in Meservey
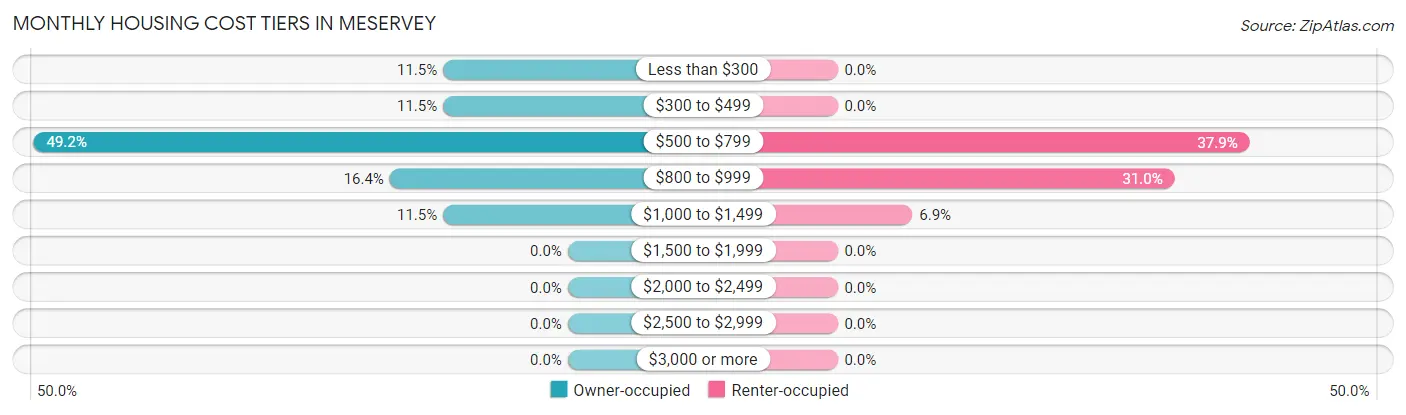
| Monthly Cost | Owner-occupied | Renter-occupied |
| Less than $300 | 7 (11.5%) | 0 (0.0%) |
| $300 to $499 | 7 (11.5%) | 0 (0.0%) |
| $500 to $799 | 30 (49.2%) | 11 (37.9%) |
| $800 to $999 | 10 (16.4%) | 9 (31.0%) |
| $1,000 to $1,499 | 7 (11.5%) | 2 (6.9%) |
| $1,500 to $1,999 | 0 (0.0%) | 0 (0.0%) |
| $2,000 to $2,499 | 0 (0.0%) | 0 (0.0%) |
| $2,500 to $2,999 | 0 (0.0%) | 0 (0.0%) |
| $3,000 or more | 0 (0.0%) | 0 (0.0%) |
| Total | 61 (100.0%) | 29 (100.0%) |
Physical Housing Characteristics in Meservey
Housing Structures in Meservey
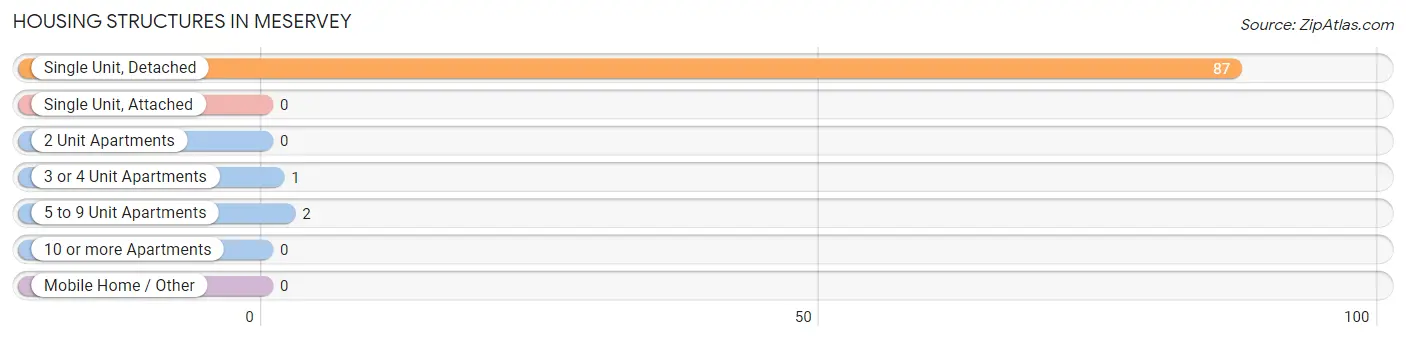
| Structure Type | # Housing Units | % Housing Units |
| Single Unit, Detached | 87 | 96.7% |
| Single Unit, Attached | 0 | 0.0% |
| 2 Unit Apartments | 0 | 0.0% |
| 3 or 4 Unit Apartments | 1 | 1.1% |
| 5 to 9 Unit Apartments | 2 | 2.2% |
| 10 or more Apartments | 0 | 0.0% |
| Mobile Home / Other | 0 | 0.0% |
| Total | 90 | 100.0% |
Housing Structures by Occupancy in Meservey
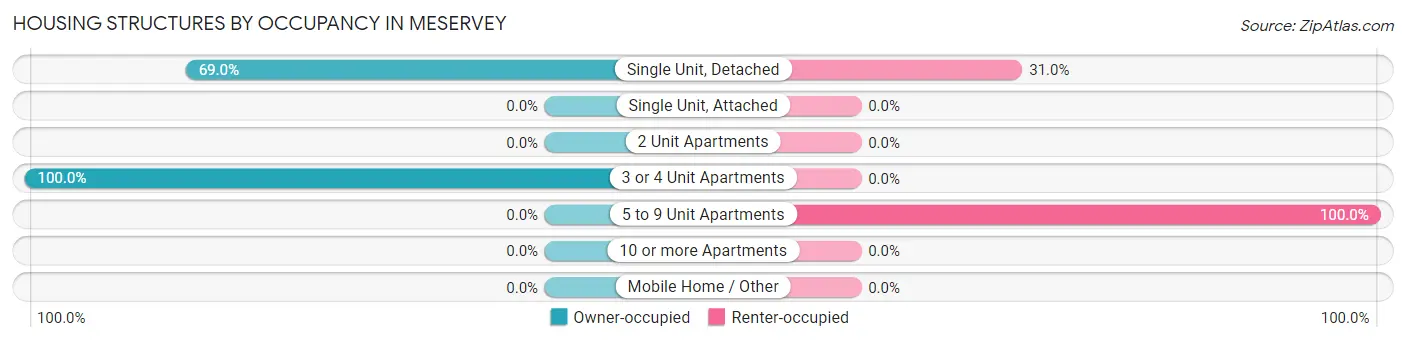
| Structure Type | Owner-occupied | Renter-occupied |
| Single Unit, Detached | 60 (69.0%) | 27 (31.0%) |
| Single Unit, Attached | 0 (0.0%) | 0 (0.0%) |
| 2 Unit Apartments | 0 (0.0%) | 0 (0.0%) |
| 3 or 4 Unit Apartments | 1 (100.0%) | 0 (0.0%) |
| 5 to 9 Unit Apartments | 0 (0.0%) | 2 (100.0%) |
| 10 or more Apartments | 0 (0.0%) | 0 (0.0%) |
| Mobile Home / Other | 0 (0.0%) | 0 (0.0%) |
| Total | 61 (67.8%) | 29 (32.2%) |
Housing Structures by Number of Rooms in Meservey
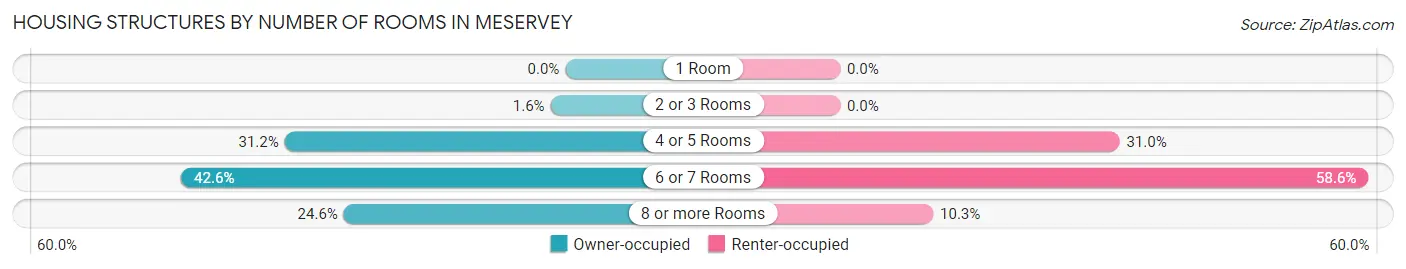
| Number of Rooms | Owner-occupied | Renter-occupied |
| 1 Room | 0 (0.0%) | 0 (0.0%) |
| 2 or 3 Rooms | 1 (1.6%) | 0 (0.0%) |
| 4 or 5 Rooms | 19 (31.1%) | 9 (31.0%) |
| 6 or 7 Rooms | 26 (42.6%) | 17 (58.6%) |
| 8 or more Rooms | 15 (24.6%) | 3 (10.3%) |
| Total | 61 (100.0%) | 29 (100.0%) |
Housing Structure by Heating Type in Meservey
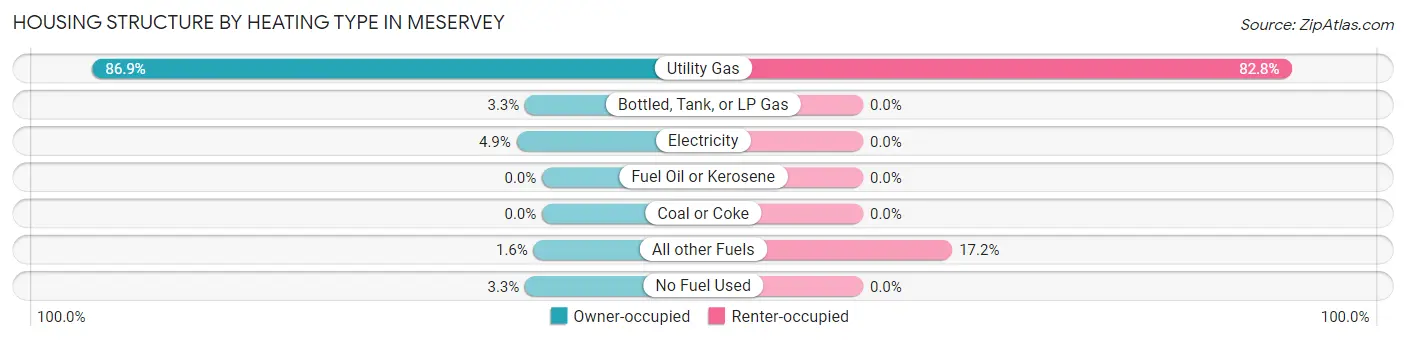
| Heating Type | Owner-occupied | Renter-occupied |
| Utility Gas | 53 (86.9%) | 24 (82.8%) |
| Bottled, Tank, or LP Gas | 2 (3.3%) | 0 (0.0%) |
| Electricity | 3 (4.9%) | 0 (0.0%) |
| Fuel Oil or Kerosene | 0 (0.0%) | 0 (0.0%) |
| Coal or Coke | 0 (0.0%) | 0 (0.0%) |
| All other Fuels | 1 (1.6%) | 5 (17.2%) |
| No Fuel Used | 2 (3.3%) | 0 (0.0%) |
| Total | 61 (100.0%) | 29 (100.0%) |
Household Vehicle Usage in Meservey
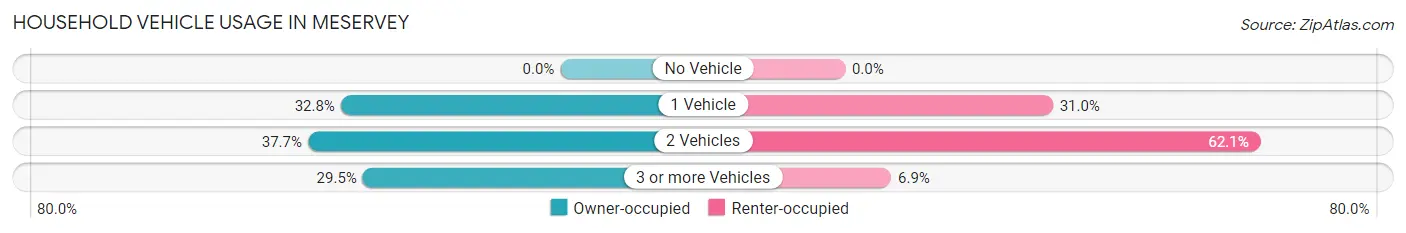
| Vehicles per Household | Owner-occupied | Renter-occupied |
| No Vehicle | 0 (0.0%) | 0 (0.0%) |
| 1 Vehicle | 20 (32.8%) | 9 (31.0%) |
| 2 Vehicles | 23 (37.7%) | 18 (62.1%) |
| 3 or more Vehicles | 18 (29.5%) | 2 (6.9%) |
| Total | 61 (100.0%) | 29 (100.0%) |
Real Estate & Mortgages in Meservey
Real Estate and Mortgage Overview in Meservey
| Characteristic | Without Mortgage | With Mortgage |
| Housing Units | 30 | 31 |
| Median Property Value | $52,500 | $59,200 |
| Median Household Income | $44,167 | $2 |
| Monthly Housing Costs | $511 | $0 |
| Real Estate Taxes | $713 | $0 |
Property Value by Mortgage Status in Meservey
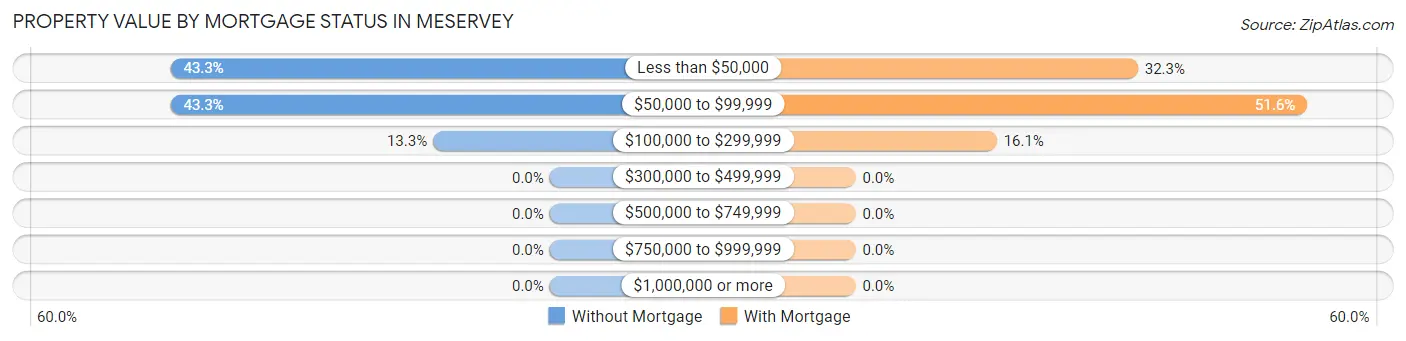
| Property Value | Without Mortgage | With Mortgage |
| Less than $50,000 | 13 (43.3%) | 10 (32.3%) |
| $50,000 to $99,999 | 13 (43.3%) | 16 (51.6%) |
| $100,000 to $299,999 | 4 (13.3%) | 5 (16.1%) |
| $300,000 to $499,999 | 0 (0.0%) | 0 (0.0%) |
| $500,000 to $749,999 | 0 (0.0%) | 0 (0.0%) |
| $750,000 to $999,999 | 0 (0.0%) | 0 (0.0%) |
| $1,000,000 or more | 0 (0.0%) | 0 (0.0%) |
| Total | 30 (100.0%) | 31 (100.0%) |
Household Income by Mortgage Status in Meservey
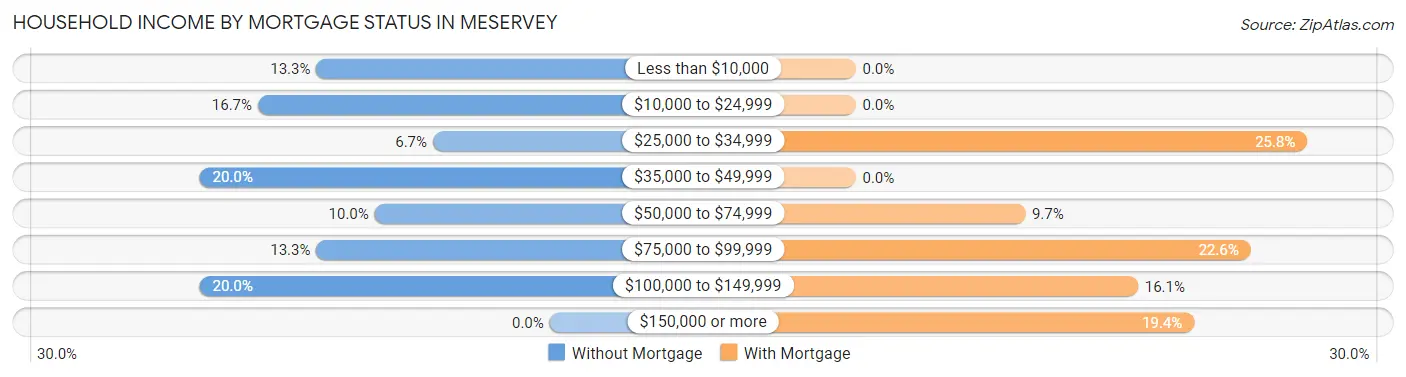
| Household Income | Without Mortgage | With Mortgage |
| Less than $10,000 | 4 (13.3%) | 0 (0.0%) |
| $10,000 to $24,999 | 5 (16.7%) | 0 (0.0%) |
| $25,000 to $34,999 | 2 (6.7%) | 8 (25.8%) |
| $35,000 to $49,999 | 6 (20.0%) | 0 (0.0%) |
| $50,000 to $74,999 | 3 (10.0%) | 3 (9.7%) |
| $75,000 to $99,999 | 4 (13.3%) | 7 (22.6%) |
| $100,000 to $149,999 | 6 (20.0%) | 5 (16.1%) |
| $150,000 or more | 0 (0.0%) | 6 (19.4%) |
| Total | 30 (100.0%) | 31 (100.0%) |
Property Value to Household Income Ratio in Meservey
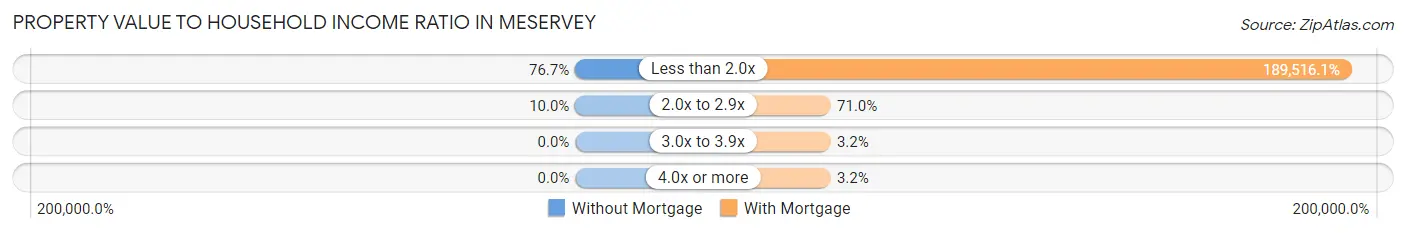
| Value-to-Income Ratio | Without Mortgage | With Mortgage |
| Less than 2.0x | 23 (76.7%) | 58,750 (189,516.1%) |
| 2.0x to 2.9x | 3 (10.0%) | 22 (71.0%) |
| 3.0x to 3.9x | 0 (0.0%) | 1 (3.2%) |
| 4.0x or more | 0 (0.0%) | 1 (3.2%) |
| Total | 30 (100.0%) | 31 (100.0%) |
Real Estate Taxes by Mortgage Status in Meservey
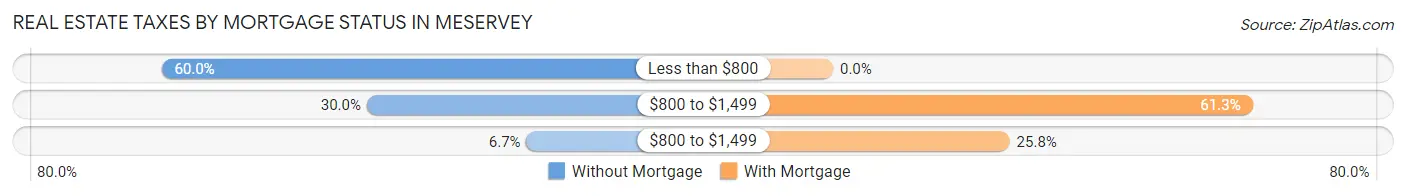
| Property Taxes | Without Mortgage | With Mortgage |
| Less than $800 | 18 (60.0%) | 0 (0.0%) |
| $800 to $1,499 | 9 (30.0%) | 19 (61.3%) |
| $800 to $1,499 | 2 (6.7%) | 8 (25.8%) |
| Total | 30 (100.0%) | 31 (100.0%) |
Health & Disability in Meservey
Health Insurance Coverage by Age in Meservey
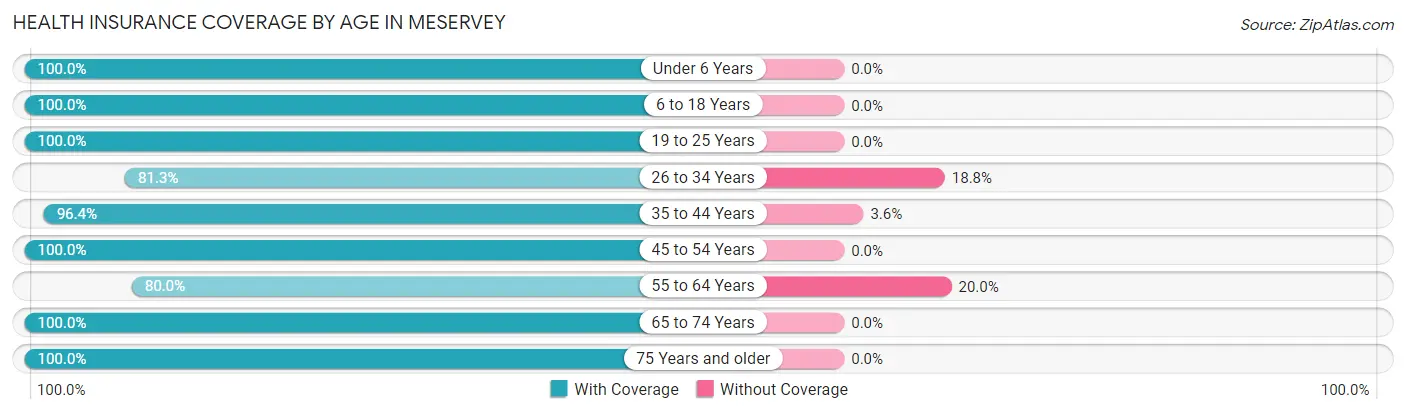
| Age Bracket | With Coverage | Without Coverage |
| Under 6 Years | 30 (100.0%) | 0 (0.0%) |
| 6 to 18 Years | 87 (100.0%) | 0 (0.0%) |
| 19 to 25 Years | 11 (100.0%) | 0 (0.0%) |
| 26 to 34 Years | 26 (81.2%) | 6 (18.8%) |
| 35 to 44 Years | 27 (96.4%) | 1 (3.6%) |
| 45 to 54 Years | 25 (100.0%) | 0 (0.0%) |
| 55 to 64 Years | 24 (80.0%) | 6 (20.0%) |
| 65 to 74 Years | 25 (100.0%) | 0 (0.0%) |
| 75 Years and older | 13 (100.0%) | 0 (0.0%) |
| Total | 268 (95.4%) | 13 (4.6%) |
Health Insurance Coverage by Citizenship Status in Meservey
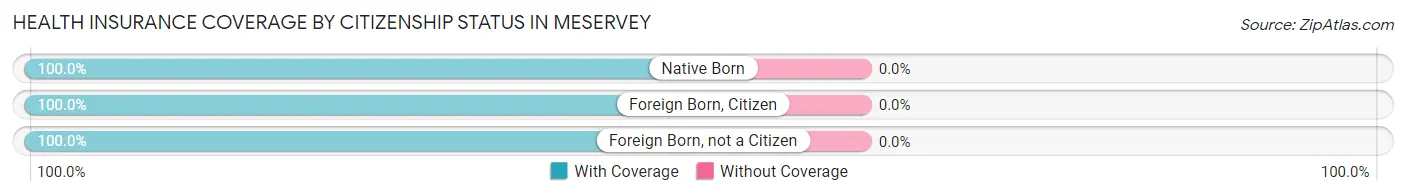
| Citizenship Status | With Coverage | Without Coverage |
| Native Born | 30 (100.0%) | 0 (0.0%) |
| Foreign Born, Citizen | 87 (100.0%) | 0 (0.0%) |
| Foreign Born, not a Citizen | 11 (100.0%) | 0 (0.0%) |
Health Insurance Coverage by Household Income in Meservey
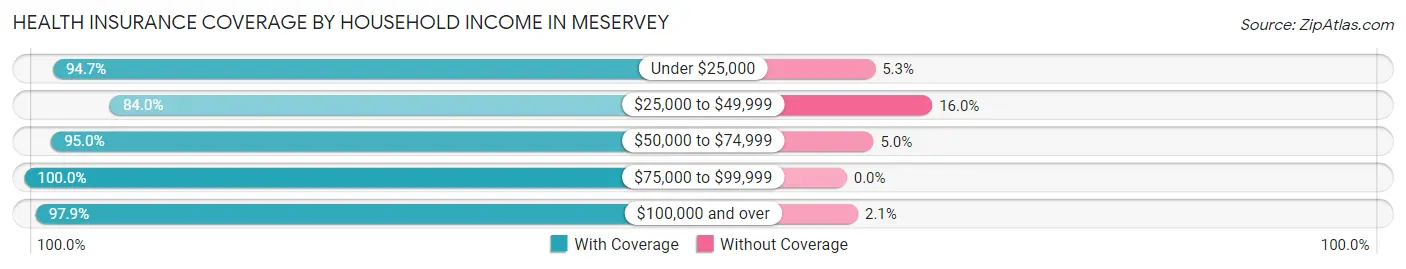
| Household Income | With Coverage | Without Coverage |
| Under $25,000 | 89 (94.7%) | 5 (5.3%) |
| $25,000 to $49,999 | 21 (84.0%) | 4 (16.0%) |
| $50,000 to $74,999 | 38 (95.0%) | 2 (5.0%) |
| $75,000 to $99,999 | 27 (100.0%) | 0 (0.0%) |
| $100,000 and over | 93 (97.9%) | 2 (2.1%) |
Public vs Private Health Insurance Coverage by Age in Meservey
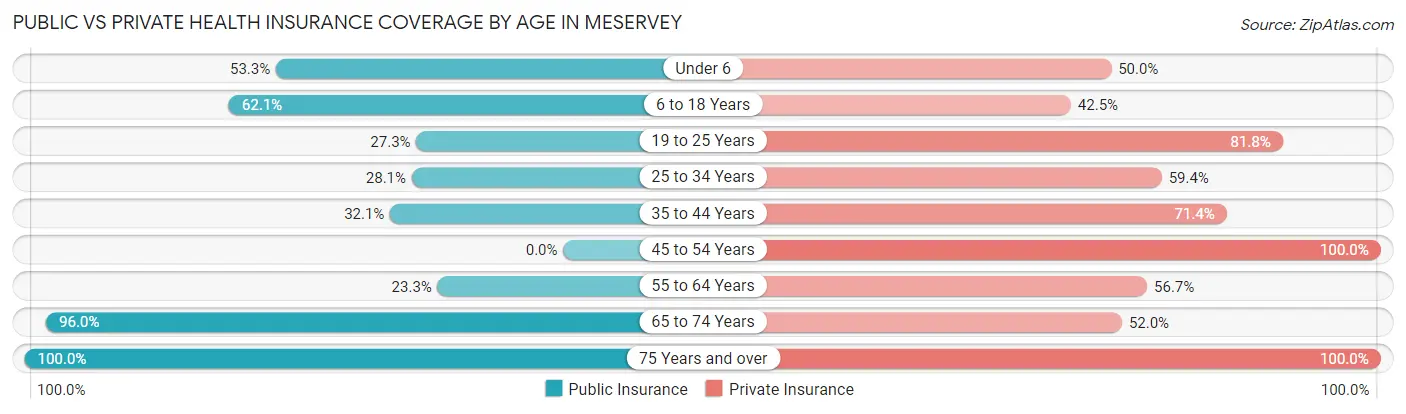
| Age Bracket | Public Insurance | Private Insurance |
| Under 6 | 16 (53.3%) | 15 (50.0%) |
| 6 to 18 Years | 54 (62.1%) | 37 (42.5%) |
| 19 to 25 Years | 3 (27.3%) | 9 (81.8%) |
| 25 to 34 Years | 9 (28.1%) | 19 (59.4%) |
| 35 to 44 Years | 9 (32.1%) | 20 (71.4%) |
| 45 to 54 Years | 0 (0.0%) | 25 (100.0%) |
| 55 to 64 Years | 7 (23.3%) | 17 (56.7%) |
| 65 to 74 Years | 24 (96.0%) | 13 (52.0%) |
| 75 Years and over | 13 (100.0%) | 13 (100.0%) |
| Total | 135 (48.0%) | 168 (59.8%) |
Disability Status by Sex by Age in Meservey
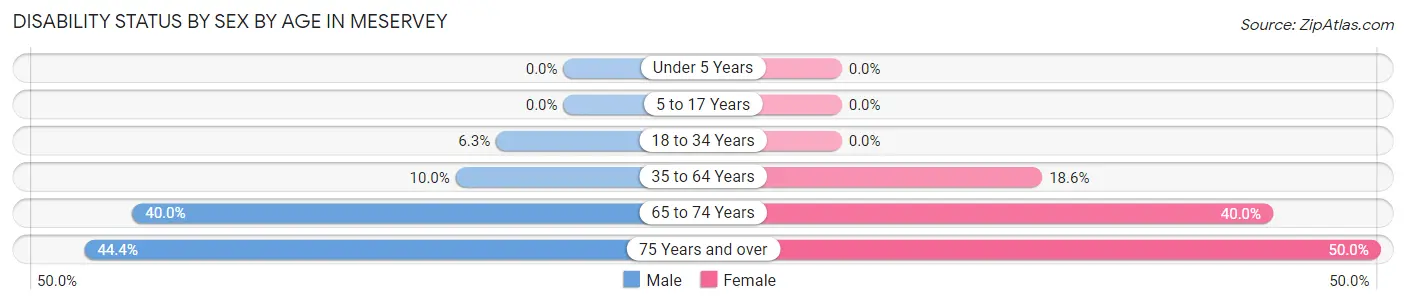
| Age Bracket | Male | Female |
| Under 5 Years | 0 (0.0%) | 0 (0.0%) |
| 5 to 17 Years | 0 (0.0%) | 0 (0.0%) |
| 18 to 34 Years | 1 (6.2%) | 0 (0.0%) |
| 35 to 64 Years | 4 (10.0%) | 8 (18.6%) |
| 65 to 74 Years | 4 (40.0%) | 6 (40.0%) |
| 75 Years and over | 4 (44.4%) | 2 (50.0%) |
Disability Class by Sex by Age in Meservey
Disability Class: Hearing Difficulty
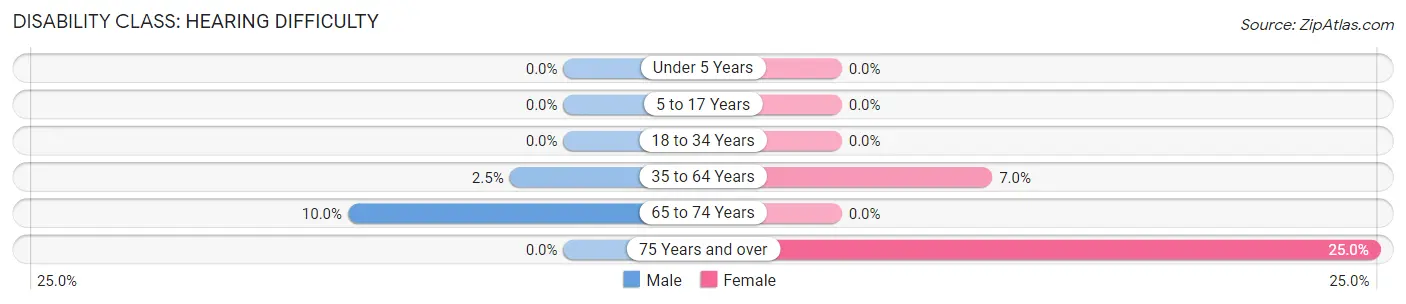
| Age Bracket | Male | Female |
| Under 5 Years | 0 (0.0%) | 0 (0.0%) |
| 5 to 17 Years | 0 (0.0%) | 0 (0.0%) |
| 18 to 34 Years | 0 (0.0%) | 0 (0.0%) |
| 35 to 64 Years | 1 (2.5%) | 3 (7.0%) |
| 65 to 74 Years | 1 (10.0%) | 0 (0.0%) |
| 75 Years and over | 0 (0.0%) | 1 (25.0%) |
Disability Class: Vision Difficulty
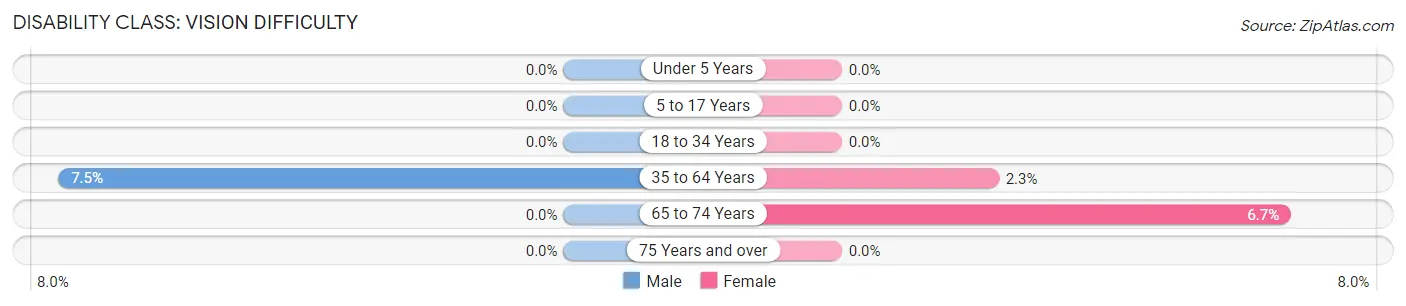
| Age Bracket | Male | Female |
| Under 5 Years | 0 (0.0%) | 0 (0.0%) |
| 5 to 17 Years | 0 (0.0%) | 0 (0.0%) |
| 18 to 34 Years | 0 (0.0%) | 0 (0.0%) |
| 35 to 64 Years | 3 (7.5%) | 1 (2.3%) |
| 65 to 74 Years | 0 (0.0%) | 1 (6.7%) |
| 75 Years and over | 0 (0.0%) | 0 (0.0%) |
Disability Class: Cognitive Difficulty
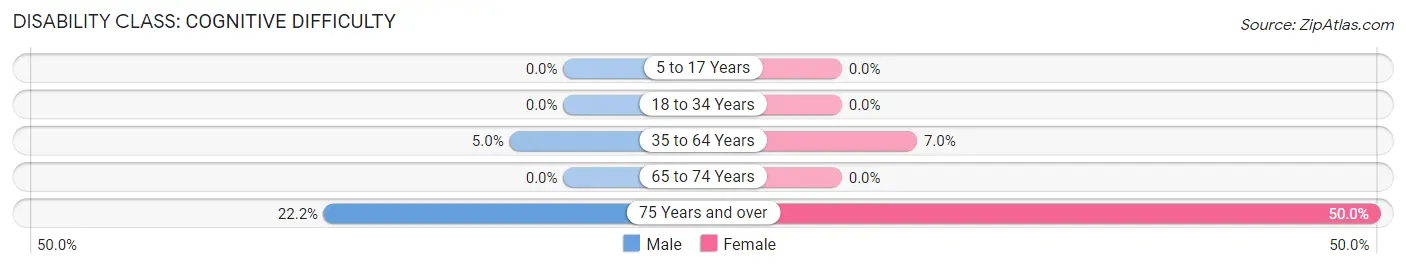
| Age Bracket | Male | Female |
| 5 to 17 Years | 0 (0.0%) | 0 (0.0%) |
| 18 to 34 Years | 0 (0.0%) | 0 (0.0%) |
| 35 to 64 Years | 2 (5.0%) | 3 (7.0%) |
| 65 to 74 Years | 0 (0.0%) | 0 (0.0%) |
| 75 Years and over | 2 (22.2%) | 2 (50.0%) |
Disability Class: Ambulatory Difficulty
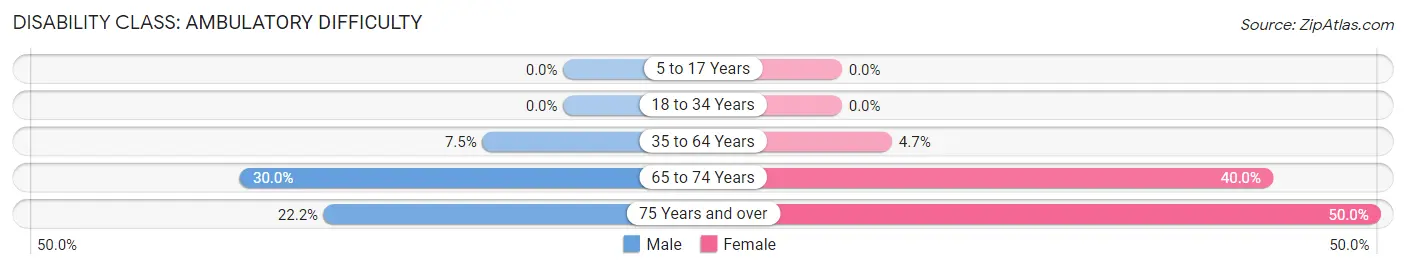
| Age Bracket | Male | Female |
| 5 to 17 Years | 0 (0.0%) | 0 (0.0%) |
| 18 to 34 Years | 0 (0.0%) | 0 (0.0%) |
| 35 to 64 Years | 3 (7.5%) | 2 (4.6%) |
| 65 to 74 Years | 3 (30.0%) | 6 (40.0%) |
| 75 Years and over | 2 (22.2%) | 2 (50.0%) |
Disability Class: Self-Care Difficulty
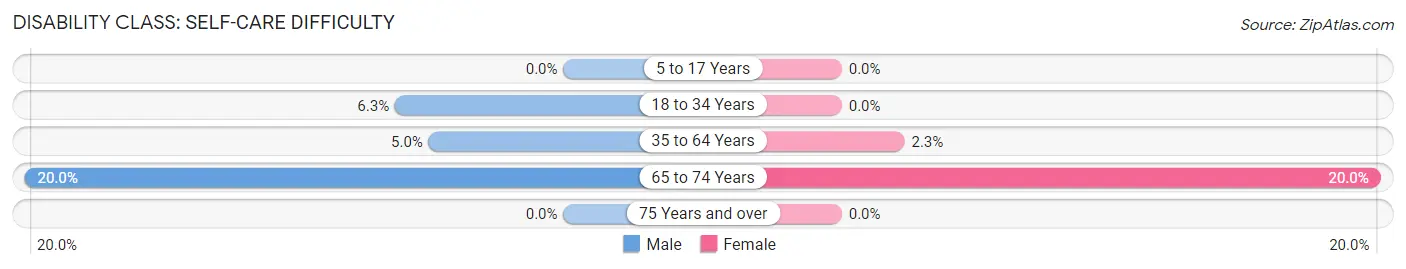
| Age Bracket | Male | Female |
| 5 to 17 Years | 0 (0.0%) | 0 (0.0%) |
| 18 to 34 Years | 1 (6.2%) | 0 (0.0%) |
| 35 to 64 Years | 2 (5.0%) | 1 (2.3%) |
| 65 to 74 Years | 2 (20.0%) | 3 (20.0%) |
| 75 Years and over | 0 (0.0%) | 0 (0.0%) |
Technology Access in Meservey
Computing Device Access in Meservey
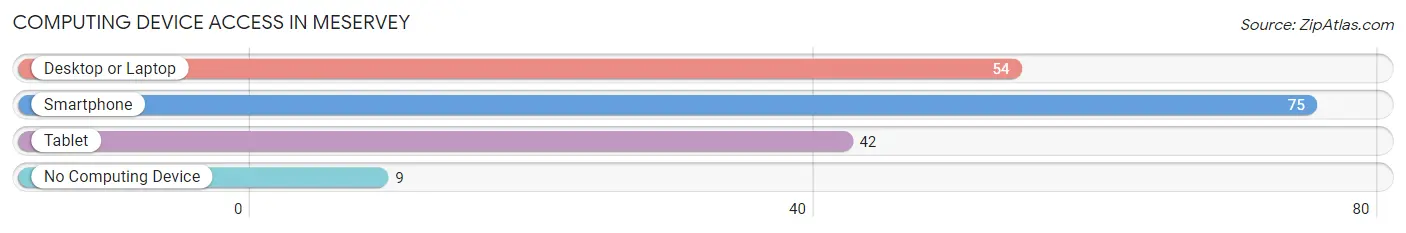
| Device Type | # Households | % Households |
| Desktop or Laptop | 54 | 60.0% |
| Smartphone | 75 | 83.3% |
| Tablet | 42 | 46.7% |
| No Computing Device | 9 | 10.0% |
| Total | 90 | 100.0% |
Internet Access in Meservey
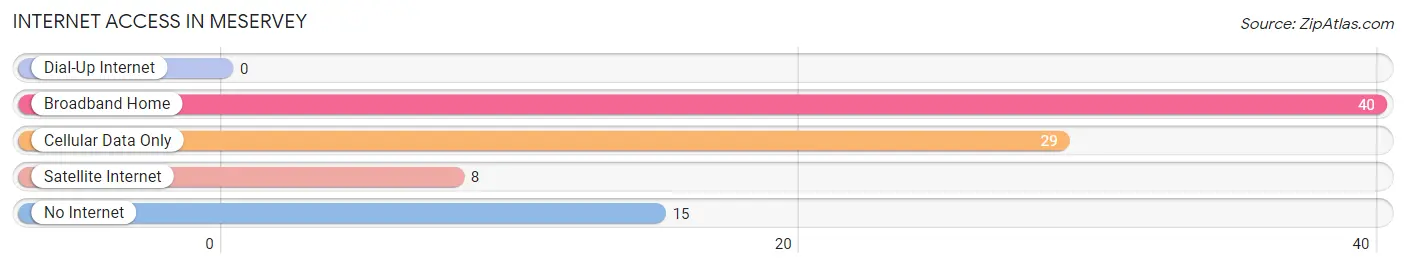
| Internet Type | # Households | % Households |
| Dial-Up Internet | 0 | 0.0% |
| Broadband Home | 40 | 44.4% |
| Cellular Data Only | 29 | 32.2% |
| Satellite Internet | 8 | 8.9% |
| No Internet | 15 | 16.7% |
| Total | 90 | 100.0% |
Meservey Summary
Meservey is a small city located in Cerro Gordo County, Iowa, United States. The population was estimated to be around 200 people in 2020. The city is located in the northern part of the state, about 20 miles north of Mason City.
Geography
Meservey is located at the intersection of U.S. Route 65 and Iowa Highway 122. It is situated on the banks of the Shell Rock River, which flows through the city. The city is surrounded by rolling hills and farmland. The nearest major city is Mason City, which is about 20 miles south.
History
Meservey was founded in 1881 by a group of settlers from Wisconsin. The city was named after the Meservey family, who were among the first settlers. The city was incorporated in 1883.
In the early 1900s, Meservey was a thriving agricultural community. The city was home to several grain elevators, a creamery, and a flour mill. The city also had a railroad station, which was used to transport goods to and from the city.
In the 1950s, the city began to decline as the agricultural industry shifted away from the area. The railroad station closed in the 1960s, and the grain elevators and flour mill were eventually demolished.
Economy
Today, Meservey is a small, rural community. The city is home to several small businesses, including a grocery store, a hardware store, and a few restaurants. The city also has a post office and a bank.
The city is also home to a few manufacturing companies, including a plastics manufacturer and a metal fabrication company. The city is also home to a few farms, which produce corn, soybeans, and other crops.
Demographics
As of the 2020 census, the population of Meservey was estimated to be around 200 people. The racial makeup of the city was 97.5% White, 0.5% African American, 0.5% Native American, and 1.5% from other races. The median household income was $45,000, and the median home value was $90,000.
Conclusion
Meservey is a small city located in Cerro Gordo County, Iowa. The city has a population of around 200 people and is home to several small businesses. The city is also home to a few manufacturing companies and farms. The median household income is $45,000, and the median home value is $90,000.
Common Questions
What is Per Capita Income in Meservey?
Per Capita income in Meservey is $22,236.
What is the Median Family Income in Meservey?
Median Family Income in Meservey is $66,875.
What is the Median Household income in Meservey?
Median Household Income in Meservey is $56,250.
What is Income or Wage Gap in Meservey?
Income or Wage Gap in Meservey is 21.7%.
Women in Meservey earn 78.3 cents for every dollar earned by a man.
What is Inequality or Gini Index in Meservey?
Inequality or Gini Index in Meservey is 0.44.
What is the Total Population of Meservey?
Total Population of Meservey is 281.
What is the Total Male Population of Meservey?
Total Male Population of Meservey is 134.
What is the Total Female Population of Meservey?
Total Female Population of Meservey is 147.
What is the Ratio of Males per 100 Females in Meservey?
There are 91.16 Males per 100 Females in Meservey.
What is the Ratio of Females per 100 Males in Meservey?
There are 109.70 Females per 100 Males in Meservey.
What is the Median Population Age in Meservey?
Median Population Age in Meservey is 30.3 Years.
What is the Average Family Size in Meservey
Average Family Size in Meservey is 3.6 People.
What is the Average Household Size in Meservey
Average Household Size in Meservey is 3.1 People.
How Large is the Labor Force in Meservey?
There are 105 People in the Labor Forcein in Meservey.
What is the Percentage of People in the Labor Force in Meservey?
55.0% of People are in the Labor Force in Meservey.
What is the Unemployment Rate in Meservey?
Unemployment Rate in Meservey is 1.0%.