Slavic vs Lithuanian Female Disability
COMPARE
Slavic
Lithuanian
Female Disability
Female Disability Comparison
Slavs
Lithuanians
12.6%
FEMALE DISABILITY
3.8/ 100
METRIC RATING
237th/ 347
METRIC RANK
12.2%
FEMALE DISABILITY
59.5/ 100
METRIC RATING
166th/ 347
METRIC RANK
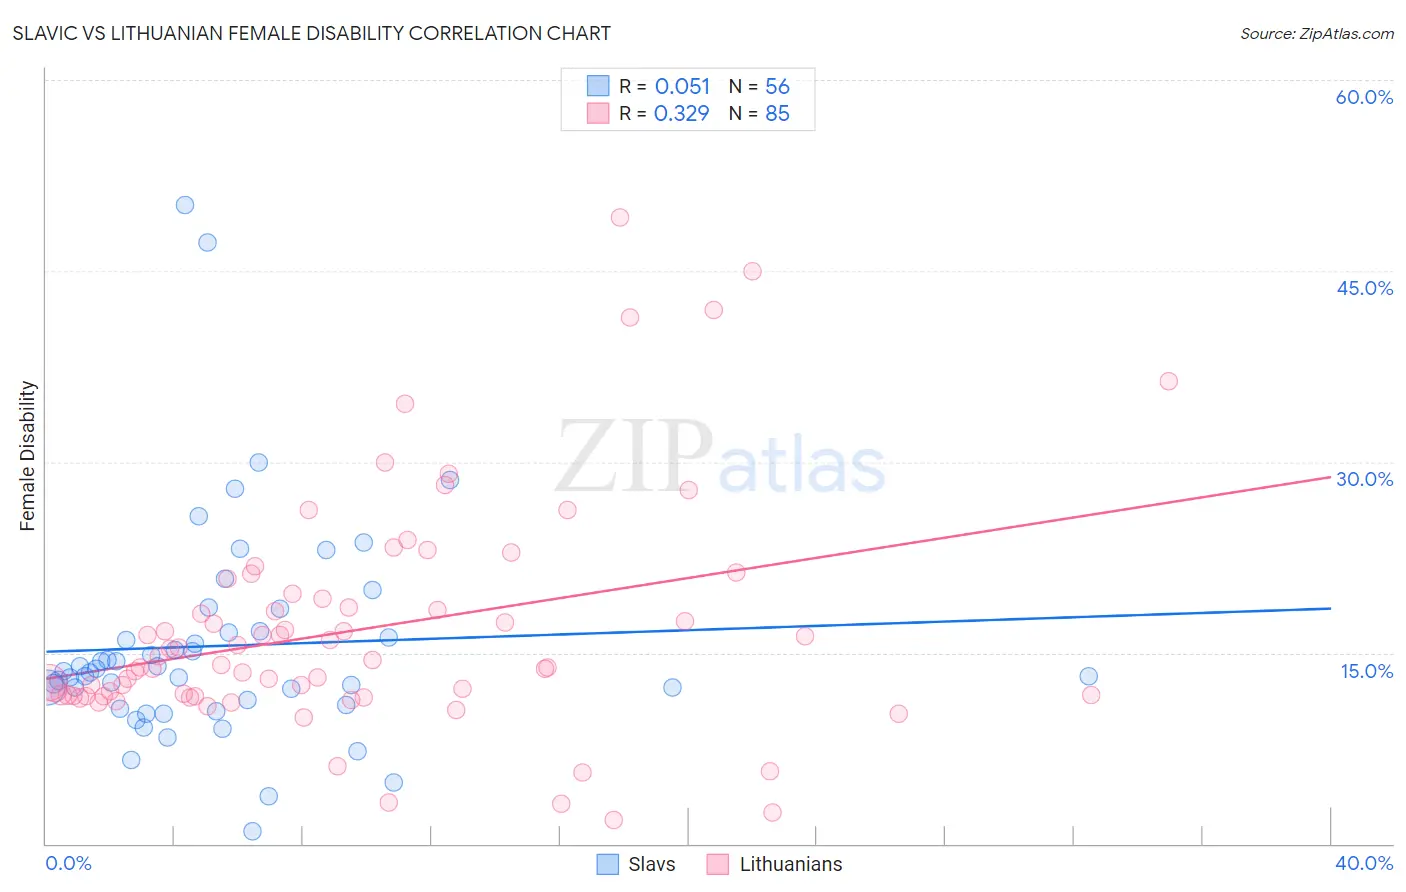
Slavic vs Lithuanian Female Disability Correlation Chart
The statistical analysis conducted on geographies consisting of 270,849,330 people shows a slight positive correlation between the proportion of Slavs and percentage of females with a disability in the United States with a correlation coefficient (R) of 0.051 and weighted average of 12.6%. Similarly, the statistical analysis conducted on geographies consisting of 421,926,295 people shows a mild positive correlation between the proportion of Lithuanians and percentage of females with a disability in the United States with a correlation coefficient (R) of 0.329 and weighted average of 12.2%, a difference of 3.4%.
Female Disability Correlation Summary
| Measurement | Slavic | Lithuanian |
| Minimum | 1.0% | 1.9% |
| Maximum | 50.2% | 49.2% |
| Range | 49.2% | 47.3% |
| Mean | 15.5% | 16.8% |
| Median | 13.5% | 14.0% |
| Interquartile 25% (IQ1) | 11.1% | 11.6% |
| Interquartile 75% (IQ3) | 16.6% | 19.4% |
| Interquartile Range (IQR) | 5.6% | 7.8% |
| Standard Deviation (Sample) | 8.7% | 9.0% |
| Standard Deviation (Population) | 8.6% | 9.0% |
Similar Demographics by Female Disability
Demographics Similar to Slavs by Female Disability
In terms of female disability, the demographic groups most similar to Slavs are Yugoslavian (12.6%, a difference of 0.030%), Barbadian (12.6%, a difference of 0.060%), Immigrants from West Indies (12.6%, a difference of 0.13%), German Russian (12.6%, a difference of 0.15%), and Malaysian (12.5%, a difference of 0.26%).
| Demographics | Rating | Rank | Female Disability |
| Immigrants | Belize | 7.0 /100 | #230 | Tragic 12.5% |
| Belgians | 6.5 /100 | #231 | Tragic 12.5% |
| Immigrants | Somalia | 5.9 /100 | #232 | Tragic 12.5% |
| Immigrants | Iraq | 5.3 /100 | #233 | Tragic 12.5% |
| Scandinavians | 5.3 /100 | #234 | Tragic 12.5% |
| Malaysians | 5.0 /100 | #235 | Tragic 12.5% |
| Immigrants | West Indies | 4.4 /100 | #236 | Tragic 12.6% |
| Slavs | 3.8 /100 | #237 | Tragic 12.6% |
| Yugoslavians | 3.7 /100 | #238 | Tragic 12.6% |
| Barbadians | 3.6 /100 | #239 | Tragic 12.6% |
| German Russians | 3.2 /100 | #240 | Tragic 12.6% |
| Japanese | 2.7 /100 | #241 | Tragic 12.6% |
| Canadians | 2.6 /100 | #242 | Tragic 12.6% |
| Immigrants | Senegal | 2.5 /100 | #243 | Tragic 12.6% |
| Alsatians | 2.5 /100 | #244 | Tragic 12.6% |
Demographics Similar to Lithuanians by Female Disability
In terms of female disability, the demographic groups most similar to Lithuanians are Immigrants from Latin America (12.2%, a difference of 0.020%), Immigrants from Haiti (12.2%, a difference of 0.030%), Lebanese (12.2%, a difference of 0.050%), Immigrants from Oceania (12.1%, a difference of 0.090%), and Maltese (12.2%, a difference of 0.10%).
| Demographics | Rating | Rank | Female Disability |
| Immigrants | Central America | 67.7 /100 | #159 | Good 12.1% |
| Immigrants | Guatemala | 66.0 /100 | #160 | Good 12.1% |
| Guyanese | 64.7 /100 | #161 | Good 12.1% |
| Immigrants | Ukraine | 64.3 /100 | #162 | Good 12.1% |
| Guatemalans | 63.8 /100 | #163 | Good 12.1% |
| Czechs | 63.6 /100 | #164 | Good 12.1% |
| Immigrants | Oceania | 61.8 /100 | #165 | Good 12.1% |
| Lithuanians | 59.5 /100 | #166 | Average 12.2% |
| Immigrants | Latin America | 59.0 /100 | #167 | Average 12.2% |
| Immigrants | Haiti | 58.8 /100 | #168 | Average 12.2% |
| Lebanese | 58.1 /100 | #169 | Average 12.2% |
| Maltese | 57.0 /100 | #170 | Average 12.2% |
| Immigrants | Southern Europe | 56.3 /100 | #171 | Average 12.2% |
| Haitians | 51.9 /100 | #172 | Average 12.2% |
| Immigrants | Mexico | 50.8 /100 | #173 | Average 12.2% |