Russian Male Disability
COMPARE
Russian
Select to Compare
Male Disability
Russian Male Disability
11.1%
DISABILITY | MALES
69.8/ 100
METRIC RATING
156th/ 347
METRIC RANK
Russian Male Disability Correlation Chart
The statistical analysis conducted on geographies consisting of 512,092,434 people shows a significant positive correlation between the proportion of Russians and percentage of males with a disability in the United States with a correlation coefficient (R) of 0.629 and weighted average of 11.1%. On average, for every 1% (one percent) increase in Russians within a typical geography, there is an increase of 0.80% in percentage of males with a disability.
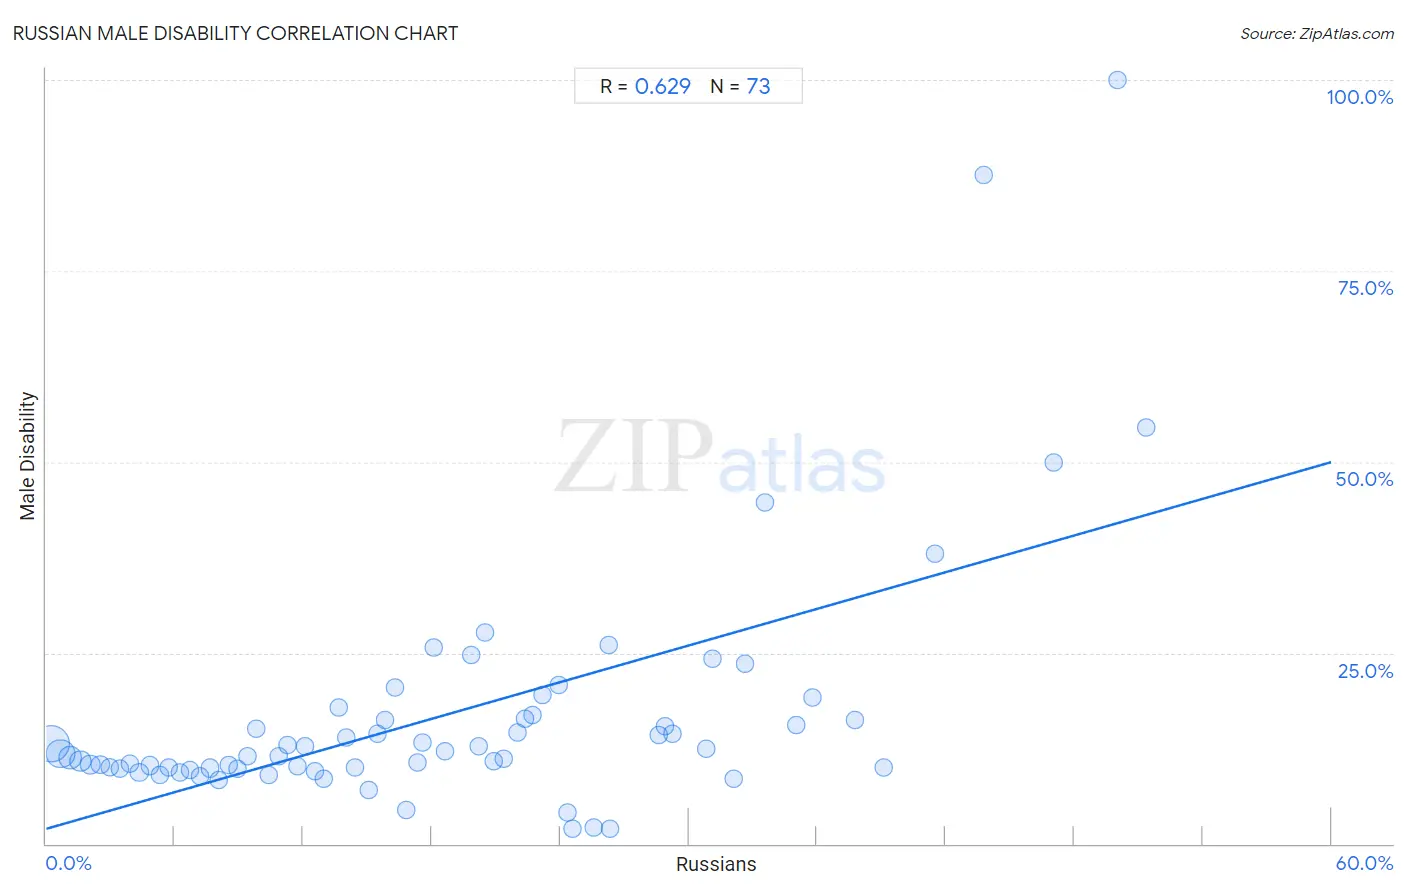
It is essential to understand that the correlation between the percentage of Russians and percentage of males with a disability does not imply a direct cause-and-effect relationship. It remains uncertain whether the presence of Russians influences an upward or downward trend in the level of percentage of males with a disability within an area, or if Russians simply ended up residing in those areas with higher or lower levels of percentage of males with a disability due to other factors.
Demographics Similar to Russians by Male Disability
In terms of male disability, the demographic groups most similar to Russians are Immigrants from Western Africa (11.1%, a difference of 0.040%), Immigrants from Middle Africa (11.1%, a difference of 0.070%), Latvian (11.1%, a difference of 0.11%), Guatemalan (11.1%, a difference of 0.17%), and Immigrants from Moldova (11.1%, a difference of 0.21%).
| Demographics | Rating | Rank | Male Disability |
| Immigrants from Denmark | 76.4 /100 | #149 | Good 11.0% |
| Immigrants from Guatemala | 75.1 /100 | #150 | Good 11.0% |
| Cubans | 74.9 /100 | #151 | Good 11.0% |
| Immigrants from Albania | 74.4 /100 | #152 | Good 11.0% |
| Immigrants from Northern Europe | 73.2 /100 | #153 | Good 11.1% |
| Immigrants from Moldova | 72.8 /100 | #154 | Good 11.1% |
| Immigrants from Middle Africa | 70.9 /100 | #155 | Good 11.1% |
| Russians | 69.8 /100 | #156 | Good 11.1% |
| Immigrants from Western Africa | 69.2 /100 | #157 | Good 11.1% |
| Latvians | 68.1 /100 | #158 | Good 11.1% |
| Guatemalans | 67.2 /100 | #159 | Good 11.1% |
| Albanians | 66.5 /100 | #160 | Good 11.1% |
| Immigrants from West Indies | 65.7 /100 | #161 | Good 11.1% |
| Immigrants from Haiti | 65.3 /100 | #162 | Good 11.1% |
| Immigrants from Kenya | 63.8 /100 | #163 | Good 11.1% |
Russian Male Disability Correlation Summary
| Measurement | Russian Data | Male Disability Data |
| Minimum | 0.22% | 2.0% |
| Maximum | 51.4% | 100.0% |
| Range | 51.2% | 98.0% |
| Mean | 18.6% | 16.8% |
| Median | 16.8% | 11.8% |
| Interquartile 25% (IQ1) | 8.3% | 9.9% |
| Interquartile 75% (IQ3) | 26.3% | 16.7% |
| Interquartile Range (IQR) | 18.0% | 6.8% |
| Standard Deviation (Sample) | 12.7% | 16.2% |
| Standard Deviation (Population) | 12.6% | 16.1% |
Correlation Details
| Russian Percentile | Sample Size | Male Disability |
[ 0.0% - 0.5% ] 0.22% | 235,415,420 | 13.1% |
[ 0.5% - 1.0% ] 0.67% | 127,160,421 | 11.8% |
[ 1.0% - 1.5% ] 1.12% | 59,133,687 | 11.3% |
[ 1.5% - 2.0% ] 1.60% | 36,195,778 | 10.8% |
[ 2.0% - 2.5% ] 2.07% | 25,040,458 | 10.3% |
[ 2.5% - 3.0% ] 2.51% | 8,433,610 | 10.4% |
[ 2.5% - 3.0% ] 2.98% | 5,722,681 | 10.0% |
[ 3.0% - 3.5% ] 3.44% | 3,356,602 | 9.8% |
[ 3.5% - 4.0% ] 3.92% | 2,494,002 | 10.5% |
[ 4.0% - 4.5% ] 4.34% | 2,291,328 | 9.4% |
[ 4.5% - 5.0% ] 4.82% | 1,270,629 | 10.2% |
[ 5.0% - 5.5% ] 5.30% | 1,320,871 | 8.9% |
[ 5.5% - 6.0% ] 5.73% | 753,234 | 10.0% |
[ 6.0% - 6.5% ] 6.23% | 784,893 | 9.4% |
[ 6.5% - 7.0% ] 6.71% | 629,643 | 9.6% |
[ 7.0% - 7.5% ] 7.18% | 392,151 | 8.9% |
[ 7.5% - 8.0% ] 7.63% | 465,019 | 9.9% |
[ 8.0% - 8.5% ] 8.08% | 297,092 | 8.4% |
[ 8.0% - 8.5% ] 8.49% | 120,288 | 10.4% |
[ 8.5% - 9.0% ] 8.91% | 226,194 | 9.8% |
[ 9.0% - 9.5% ] 9.39% | 151,494 | 11.4% |
[ 9.5% - 10.0% ] 9.80% | 88,464 | 15.0% |
[ 10.0% - 10.5% ] 10.39% | 62,390 | 9.1% |
[ 10.5% - 11.0% ] 10.88% | 28,302 | 11.4% |
[ 11.0% - 11.5% ] 11.29% | 28,545 | 12.9% |
[ 11.5% - 12.0% ] 11.76% | 14,405 | 10.2% |
[ 12.0% - 12.5% ] 12.07% | 32,989 | 12.8% |
[ 12.5% - 13.0% ] 12.54% | 4,475 | 9.5% |
[ 12.5% - 13.0% ] 12.93% | 13,967 | 8.5% |
[ 13.5% - 14.0% ] 13.65% | 4,088 | 17.9% |
[ 14.0% - 14.5% ] 14.01% | 16,287 | 13.9% |
[ 14.0% - 14.5% ] 14.45% | 13,894 | 10.0% |
[ 15.0% - 15.5% ] 15.08% | 7,202 | 7.0% |
[ 15.0% - 15.5% ] 15.49% | 1,504 | 14.4% |
[ 15.5% - 16.0% ] 15.82% | 5,555 | 16.2% |
[ 16.0% - 16.5% ] 16.30% | 2,717 | 20.5% |
[ 16.5% - 17.0% ] 16.83% | 4,873 | 4.4% |
[ 17.0% - 17.5% ] 17.31% | 2,606 | 10.6% |
[ 17.5% - 18.0% ] 17.60% | 83,069 | 13.3% |
[ 18.0% - 18.5% ] 18.11% | 370 | 25.7% |
[ 18.5% - 19.0% ] 18.61% | 2,289 | 12.0% |
[ 19.5% - 20.0% ] 19.83% | 237 | 24.8% |
[ 20.0% - 20.5% ] 20.21% | 2,108 | 12.7% |
[ 20.0% - 20.5% ] 20.47% | 2,779 | 27.6% |
[ 20.5% - 21.0% ] 20.92% | 980 | 10.9% |
[ 21.0% - 21.5% ] 21.36% | 618 | 11.1% |
[ 21.5% - 22.0% ] 22.00% | 441 | 14.6% |
[ 22.0% - 22.5% ] 22.33% | 2,517 | 16.4% |
[ 22.5% - 23.0% ] 22.68% | 291 | 16.9% |
[ 23.0% - 23.5% ] 23.19% | 789 | 19.4% |
[ 23.5% - 24.0% ] 23.95% | 526 | 20.8% |
[ 24.0% - 24.5% ] 24.35% | 115 | 4.2% |
[ 24.5% - 25.0% ] 24.57% | 867 | 2.0% |
[ 25.5% - 26.0% ] 25.55% | 364 | 2.2% |
[ 26.0% - 26.5% ] 26.24% | 724 | 26.0% |
[ 26.0% - 26.5% ] 26.35% | 353 | 2.0% |
[ 28.5% - 29.0% ] 28.57% | 56 | 14.3% |
[ 28.5% - 29.0% ] 28.89% | 90 | 15.4% |
[ 29.0% - 29.5% ] 29.23% | 1,683 | 14.4% |
[ 30.5% - 31.0% ] 30.83% | 120 | 12.5% |
[ 31.0% - 31.5% ] 31.13% | 681 | 24.3% |
[ 32.0% - 32.5% ] 32.12% | 137 | 8.5% |
[ 32.5% - 33.0% ] 32.61% | 92 | 23.5% |
[ 33.5% - 34.0% ] 33.54% | 319 | 44.7% |
[ 34.5% - 35.0% ] 35.00% | 640 | 15.6% |
[ 35.5% - 36.0% ] 35.79% | 95 | 19.1% |
[ 37.5% - 38.0% ] 37.74% | 106 | 16.3% |
[ 39.0% - 39.5% ] 39.12% | 979 | 10.0% |
[ 41.0% - 41.5% ] 41.49% | 94 | 37.9% |
[ 43.5% - 44.0% ] 43.75% | 16 | 87.5% |
[ 47.0% - 47.5% ] 47.06% | 51 | 50.0% |
[ 50.0% - 50.5% ] 50.00% | 8 | 100.0% |
[ 51.0% - 51.5% ] 51.39% | 72 | 54.5% |