Ottawa 4 or more Vehicles in Household
COMPARE
Ottawa
Select to Compare
4 or more Vehicles in Household
Ottawa 4 or more Vehicles in Household
6.6%
4+ VEHICLES AVAILABLE
86.9/ 100
METRIC RATING
134th/ 347
METRIC RANK
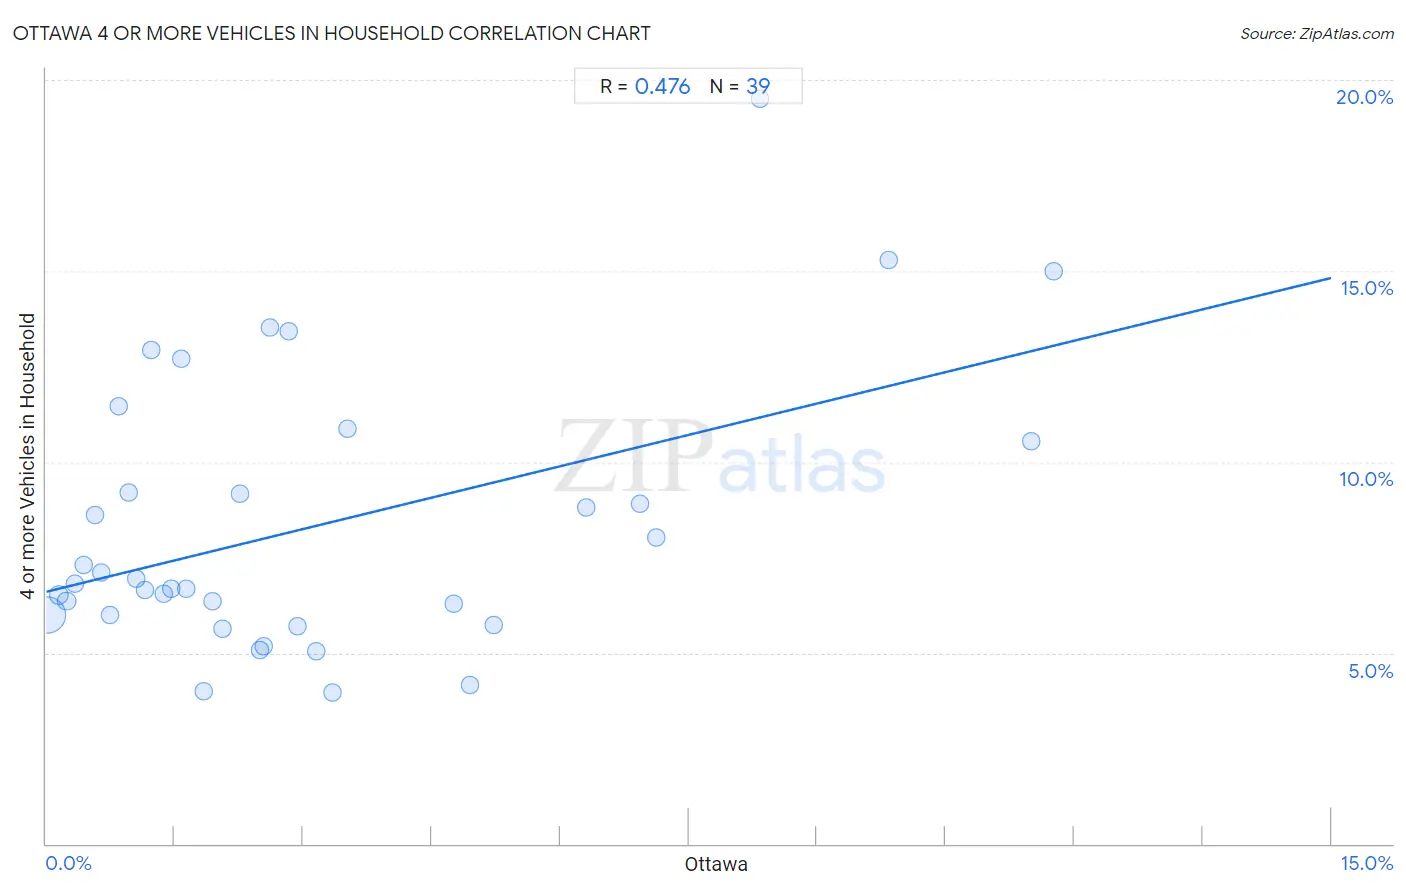
Ottawa 4 or more Vehicles in Household Correlation Chart
The statistical analysis conducted on geographies consisting of 49,927,174 people shows a moderate positive correlation between the proportion of Ottawa and percentage of households with 4 or more vehicles available in the United States with a correlation coefficient (R) of 0.476 and weighted average of 6.6%. On average, for every 1% (one percent) increase in Ottawa within a typical geography, there is an increase of 0.55% in percentage of households with 4 or more vehicles available.
It is essential to understand that the correlation between the percentage of Ottawa and percentage of households with 4 or more vehicles available does not imply a direct cause-and-effect relationship. It remains uncertain whether the presence of Ottawa influences an upward or downward trend in the level of percentage of households with 4 or more vehicles available within an area, or if Ottawa simply ended up residing in those areas with higher or lower levels of percentage of households with 4 or more vehicles available due to other factors.
Demographics Similar to Ottawa by 4 or more Vehicles in Household
In terms of 4 or more vehicles in household, the demographic groups most similar to Ottawa are Armenian (6.6%, a difference of 0.020%), Tohono O'odham (6.6%, a difference of 0.030%), Luxembourger (6.6%, a difference of 0.10%), Immigrants from Netherlands (6.6%, a difference of 0.21%), and French Canadian (6.6%, a difference of 0.30%).
| Demographics | Rating | Rank | 4 or more Vehicles in Household |
| Immigrants from Korea | 93.8 /100 | #127 | Exceptional 6.8% |
| Immigrants from Bolivia | 92.5 /100 | #128 | Exceptional 6.7% |
| Immigrants from England | 92.0 /100 | #129 | Exceptional 6.7% |
| Immigrants from Scotland | 89.0 /100 | #130 | Excellent 6.7% |
| Maltese | 88.4 /100 | #131 | Excellent 6.7% |
| Immigrants from Netherlands | 87.8 /100 | #132 | Excellent 6.6% |
| Armenians | 86.9 /100 | #133 | Excellent 6.6% |
| Ottawa | 86.9 /100 | #134 | Excellent 6.6% |
| Tohono O'odham | 86.7 /100 | #135 | Excellent 6.6% |
| Luxembourgers | 86.4 /100 | #136 | Excellent 6.6% |
| French Canadians | 85.4 /100 | #137 | Excellent 6.6% |
| Italians | 84.5 /100 | #138 | Excellent 6.6% |
| Jordanians | 82.1 /100 | #139 | Excellent 6.6% |
| Slavs | 81.6 /100 | #140 | Excellent 6.6% |
| Australians | 80.8 /100 | #141 | Excellent 6.6% |
Ottawa 4 or more Vehicles in Household Correlation Summary
| Measurement | Ottawa Data | 4 or more Vehicles in Household Data |
| Minimum | 0.015% | 4.0% |
| Maximum | 11.8% | 19.5% |
| Range | 11.7% | 15.6% |
| Mean | 3.1% | 8.3% |
| Median | 2.1% | 6.8% |
| Interquartile 25% (IQ1) | 0.96% | 6.0% |
| Interquartile 75% (IQ3) | 4.8% | 10.5% |
| Interquartile Range (IQR) | 3.8% | 4.5% |
| Standard Deviation (Sample) | 3.1% | 3.6% |
| Standard Deviation (Population) | 3.1% | 3.5% |
Correlation Details
| Ottawa Percentile | Sample Size | 4 or more Vehicles in Household |
[ 0.0% - 0.5% ] 0.015% | 45,123,126 | 6.0% |
[ 0.0% - 0.5% ] 0.14% | 2,781,381 | 6.5% |
[ 0.0% - 0.5% ] 0.24% | 896,441 | 6.4% |
[ 0.0% - 0.5% ] 0.34% | 466,858 | 6.8% |
[ 0.0% - 0.5% ] 0.43% | 161,467 | 7.3% |
[ 0.5% - 1.0% ] 0.57% | 64,876 | 8.6% |
[ 0.5% - 1.0% ] 0.64% | 95,463 | 7.1% |
[ 0.5% - 1.0% ] 0.74% | 113,052 | 6.0% |
[ 0.5% - 1.0% ] 0.85% | 32,974 | 11.5% |
[ 0.5% - 1.0% ] 0.96% | 7,927 | 9.2% |
[ 1.0% - 1.5% ] 1.06% | 14,002 | 6.9% |
[ 1.0% - 1.5% ] 1.15% | 40,270 | 6.6% |
[ 1.0% - 1.5% ] 1.22% | 4,430 | 12.9% |
[ 1.0% - 1.5% ] 1.37% | 28,621 | 6.6% |
[ 1.0% - 1.5% ] 1.47% | 5,390 | 6.7% |
[ 1.5% - 2.0% ] 1.58% | 17,158 | 12.7% |
[ 1.5% - 2.0% ] 1.63% | 4,663 | 6.7% |
[ 1.5% - 2.0% ] 1.84% | 7,814 | 4.0% |
[ 1.5% - 2.0% ] 1.94% | 16,072 | 6.4% |
[ 2.0% - 2.5% ] 2.05% | 1,948 | 5.6% |
[ 2.0% - 2.5% ] 2.27% | 10,676 | 9.2% |
[ 2.0% - 2.5% ] 2.50% | 6,248 | 5.1% |
[ 2.5% - 3.0% ] 2.53% | 474 | 5.2% |
[ 2.5% - 3.0% ] 2.62% | 382 | 13.5% |
[ 2.5% - 3.0% ] 2.83% | 636 | 13.4% |
[ 2.5% - 3.0% ] 2.93% | 5,148 | 5.7% |
[ 3.0% - 3.5% ] 3.15% | 6,894 | 5.0% |
[ 3.0% - 3.5% ] 3.35% | 1,105 | 4.0% |
[ 3.5% - 4.0% ] 3.52% | 1,991 | 10.9% |
[ 4.5% - 5.0% ] 4.76% | 4,857 | 6.3% |
[ 4.5% - 5.0% ] 4.95% | 202 | 4.2% |
[ 5.0% - 5.5% ] 5.22% | 862 | 5.7% |
[ 6.0% - 6.5% ] 6.30% | 1,031 | 8.8% |
[ 6.5% - 7.0% ] 6.93% | 1,415 | 8.9% |
[ 7.0% - 7.5% ] 7.11% | 759 | 8.0% |
[ 8.0% - 8.5% ] 8.33% | 84 | 19.5% |
[ 9.5% - 10.0% ] 9.83% | 356 | 15.3% |
[ 11.0% - 11.5% ] 11.49% | 87 | 10.5% |
[ 11.5% - 12.0% ] 11.76% | 34 | 15.0% |