Ottawa GED/Equivalency
COMPARE
Ottawa
Select to Compare
GED/Equivalency
Ottawa GED/Equivalency
85.8%
GED/EQUIVALENCY
50.0/ 100
METRIC RATING
174th/ 347
METRIC RANK
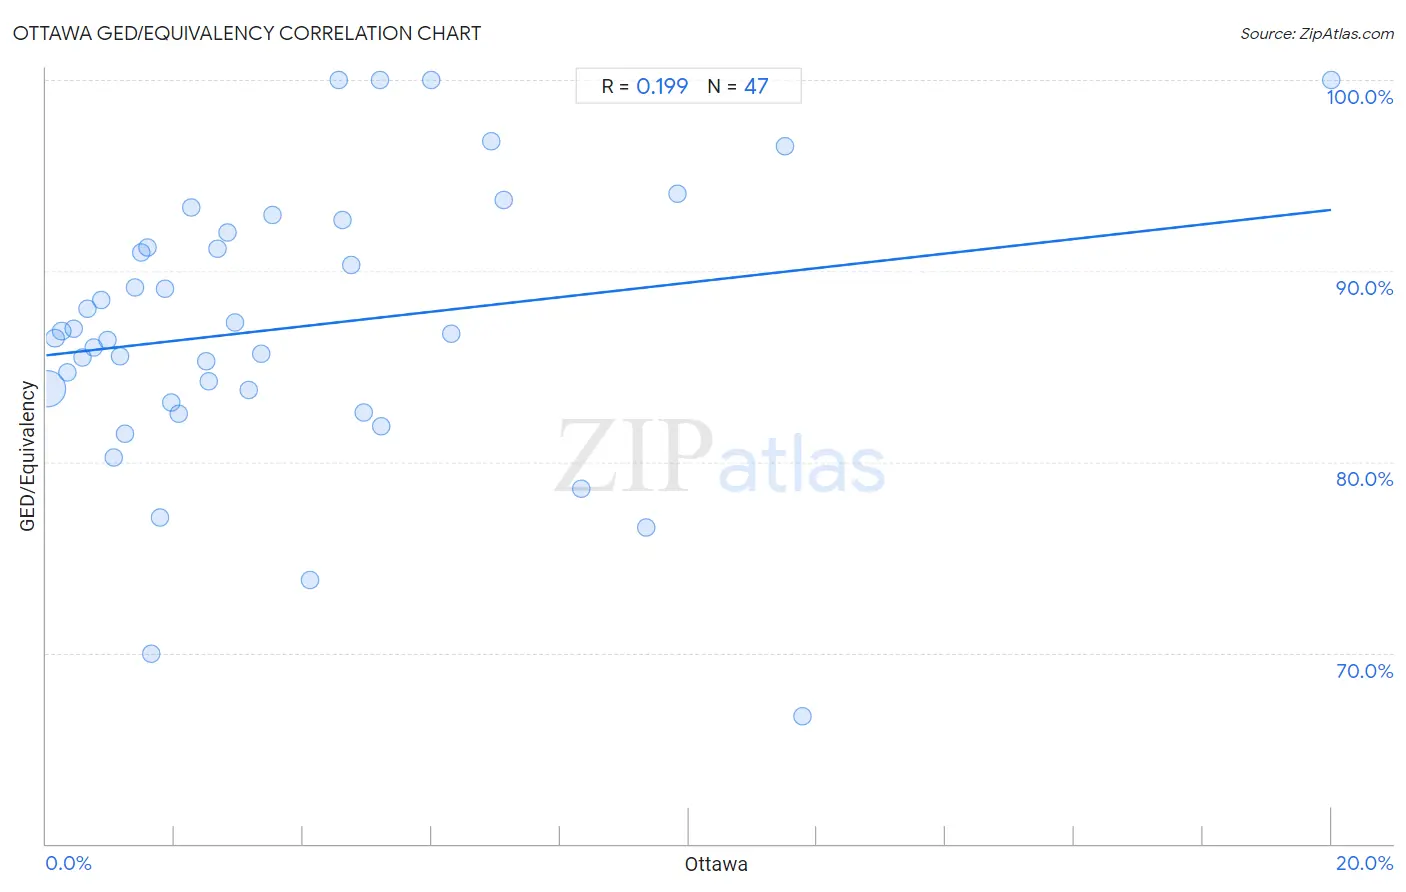
Ottawa GED/Equivalency Correlation Chart
The statistical analysis conducted on geographies consisting of 49,956,602 people shows a poor positive correlation between the proportion of Ottawa and percentage of population with at least ged/equivalency education in the United States with a correlation coefficient (R) of 0.199 and weighted average of 85.8%. On average, for every 1% (one percent) increase in Ottawa within a typical geography, there is an increase of 0.38% in percentage of population with at least ged/equivalency education.
It is essential to understand that the correlation between the percentage of Ottawa and percentage of population with at least ged/equivalency education does not imply a direct cause-and-effect relationship. It remains uncertain whether the presence of Ottawa influences an upward or downward trend in the level of percentage of population with at least ged/equivalency education within an area, or if Ottawa simply ended up residing in those areas with higher or lower levels of percentage of population with at least ged/equivalency education due to other factors.
Demographics Similar to Ottawa by GED/Equivalency
In terms of ged/equivalency, the demographic groups most similar to Ottawa are Immigrants from Bolivia (85.8%, a difference of 0.0%), Immigrants from Venezuela (85.8%, a difference of 0.010%), Immigrants from Eastern Africa (85.7%, a difference of 0.050%), Bermudan (85.8%, a difference of 0.10%), and Immigrants from Uganda (85.7%, a difference of 0.10%).
| Demographics | Rating | Rank | GED/Equivalency |
| Ethiopians | 63.7 /100 | #167 | Good 86.0% |
| Sierra Leoneans | 61.8 /100 | #168 | Good 86.0% |
| Immigrants from Ethiopia | 61.2 /100 | #169 | Good 86.0% |
| Afghans | 59.7 /100 | #170 | Average 85.9% |
| Immigrants from Chile | 57.3 /100 | #171 | Average 85.9% |
| Bermudans | 55.1 /100 | #172 | Average 85.8% |
| Immigrants from Venezuela | 50.7 /100 | #173 | Average 85.8% |
| Ottawa | 50.0 /100 | #174 | Average 85.8% |
| Immigrants from Bolivia | 49.8 /100 | #175 | Average 85.8% |
| Immigrants from Eastern Africa | 47.7 /100 | #176 | Average 85.7% |
| Immigrants from Uganda | 45.2 /100 | #177 | Average 85.7% |
| Koreans | 41.2 /100 | #178 | Average 85.6% |
| Aleuts | 40.5 /100 | #179 | Average 85.6% |
| Immigrants from Southern Europe | 38.4 /100 | #180 | Fair 85.5% |
| Moroccans | 37.7 /100 | #181 | Fair 85.5% |
Ottawa GED/Equivalency Correlation Summary
| Measurement | Ottawa Data | GED/Equivalency Data |
| Minimum | 0.015% | 66.7% |
| Maximum | 20.0% | 100.0% |
| Range | 20.0% | 33.3% |
| Mean | 3.8% | 87.0% |
| Median | 2.5% | 86.7% |
| Interquartile 25% (IQ1) | 1.1% | 83.1% |
| Interquartile 75% (IQ3) | 5.2% | 92.0% |
| Interquartile Range (IQR) | 4.1% | 8.9% |
| Standard Deviation (Sample) | 3.9% | 7.4% |
| Standard Deviation (Population) | 3.8% | 7.3% |
Correlation Details
| Ottawa Percentile | Sample Size | GED/Equivalency |
[ 0.0% - 0.5% ] 0.015% | 45,132,321 | 83.8% |
[ 0.0% - 0.5% ] 0.14% | 2,793,359 | 86.5% |
[ 0.0% - 0.5% ] 0.24% | 897,369 | 86.8% |
[ 0.0% - 0.5% ] 0.34% | 468,185 | 84.7% |
[ 0.0% - 0.5% ] 0.43% | 161,467 | 87.0% |
[ 0.5% - 1.0% ] 0.57% | 64,876 | 85.5% |
[ 0.5% - 1.0% ] 0.64% | 95,463 | 88.0% |
[ 0.5% - 1.0% ] 0.74% | 113,052 | 86.0% |
[ 0.5% - 1.0% ] 0.85% | 32,974 | 88.5% |
[ 0.5% - 1.0% ] 0.96% | 7,927 | 86.4% |
[ 1.0% - 1.5% ] 1.06% | 14,298 | 80.3% |
[ 1.0% - 1.5% ] 1.15% | 40,270 | 85.6% |
[ 1.0% - 1.5% ] 1.22% | 4,430 | 81.4% |
[ 1.0% - 1.5% ] 1.37% | 28,621 | 89.2% |
[ 1.0% - 1.5% ] 1.47% | 7,800 | 90.9% |
[ 1.5% - 2.0% ] 1.58% | 17,158 | 91.2% |
[ 1.5% - 2.0% ] 1.63% | 4,663 | 69.9% |
[ 1.5% - 2.0% ] 1.77% | 113 | 77.1% |
[ 1.5% - 2.0% ] 1.84% | 7,814 | 89.0% |
[ 1.5% - 2.0% ] 1.94% | 16,072 | 83.1% |
[ 2.0% - 2.5% ] 2.05% | 1,948 | 82.5% |
[ 2.0% - 2.5% ] 2.27% | 11,209 | 93.3% |
[ 2.0% - 2.5% ] 2.50% | 6,248 | 85.3% |
[ 2.5% - 3.0% ] 2.53% | 474 | 84.3% |
[ 2.5% - 3.0% ] 2.67% | 1,274 | 91.1% |
[ 2.5% - 3.0% ] 2.83% | 636 | 92.0% |
[ 2.5% - 3.0% ] 2.93% | 5,148 | 87.3% |
[ 3.0% - 3.5% ] 3.15% | 6,894 | 83.8% |
[ 3.0% - 3.5% ] 3.35% | 1,105 | 85.7% |
[ 3.5% - 4.0% ] 3.52% | 1,991 | 93.0% |
[ 4.0% - 4.5% ] 4.10% | 390 | 73.8% |
[ 4.5% - 5.0% ] 4.56% | 351 | 100.0% |
[ 4.5% - 5.0% ] 4.62% | 368 | 92.7% |
[ 4.5% - 5.0% ] 4.76% | 4,857 | 90.3% |
[ 4.5% - 5.0% ] 4.95% | 202 | 82.6% |
[ 5.0% - 5.5% ] 5.20% | 250 | 100.0% |
[ 5.0% - 5.5% ] 5.22% | 862 | 81.9% |
[ 5.5% - 6.0% ] 5.99% | 267 | 100.0% |
[ 6.0% - 6.5% ] 6.30% | 1,031 | 86.7% |
[ 6.5% - 7.0% ] 6.93% | 1,415 | 96.8% |
[ 7.0% - 7.5% ] 7.11% | 759 | 93.7% |
[ 8.0% - 8.5% ] 8.33% | 84 | 78.6% |
[ 9.0% - 9.5% ] 9.33% | 75 | 76.6% |
[ 9.5% - 10.0% ] 9.83% | 356 | 94.1% |
[ 11.0% - 11.5% ] 11.49% | 87 | 96.6% |
[ 11.5% - 12.0% ] 11.76% | 34 | 66.7% |
[ 20.0% - 20.5% ] 20.00% | 55 | 100.0% |