Ottawa Married-couple Households
COMPARE
Ottawa
Select to Compare
Married-couple Households
Ottawa Married-couple Households
45.8%
MARRIED-COUPLE HOUSEHOLDS
19.4/ 100
METRIC RATING
198th/ 347
METRIC RANK
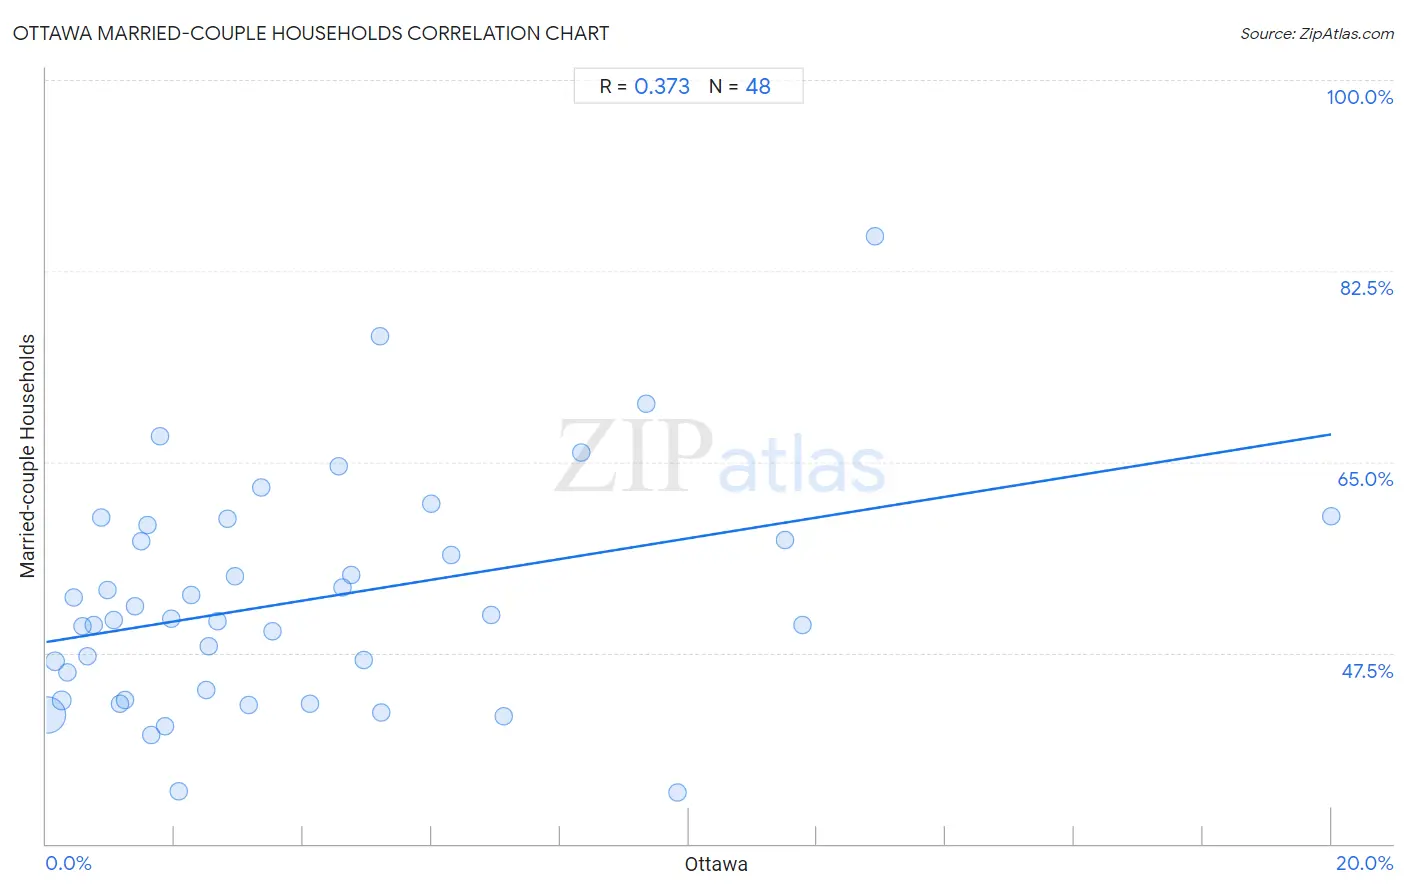
Ottawa Married-couple Households Correlation Chart
The statistical analysis conducted on geographies consisting of 49,944,544 people shows a mild positive correlation between the proportion of Ottawa and percentage of married-couple family households in the United States with a correlation coefficient (R) of 0.373 and weighted average of 45.8%. On average, for every 1% (one percent) increase in Ottawa within a typical geography, there is an increase of 0.95% in percentage of married-couple family households.
It is essential to understand that the correlation between the percentage of Ottawa and percentage of married-couple family households does not imply a direct cause-and-effect relationship. It remains uncertain whether the presence of Ottawa influences an upward or downward trend in the level of percentage of married-couple family households within an area, or if Ottawa simply ended up residing in those areas with higher or lower levels of percentage of married-couple family households due to other factors.
Demographics Similar to Ottawa by Married-couple Households
In terms of married-couple households, the demographic groups most similar to Ottawa are Cambodian (45.9%, a difference of 0.11%), Immigrants from South America (45.9%, a difference of 0.16%), Chickasaw (45.9%, a difference of 0.19%), Mexican American Indian (45.9%, a difference of 0.22%), and Taiwanese (45.9%, a difference of 0.23%).
| Demographics | Rating | Rank | Married-couple Households |
| Choctaw | 24.9 /100 | #191 | Fair 46.0% |
| Immigrants from Northern Africa | 24.6 /100 | #192 | Fair 46.0% |
| Taiwanese | 23.4 /100 | #193 | Fair 45.9% |
| Mexican American Indians | 23.3 /100 | #194 | Fair 45.9% |
| Chickasaw | 22.7 /100 | #195 | Fair 45.9% |
| Immigrants from South America | 22.2 /100 | #196 | Fair 45.9% |
| Cambodians | 21.3 /100 | #197 | Fair 45.9% |
| Ottawa | 19.4 /100 | #198 | Poor 45.8% |
| Carpatho Rusyns | 15.7 /100 | #199 | Poor 45.7% |
| Potawatomi | 15.6 /100 | #200 | Poor 45.7% |
| Immigrants from Serbia | 15.2 /100 | #201 | Poor 45.7% |
| Immigrants from Central America | 14.2 /100 | #202 | Poor 45.7% |
| Alaska Natives | 13.0 /100 | #203 | Poor 45.6% |
| Aleuts | 12.5 /100 | #204 | Poor 45.6% |
| Nepalese | 11.9 /100 | #205 | Poor 45.6% |
Ottawa Married-couple Households Correlation Summary
| Measurement | Ottawa Data | Married-couple Households Data |
| Minimum | 0.015% | 34.7% |
| Maximum | 20.0% | 85.7% |
| Range | 20.0% | 51.0% |
| Mean | 4.0% | 52.3% |
| Median | 2.6% | 50.5% |
| Interquartile 25% (IQ1) | 1.2% | 43.7% |
| Interquartile 75% (IQ3) | 5.2% | 58.6% |
| Interquartile Range (IQR) | 4.0% | 14.9% |
| Standard Deviation (Sample) | 4.0% | 10.3% |
| Standard Deviation (Population) | 4.0% | 10.2% |
Correlation Details
| Ottawa Percentile | Sample Size | Married-couple Households |
[ 0.0% - 0.5% ] 0.015% | 45,132,321 | 41.8% |
[ 0.0% - 0.5% ] 0.14% | 2,782,504 | 46.7% |
[ 0.0% - 0.5% ] 0.24% | 897,369 | 43.1% |
[ 0.0% - 0.5% ] 0.34% | 466,858 | 45.7% |
[ 0.0% - 0.5% ] 0.43% | 161,467 | 52.6% |
[ 0.5% - 1.0% ] 0.57% | 64,876 | 50.0% |
[ 0.5% - 1.0% ] 0.64% | 95,463 | 47.2% |
[ 0.5% - 1.0% ] 0.74% | 113,052 | 50.1% |
[ 0.5% - 1.0% ] 0.85% | 32,974 | 59.8% |
[ 0.5% - 1.0% ] 0.96% | 7,927 | 53.3% |
[ 1.0% - 1.5% ] 1.06% | 14,298 | 50.5% |
[ 1.0% - 1.5% ] 1.15% | 40,270 | 42.8% |
[ 1.0% - 1.5% ] 1.22% | 4,430 | 43.2% |
[ 1.0% - 1.5% ] 1.37% | 28,621 | 51.8% |
[ 1.0% - 1.5% ] 1.47% | 7,800 | 57.7% |
[ 1.5% - 2.0% ] 1.58% | 17,158 | 59.2% |
[ 1.5% - 2.0% ] 1.63% | 4,663 | 40.0% |
[ 1.5% - 2.0% ] 1.77% | 113 | 67.3% |
[ 1.5% - 2.0% ] 1.84% | 7,814 | 40.8% |
[ 1.5% - 2.0% ] 1.94% | 16,072 | 50.6% |
[ 2.0% - 2.5% ] 2.05% | 1,948 | 34.8% |
[ 2.0% - 2.5% ] 2.27% | 11,209 | 52.8% |
[ 2.0% - 2.5% ] 2.50% | 6,248 | 44.1% |
[ 2.5% - 3.0% ] 2.53% | 474 | 48.1% |
[ 2.5% - 3.0% ] 2.67% | 1,274 | 50.4% |
[ 2.5% - 3.0% ] 2.83% | 636 | 59.7% |
[ 2.5% - 3.0% ] 2.93% | 5,148 | 54.5% |
[ 3.0% - 3.5% ] 3.15% | 6,894 | 42.7% |
[ 3.0% - 3.5% ] 3.35% | 1,105 | 62.7% |
[ 3.5% - 4.0% ] 3.52% | 1,991 | 49.5% |
[ 4.0% - 4.5% ] 4.10% | 390 | 42.9% |
[ 4.5% - 5.0% ] 4.56% | 351 | 64.6% |
[ 4.5% - 5.0% ] 4.62% | 368 | 53.5% |
[ 4.5% - 5.0% ] 4.76% | 4,857 | 54.6% |
[ 4.5% - 5.0% ] 4.95% | 202 | 46.9% |
[ 5.0% - 5.5% ] 5.20% | 250 | 76.5% |
[ 5.0% - 5.5% ] 5.22% | 862 | 42.1% |
[ 5.5% - 6.0% ] 5.99% | 267 | 61.2% |
[ 6.0% - 6.5% ] 6.30% | 1,031 | 56.4% |
[ 6.5% - 7.0% ] 6.93% | 1,415 | 51.0% |
[ 7.0% - 7.5% ] 7.11% | 759 | 41.7% |
[ 8.0% - 8.5% ] 8.33% | 84 | 65.9% |
[ 9.0% - 9.5% ] 9.33% | 75 | 70.3% |
[ 9.5% - 10.0% ] 9.83% | 356 | 34.7% |
[ 11.0% - 11.5% ] 11.49% | 87 | 57.9% |
[ 11.5% - 12.0% ] 11.76% | 34 | 50.0% |
[ 12.5% - 13.0% ] 12.90% | 124 | 85.7% |
[ 20.0% - 20.5% ] 20.00% | 55 | 60.0% |