Ottawa Receiving Food Stamps

COMPARE

Ottawa
Race
Ancestry
AfghanAfricanAlaska NativeAlaskan AthabascanAlbanianAleutAlsatianAmericanApacheArabArapahoArgentineanArmenianAssyrian/Chaldean/SyriacAustralianAustrianBahamianBangladeshiBarbadianBasqueBelgianBelizeanBermudanBhutaneseBlackfeetBolivianBrazilianBritishBritish West IndianBulgarianBurmeseCajunCambodianCanadianCape VerdeanCarpatho RusynCelticCentral AmericanCentral American IndianCherokeeCheyenneChickasawChileanChineseChippewaChoctawColombianColvilleComancheCosta RicanCreeCreekCroatianCrowCubanCypriotCzechCzechoslovakianDanishDelawareDominicanDutchDutch West IndianEastern EuropeanEcuadorianEgyptianEnglishEstonianEthiopianEuropeanFijianFilipinoFinnishFrenchFrench American IndianFrench CanadianGermanGerman RussianGhanaianGreekGuamanian/ChamorroGuatemalanGuyaneseHaitianHmongHonduranHopiHoumaHungarianIcelanderIndian (Asian)IndonesianInupiatIranianIraqiIrishIroquoisIsraeliItalianJamaicanJapaneseJordanianKenyanKiowaKoreanLaotianLatvianLebaneseLiberianLithuanianLumbeeLuxembourgerMacedonianMalaysianMalteseMarshalleseMenomineeMexicanMexican American IndianMongolianMoroccanNative HawaiianNavajoNepaleseNew ZealanderNicaraguanNigerianNorthern EuropeanNorwegianOkinawanOsageOttawaPaiutePakistaniPalestinianPanamanianParaguayanPennsylvania GermanPeruvianPimaPolishPortuguesePotawatomiPuebloPuerto RicanPuget Sound SalishRomanianRussianSalvadoranSamoanScandinavianScotch-IrishScottishSeminoleSenegaleseSerbianShoshoneSierra LeoneanSiouxSlavicSlovakSloveneSomaliSouth AfricanSouth AmericanSouth American IndianSoviet UnionSpaniardSpanishSpanish AmericanSpanish American IndianSri LankanSubsaharan AfricanSudaneseSwedishSwissSyrianTaiwaneseThaiTlingit-HaidaTohono O'OdhamTonganTrinidadian and TobagonianTsimshianTurkishU.S. Virgin IslanderUgandanUkrainianUruguayanUteVenezuelanVietnameseWelshWest IndianYakamaYaquiYugoslavianYumanYup'ikZimbabwean
Immigration
NonimmigrantsImmigrantsAfghanistanAfricaAlbaniaArgentinaArmeniaAsiaAustraliaAustriaBahamasBangladeshBarbadosBelarusBelgiumBelizeBoliviaBosnia and HerzegovinaBrazilBulgariaBurma/MyanmarCabo VerdeCambodiaCameroonCanadaCaribbeanCentral AmericaChileChinaColombiaCongoCosta RicaCroatiaCubaCzechoslovakiaDenmarkDominicaDominican RepublicEastern AfricaEastern AsiaEastern EuropeEcuadorEgyptEl SalvadorEnglandEritreaEthiopiaEuropeFijiFranceGermanyGhanaGreeceGrenadaGuatemalaGuyanaHaitiHondurasHong KongHungaryIndiaIndonesiaIranIraqIrelandIsraelItalyJamaicaJapanJordanKazakhstanKenyaKoreaKuwaitLaosLatin AmericaLatviaLebanonLiberiaLithuaniaMalaysiaMexicoMicronesiaMiddle AfricaMoldovaMoroccoNepalNetherlandsNicaraguaNigeriaNorth AmericaNorth MacedoniaNorthern AfricaNorthern EuropeNorwayOceaniaPakistanPanamaPeruPhilippinesPolandPortugalRomaniaRussiaSaudi ArabiaScotlandSenegalSerbiaSierra LeoneSingaporeSomaliaSouth AfricaSouth AmericaSouth Central AsiaSouth Eastern AsiaSouthern EuropeSpainSri LankaSt. Vincent and the GrenadinesSudanSwedenSwitzerlandSyriaTaiwanThailandTrinidad and TobagoTurkeyUgandaUkraineUruguayUzbekistanVenezuelaVietnamWest IndiesWestern AfricaWestern AsiaWestern EuropeYemenZaireZimbabweAzores
Select to Compare
Race
Ancestry
AfghanAfricanAlaska NativeAlaskan AthabascanAlbanianAleutAlsatianAmericanApacheArabArapahoArgentineanArmenianAssyrian/Chaldean/SyriacAustralianAustrianBahamianBangladeshiBarbadianBasqueBelgianBelizeanBermudanBhutaneseBlackfeetBolivianBrazilianBritishBritish West IndianBulgarianBurmeseCajunCambodianCanadianCape VerdeanCarpatho RusynCelticCentral AmericanCentral American IndianCherokeeCheyenneChickasawChileanChineseChippewaChoctawColombianColvilleComancheCosta RicanCreeCreekCroatianCrowCubanCypriotCzechCzechoslovakianDanishDelawareDominicanDutchDutch West IndianEastern EuropeanEcuadorianEgyptianEnglishEstonianEthiopianEuropeanFijianFilipinoFinnishFrenchFrench American IndianFrench CanadianGermanGerman RussianGhanaianGreekGuamanian/ChamorroGuatemalanGuyaneseHaitianHmongHonduranHopiHoumaHungarianIcelanderIndian (Asian)IndonesianInupiatIranianIraqiIrishIroquoisIsraeliItalianJamaicanJapaneseJordanianKenyanKiowaKoreanLaotianLatvianLebaneseLiberianLithuanianLumbeeLuxembourgerMacedonianMalaysianMalteseMarshalleseMenomineeMexicanMexican American IndianMongolianMoroccanNative HawaiianNavajoNepaleseNew ZealanderNicaraguanNigerianNorthern EuropeanNorwegianOkinawanOsagePaiutePakistaniPalestinianPanamanianParaguayanPennsylvania GermanPeruvianPimaPolishPortuguesePotawatomiPuebloPuerto RicanPuget Sound SalishRomanianRussianSalvadoranSamoanScandinavianScotch-IrishScottishSeminoleSenegaleseSerbianShoshoneSierra LeoneanSiouxSlavicSlovakSloveneSomaliSouth AfricanSouth AmericanSouth American IndianSoviet UnionSpaniardSpanishSpanish AmericanSpanish American IndianSri LankanSubsaharan AfricanSudaneseSwedishSwissSyrianTaiwaneseThaiTlingit-HaidaTohono O'OdhamTonganTrinidadian and TobagonianTsimshianTurkishU.S. Virgin IslanderUgandanUkrainianUruguayanUteVenezuelanVietnameseWelshWest IndianYakamaYaquiYugoslavianYumanYup'ikZimbabwean
Immigration
NonimmigrantsImmigrantsAfghanistanAfricaAlbaniaArgentinaArmeniaAsiaAustraliaAustriaBahamasBangladeshBarbadosBelarusBelgiumBelizeBoliviaBosnia and HerzegovinaBrazilBulgariaBurma/MyanmarCabo VerdeCambodiaCameroonCanadaCaribbeanCentral AmericaChileChinaColombiaCongoCosta RicaCroatiaCubaCzechoslovakiaDenmarkDominicaDominican RepublicEastern AfricaEastern AsiaEastern EuropeEcuadorEgyptEl SalvadorEnglandEritreaEthiopiaEuropeFijiFranceGermanyGhanaGreeceGrenadaGuatemalaGuyanaHaitiHondurasHong KongHungaryIndiaIndonesiaIranIraqIrelandIsraelItalyJamaicaJapanJordanKazakhstanKenyaKoreaKuwaitLaosLatin AmericaLatviaLebanonLiberiaLithuaniaMalaysiaMexicoMicronesiaMiddle AfricaMoldovaMoroccoNepalNetherlandsNicaraguaNigeriaNorth AmericaNorth MacedoniaNorthern AfricaNorthern EuropeNorwayOceaniaPakistanPanamaPeruPhilippinesPolandPortugalRomaniaRussiaSaudi ArabiaScotlandSenegalSerbiaSierra LeoneSingaporeSomaliaSouth AfricaSouth AmericaSouth Central AsiaSouth Eastern AsiaSouthern EuropeSpainSri LankaSt. Vincent and the GrenadinesSudanSwedenSwitzerlandSyriaTaiwanThailandTrinidad and TobagoTurkeyUgandaUkraineUruguayUzbekistanVenezuelaVietnamWest IndiesWestern AfricaWestern AsiaWestern EuropeYemenZaireZimbabweAzores
Receiving Food Stamps
Income
Poverty
Unemployment
Labor Participation
Family Structure
Vehicle Availability
Education Level
Disability

Ottawa Receiving Food Stamps
Tragic

13.1%
PUBLIC INCOME | FOOD STAMPS
3.5/ 100
METRIC RATING
229th/ 347
METRIC RANK

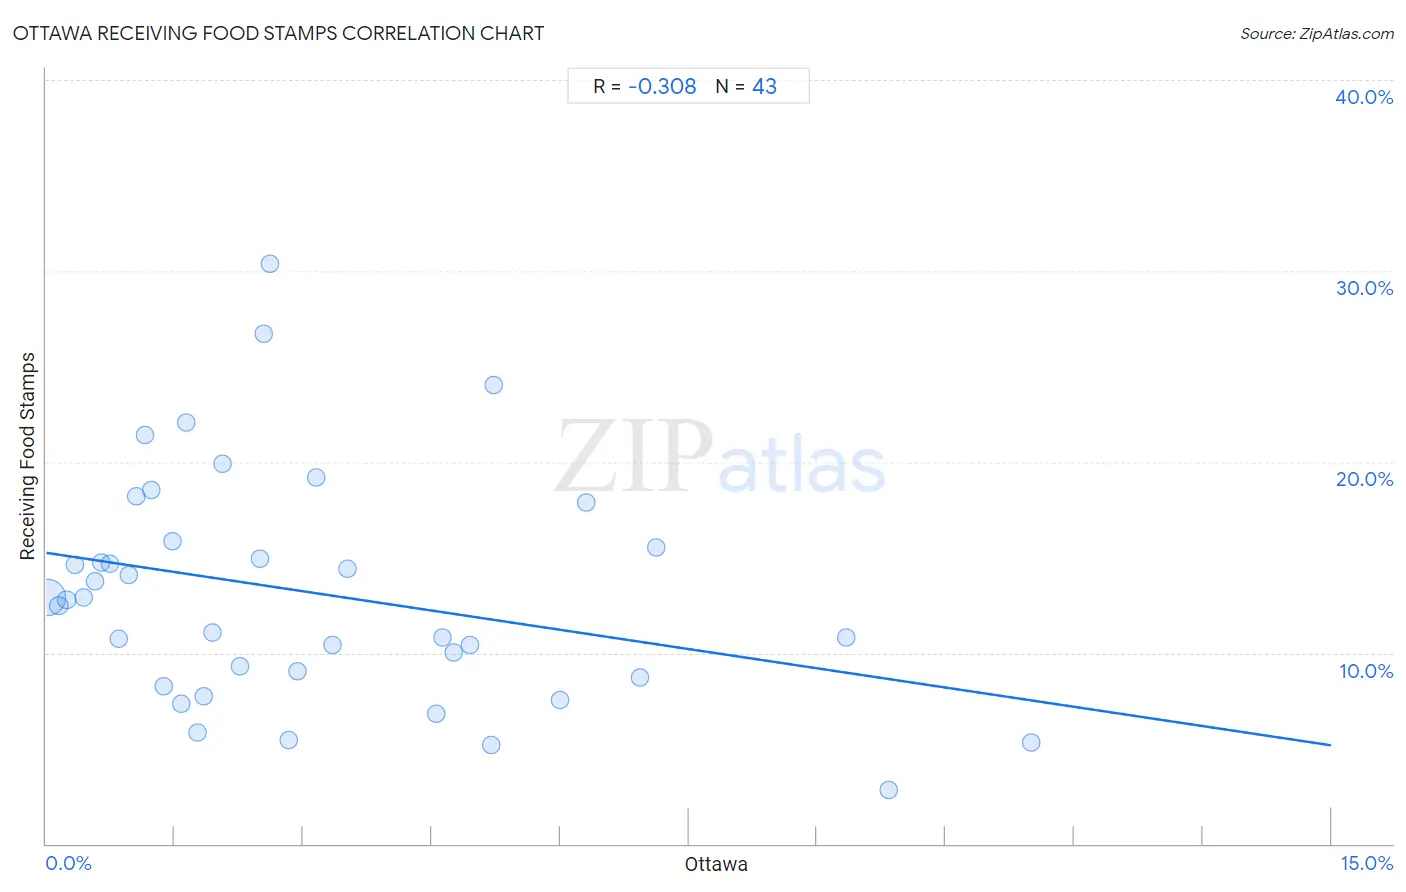
Ottawa Receiving Food Stamps Correlation Chart

The statistical analysis conducted on geographies consisting of 49,940,459 people shows a mild negative correlation between the proportion of Ottawa and percentage of population receiving government assistance and/or food stamps in the United States with a correlation coefficient (R) of -0.308 and weighted average of 13.1%. On average, for every 1% (one percent) increase in Ottawa within a typical geography, there is a decrease of 0.67% in percentage of population receiving government assistance and/or food stamps.
Ottawa Receiving Food Stamps
It is essential to understand that the correlation between the percentage of Ottawa and percentage of population receiving government assistance and/or food stamps does not imply a direct cause-and-effect relationship. It remains uncertain whether the presence of Ottawa influences an upward or downward trend in the level of percentage of population receiving government assistance and/or food stamps within an area, or if Ottawa simply ended up residing in those areas with higher or lower levels of percentage of population receiving government assistance and/or food stamps due to other factors.

Demographics Similar to Ottawa by Receiving Food Stamps

In terms of receiving food stamps, the demographic groups most similar to Ottawa are Panamanian (13.1%, a difference of 0.010%), Nigerian (13.1%, a difference of 0.020%), Puget Sound Salish (13.1%, a difference of 0.050%), Chickasaw (13.1%, a difference of 0.070%), and Immigrants from Nigeria (13.1%, a difference of 0.090%).
DemographicsRating | RankReceiving Food Stamps
Immigrants
4.4
/100
|
#222
Tragic
13.0%
Immigrants from Albania
4.4
/100
|
#223
Tragic
13.0%
Immigrants from Armenia
4.3
/100
|
#224
Tragic
13.0%
Fijians
4.3
/100
|
#225
Tragic
13.0%
Chickasaw
3.6
/100
|
#226
Tragic
13.1%
Nigerians
3.5
/100
|
#227
Tragic
13.1%
Panamanians
3.5
/100
|
#228
Tragic
13.1%
Ottawa
3.5
/100
|
#229
Tragic
13.1%
Puget Sound Salish
3.4
/100
|
#230
Tragic
13.1%
Immigrants from Nigeria
3.4
/100
|
#231
Tragic
13.1%
Salvadorans
2.7
/100
|
#232
Tragic
13.2%
Cherokee
2.5
/100
|
#233
Tragic
13.2%
Comanche
2.4
/100
|
#234
Tragic
13.3%
Immigrants from Zaire
1.9
/100
|
#235
Tragic
13.4%
Crow
1.6
/100
|
#236
Tragic
13.4%

Ottawa Receiving Food Stamps Correlation Summary

MeasurementOttawa DataReceiving Food Stamps Data
Minimum0.015%2.8%
Maximum11.5%30.4%
Range11.5%27.6%
Mean3.1%13.1%
Median2.3%12.8%
Interquartile 25% (IQ1)1.1%8.7%
Interquartile 75% (IQ3)4.8%15.9%
Interquartile Range (IQR)3.7%7.2%
Standard Deviation (Sample)2.8%6.0%
Standard Deviation (Population)2.7%6.0%

Correlation Details

Ottawa PercentileSample SizeReceiving Food Stamps
[
0.0%
-
0.5%
]
0.015%
45,132,32112.9%
[
0.0%
-
0.5%
]
0.14%
2,782,50412.5%
[
0.0%
-
0.5%
]
0.24%
897,36912.8%
[
0.0%
-
0.5%
]
0.34%
466,85814.6%
[
0.0%
-
0.5%
]
0.43%
161,46712.9%
[
0.5%
-
1.0%
]
0.57%
64,87613.7%
[
0.5%
-
1.0%
]
0.64%
95,46314.8%
[
0.5%
-
1.0%
]
0.74%
110,54614.7%
[
0.5%
-
1.0%
]
0.85%
32,97410.8%
[
0.5%
-
1.0%
]
0.96%
7,92714.1%
[
1.0%
-
1.5%
]
1.06%
14,29818.2%
[
1.0%
-
1.5%
]
1.15%
40,27021.4%
[
1.0%
-
1.5%
]
1.22%
4,43018.5%
[
1.0%
-
1.5%
]
1.37%
28,6218.3%
[
1.0%
-
1.5%
]
1.47%
7,80015.9%
[
1.5%
-
2.0%
]
1.58%
17,1587.3%
[
1.5%
-
2.0%
]
1.63%
4,66322.1%
[
1.5%
-
2.0%
]
1.77%
1135.8%
[
1.5%
-
2.0%
]
1.84%
7,8147.7%
[
1.5%
-
2.0%
]
1.94%
16,07211.1%
[
2.0%
-
2.5%
]
2.05%
1,94819.9%
[
2.0%
-
2.5%
]
2.27%
11,2099.3%
[
2.0%
-
2.5%
]
2.50%
6,24814.9%
[
2.5%
-
3.0%
]
2.53%
47426.7%
[
2.5%
-
3.0%
]
2.62%
38230.4%
[
2.5%
-
3.0%
]
2.83%
6365.5%
[
2.5%
-
3.0%
]
2.93%
5,1489.1%
[
3.0%
-
3.5%
]
3.15%
6,89419.2%
[
3.0%
-
3.5%
]
3.35%
1,10510.4%
[
3.5%
-
4.0%
]
3.52%
1,99114.4%
[
4.5%
-
5.0%
]
4.56%
3516.8%
[
4.5%
-
5.0%
]
4.62%
36810.8%
[
4.5%
-
5.0%
]
4.76%
4,85710.0%
[
4.5%
-
5.0%
]
4.95%
20210.4%
[
5.0%
-
5.5%
]
5.20%
2505.2%
[
5.0%
-
5.5%
]
5.22%
86224.0%
[
5.5%
-
6.0%
]
5.99%
2677.5%
[
6.0%
-
6.5%
]
6.30%
1,03117.9%
[
6.5%
-
7.0%
]
6.93%
1,4158.7%
[
7.0%
-
7.5%
]
7.11%
75915.5%
[
9.0%
-
9.5%
]
9.33%
7510.8%
[
9.5%
-
10.0%
]
9.83%
3562.8%
[
11.0%
-
11.5%
]
11.49%
875.3%