Ottawa College, Under 1 year
COMPARE
Ottawa
Select to Compare
College, Under 1 year
Ottawa College, Under 1 year
62.2%
COLLEGE, UNDER 1 YEAR
1.1/ 100
METRIC RATING
241st/ 347
METRIC RANK
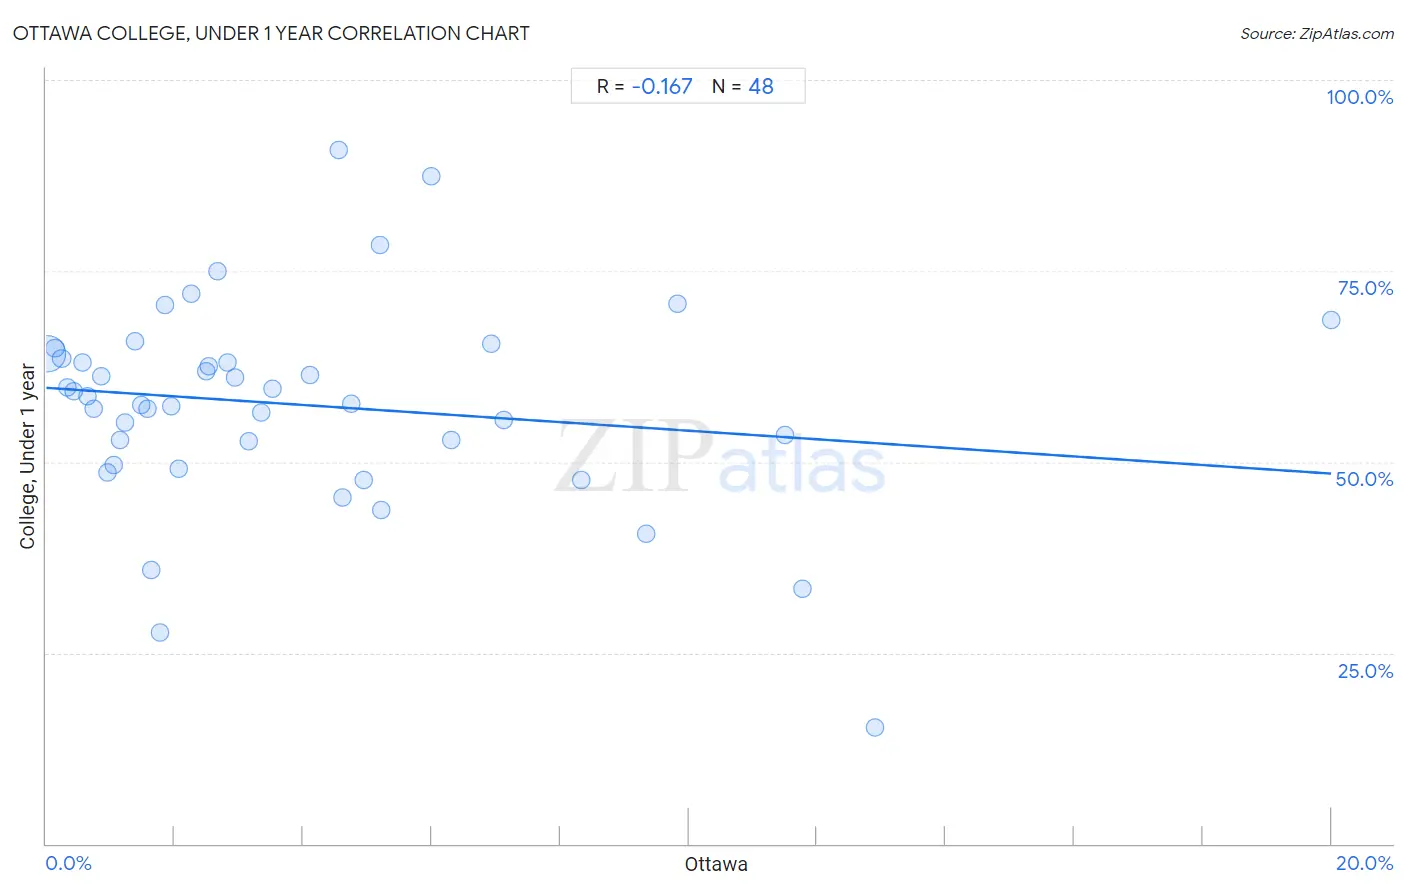
Ottawa College, Under 1 year Correlation Chart
The statistical analysis conducted on geographies consisting of 49,956,726 people shows a poor negative correlation between the proportion of Ottawa and percentage of population with at least college, under 1 year education in the United States with a correlation coefficient (R) of -0.167 and weighted average of 62.2%. On average, for every 1% (one percent) increase in Ottawa within a typical geography, there is a decrease of 0.56% in percentage of population with at least college, under 1 year education.
It is essential to understand that the correlation between the percentage of Ottawa and percentage of population with at least college, under 1 year education does not imply a direct cause-and-effect relationship. It remains uncertain whether the presence of Ottawa influences an upward or downward trend in the level of percentage of population with at least college, under 1 year education within an area, or if Ottawa simply ended up residing in those areas with higher or lower levels of percentage of population with at least college, under 1 year education due to other factors.
Demographics Similar to Ottawa by College, Under 1 year
In terms of college, under 1 year, the demographic groups most similar to Ottawa are Nepalese (62.2%, a difference of 0.010%), Aleut (62.2%, a difference of 0.010%), Malaysian (62.2%, a difference of 0.050%), Hawaiian (62.1%, a difference of 0.080%), and Colville (62.1%, a difference of 0.17%).
| Demographics | Rating | Rank | College, Under 1 year |
| Chippewa | 2.0 /100 | #234 | Tragic 62.6% |
| Spanish Americans | 1.9 /100 | #235 | Tragic 62.6% |
| Immigrants | 1.7 /100 | #236 | Tragic 62.5% |
| Immigrants from Burma/Myanmar | 1.6 /100 | #237 | Tragic 62.5% |
| French American Indians | 1.5 /100 | #238 | Tragic 62.4% |
| Nepalese | 1.1 /100 | #239 | Tragic 62.2% |
| Aleuts | 1.1 /100 | #240 | Tragic 62.2% |
| Ottawa | 1.1 /100 | #241 | Tragic 62.2% |
| Malaysians | 1.1 /100 | #242 | Tragic 62.2% |
| Hawaiians | 1.1 /100 | #243 | Tragic 62.1% |
| Colville | 1.0 /100 | #244 | Tragic 62.1% |
| Delaware | 0.9 /100 | #245 | Tragic 62.1% |
| Marshallese | 0.8 /100 | #246 | Tragic 61.9% |
| Immigrants from Liberia | 0.8 /100 | #247 | Tragic 61.9% |
| Potawatomi | 0.6 /100 | #248 | Tragic 61.8% |
Ottawa College, Under 1 year Correlation Summary
| Measurement | Ottawa Data | College, Under 1 year Data |
| Minimum | 0.015% | 15.3% |
| Maximum | 20.0% | 90.8% |
| Range | 20.0% | 75.6% |
| Mean | 4.0% | 57.5% |
| Median | 2.6% | 58.1% |
| Interquartile 25% (IQ1) | 1.2% | 51.2% |
| Interquartile 75% (IQ3) | 5.2% | 63.8% |
| Interquartile Range (IQR) | 4.0% | 12.6% |
| Standard Deviation (Sample) | 4.0% | 13.6% |
| Standard Deviation (Population) | 4.0% | 13.5% |
Correlation Details
| Ottawa Percentile | Sample Size | College, Under 1 year |
[ 0.0% - 0.5% ] 0.015% | 45,132,321 | 64.1% |
[ 0.0% - 0.5% ] 0.14% | 2,793,359 | 64.9% |
[ 0.0% - 0.5% ] 0.24% | 897,369 | 63.6% |
[ 0.0% - 0.5% ] 0.34% | 468,185 | 59.7% |
[ 0.0% - 0.5% ] 0.43% | 161,467 | 59.3% |
[ 0.5% - 1.0% ] 0.57% | 64,876 | 63.0% |
[ 0.5% - 1.0% ] 0.64% | 95,463 | 58.6% |
[ 0.5% - 1.0% ] 0.74% | 113,052 | 57.0% |
[ 0.5% - 1.0% ] 0.85% | 32,974 | 61.2% |
[ 0.5% - 1.0% ] 0.96% | 7,927 | 48.7% |
[ 1.0% - 1.5% ] 1.06% | 14,298 | 49.6% |
[ 1.0% - 1.5% ] 1.15% | 40,270 | 52.8% |
[ 1.0% - 1.5% ] 1.22% | 4,430 | 55.1% |
[ 1.0% - 1.5% ] 1.37% | 28,621 | 65.8% |
[ 1.0% - 1.5% ] 1.47% | 7,800 | 57.4% |
[ 1.5% - 2.0% ] 1.58% | 17,158 | 56.9% |
[ 1.5% - 2.0% ] 1.63% | 4,663 | 35.9% |
[ 1.5% - 2.0% ] 1.77% | 113 | 27.7% |
[ 1.5% - 2.0% ] 1.84% | 7,814 | 70.6% |
[ 1.5% - 2.0% ] 1.94% | 16,072 | 57.3% |
[ 2.0% - 2.5% ] 2.05% | 1,948 | 49.1% |
[ 2.0% - 2.5% ] 2.27% | 11,209 | 72.0% |
[ 2.0% - 2.5% ] 2.50% | 6,248 | 61.8% |
[ 2.5% - 3.0% ] 2.53% | 474 | 62.6% |
[ 2.5% - 3.0% ] 2.67% | 1,274 | 75.0% |
[ 2.5% - 3.0% ] 2.83% | 636 | 62.9% |
[ 2.5% - 3.0% ] 2.93% | 5,148 | 61.0% |
[ 3.0% - 3.5% ] 3.15% | 6,894 | 52.8% |
[ 3.0% - 3.5% ] 3.35% | 1,105 | 56.4% |
[ 3.5% - 4.0% ] 3.52% | 1,991 | 59.6% |
[ 4.0% - 4.5% ] 4.10% | 390 | 61.4% |
[ 4.5% - 5.0% ] 4.56% | 351 | 90.8% |
[ 4.5% - 5.0% ] 4.62% | 368 | 45.3% |
[ 4.5% - 5.0% ] 4.76% | 4,857 | 57.6% |
[ 4.5% - 5.0% ] 4.95% | 202 | 47.7% |
[ 5.0% - 5.5% ] 5.20% | 250 | 78.4% |
[ 5.0% - 5.5% ] 5.22% | 862 | 43.7% |
[ 5.5% - 6.0% ] 5.99% | 267 | 87.4% |
[ 6.0% - 6.5% ] 6.30% | 1,031 | 52.8% |
[ 6.5% - 7.0% ] 6.93% | 1,415 | 65.5% |
[ 7.0% - 7.5% ] 7.11% | 759 | 55.5% |
[ 8.0% - 8.5% ] 8.33% | 84 | 47.6% |
[ 9.0% - 9.5% ] 9.33% | 75 | 40.6% |
[ 9.5% - 10.0% ] 9.83% | 356 | 70.7% |
[ 11.0% - 11.5% ] 11.49% | 87 | 53.4% |
[ 11.5% - 12.0% ] 11.76% | 34 | 33.3% |
[ 12.5% - 13.0% ] 12.90% | 124 | 15.3% |
[ 20.0% - 20.5% ] 20.00% | 55 | 68.6% |