Latvian Male Disability

COMPARE

Latvian
Race
Ancestry
AfghanAfricanAlaska NativeAlaskan AthabascanAlbanianAleutAlsatianAmericanApacheArabArapahoArgentineanArmenianAssyrian/Chaldean/SyriacAustralianAustrianBahamianBangladeshiBarbadianBasqueBelgianBelizeanBermudanBhutaneseBlackfeetBolivianBrazilianBritishBritish West IndianBulgarianBurmeseCajunCambodianCanadianCape VerdeanCarpatho RusynCelticCentral AmericanCentral American IndianCherokeeCheyenneChickasawChileanChineseChippewaChoctawColombianColvilleComancheCosta RicanCreeCreekCroatianCrowCubanCypriotCzechCzechoslovakianDanishDelawareDominicanDutchDutch West IndianEastern EuropeanEcuadorianEgyptianEnglishEstonianEthiopianEuropeanFijianFilipinoFinnishFrenchFrench American IndianFrench CanadianGermanGerman RussianGhanaianGreekGuamanian/ChamorroGuatemalanGuyaneseHaitianHmongHonduranHopiHoumaHungarianIcelanderIndian (Asian)IndonesianInupiatIranianIraqiIrishIroquoisIsraeliItalianJamaicanJapaneseJordanianKenyanKiowaKoreanLaotianLatvianLebaneseLiberianLithuanianLumbeeLuxembourgerMacedonianMalaysianMalteseMarshalleseMenomineeMexicanMexican American IndianMongolianMoroccanNative HawaiianNavajoNepaleseNew ZealanderNicaraguanNigerianNorthern EuropeanNorwegianOkinawanOsageOttawaPaiutePakistaniPalestinianPanamanianParaguayanPennsylvania GermanPeruvianPimaPolishPortuguesePotawatomiPuebloPuerto RicanPuget Sound SalishRomanianRussianSalvadoranSamoanScandinavianScotch-IrishScottishSeminoleSenegaleseSerbianShoshoneSierra LeoneanSiouxSlavicSlovakSloveneSomaliSouth AfricanSouth AmericanSouth American IndianSoviet UnionSpaniardSpanishSpanish AmericanSpanish American IndianSri LankanSubsaharan AfricanSudaneseSwedishSwissSyrianTaiwaneseThaiTlingit-HaidaTohono O'OdhamTonganTrinidadian and TobagonianTsimshianTurkishU.S. Virgin IslanderUgandanUkrainianUruguayanUteVenezuelanVietnameseWelshWest IndianYakamaYaquiYugoslavianYumanYup'ikZimbabwean
Immigration
NonimmigrantsImmigrantsAfghanistanAfricaAlbaniaArgentinaArmeniaAsiaAustraliaAustriaBahamasBangladeshBarbadosBelarusBelgiumBelizeBoliviaBosnia and HerzegovinaBrazilBulgariaBurma/MyanmarCabo VerdeCambodiaCameroonCanadaCaribbeanCentral AmericaChileChinaColombiaCongoCosta RicaCroatiaCubaCzechoslovakiaDenmarkDominicaDominican RepublicEastern AfricaEastern AsiaEastern EuropeEcuadorEgyptEl SalvadorEnglandEritreaEthiopiaEuropeFijiFranceGermanyGhanaGreeceGrenadaGuatemalaGuyanaHaitiHondurasHong KongHungaryIndiaIndonesiaIranIraqIrelandIsraelItalyJamaicaJapanJordanKazakhstanKenyaKoreaKuwaitLaosLatin AmericaLatviaLebanonLiberiaLithuaniaMalaysiaMexicoMicronesiaMiddle AfricaMoldovaMoroccoNepalNetherlandsNicaraguaNigeriaNorth AmericaNorth MacedoniaNorthern AfricaNorthern EuropeNorwayOceaniaPakistanPanamaPeruPhilippinesPolandPortugalRomaniaRussiaSaudi ArabiaScotlandSenegalSerbiaSierra LeoneSingaporeSomaliaSouth AfricaSouth AmericaSouth Central AsiaSouth Eastern AsiaSouthern EuropeSpainSri LankaSt. Vincent and the GrenadinesSudanSwedenSwitzerlandSyriaTaiwanThailandTrinidad and TobagoTurkeyUgandaUkraineUruguayUzbekistanVenezuelaVietnamWest IndiesWestern AfricaWestern AsiaWestern EuropeYemenZaireZimbabweAzores
Select to Compare
Race
Ancestry
AfghanAfricanAlaska NativeAlaskan AthabascanAlbanianAleutAlsatianAmericanApacheArabArapahoArgentineanArmenianAssyrian/Chaldean/SyriacAustralianAustrianBahamianBangladeshiBarbadianBasqueBelgianBelizeanBermudanBhutaneseBlackfeetBolivianBrazilianBritishBritish West IndianBulgarianBurmeseCajunCambodianCanadianCape VerdeanCarpatho RusynCelticCentral AmericanCentral American IndianCherokeeCheyenneChickasawChileanChineseChippewaChoctawColombianColvilleComancheCosta RicanCreeCreekCroatianCrowCubanCypriotCzechCzechoslovakianDanishDelawareDominicanDutchDutch West IndianEastern EuropeanEcuadorianEgyptianEnglishEstonianEthiopianEuropeanFijianFilipinoFinnishFrenchFrench American IndianFrench CanadianGermanGerman RussianGhanaianGreekGuamanian/ChamorroGuatemalanGuyaneseHaitianHmongHonduranHopiHoumaHungarianIcelanderIndian (Asian)IndonesianInupiatIranianIraqiIrishIroquoisIsraeliItalianJamaicanJapaneseJordanianKenyanKiowaKoreanLaotianLebaneseLiberianLithuanianLumbeeLuxembourgerMacedonianMalaysianMalteseMarshalleseMenomineeMexicanMexican American IndianMongolianMoroccanNative HawaiianNavajoNepaleseNew ZealanderNicaraguanNigerianNorthern EuropeanNorwegianOkinawanOsageOttawaPaiutePakistaniPalestinianPanamanianParaguayanPennsylvania GermanPeruvianPimaPolishPortuguesePotawatomiPuebloPuerto RicanPuget Sound SalishRomanianRussianSalvadoranSamoanScandinavianScotch-IrishScottishSeminoleSenegaleseSerbianShoshoneSierra LeoneanSiouxSlavicSlovakSloveneSomaliSouth AfricanSouth AmericanSouth American IndianSoviet UnionSpaniardSpanishSpanish AmericanSpanish American IndianSri LankanSubsaharan AfricanSudaneseSwedishSwissSyrianTaiwaneseThaiTlingit-HaidaTohono O'OdhamTonganTrinidadian and TobagonianTsimshianTurkishU.S. Virgin IslanderUgandanUkrainianUruguayanUteVenezuelanVietnameseWelshWest IndianYakamaYaquiYugoslavianYumanYup'ikZimbabwean
Immigration
NonimmigrantsImmigrantsAfghanistanAfricaAlbaniaArgentinaArmeniaAsiaAustraliaAustriaBahamasBangladeshBarbadosBelarusBelgiumBelizeBoliviaBosnia and HerzegovinaBrazilBulgariaBurma/MyanmarCabo VerdeCambodiaCameroonCanadaCaribbeanCentral AmericaChileChinaColombiaCongoCosta RicaCroatiaCubaCzechoslovakiaDenmarkDominicaDominican RepublicEastern AfricaEastern AsiaEastern EuropeEcuadorEgyptEl SalvadorEnglandEritreaEthiopiaEuropeFijiFranceGermanyGhanaGreeceGrenadaGuatemalaGuyanaHaitiHondurasHong KongHungaryIndiaIndonesiaIranIraqIrelandIsraelItalyJamaicaJapanJordanKazakhstanKenyaKoreaKuwaitLaosLatin AmericaLatviaLebanonLiberiaLithuaniaMalaysiaMexicoMicronesiaMiddle AfricaMoldovaMoroccoNepalNetherlandsNicaraguaNigeriaNorth AmericaNorth MacedoniaNorthern AfricaNorthern EuropeNorwayOceaniaPakistanPanamaPeruPhilippinesPolandPortugalRomaniaRussiaSaudi ArabiaScotlandSenegalSerbiaSierra LeoneSingaporeSomaliaSouth AfricaSouth AmericaSouth Central AsiaSouth Eastern AsiaSouthern EuropeSpainSri LankaSt. Vincent and the GrenadinesSudanSwedenSwitzerlandSyriaTaiwanThailandTrinidad and TobagoTurkeyUgandaUkraineUruguayUzbekistanVenezuelaVietnamWest IndiesWestern AfricaWestern AsiaWestern EuropeYemenZaireZimbabweAzores
Male Disability
Income
Poverty
Unemployment
Labor Participation
Family Structure
Vehicle Availability
Education Level
Disability

Latvian Male Disability
Good

11.1%
DISABILITY | MALES
68.1/ 100
METRIC RATING
158th/ 347
METRIC RANK

Latvian Male Disability Correlation Chart

The statistical analysis conducted on geographies consisting of 220,715,476 people shows a substantial positive correlation between the proportion of Latvians and percentage of males with a disability in the United States with a correlation coefficient (R) of 0.557 and weighted average of 11.1%. On average, for every 1% (one percent) increase in Latvians within a typical geography, there is an increase of 1.8% in percentage of males with a disability.
Latvian Male Disability
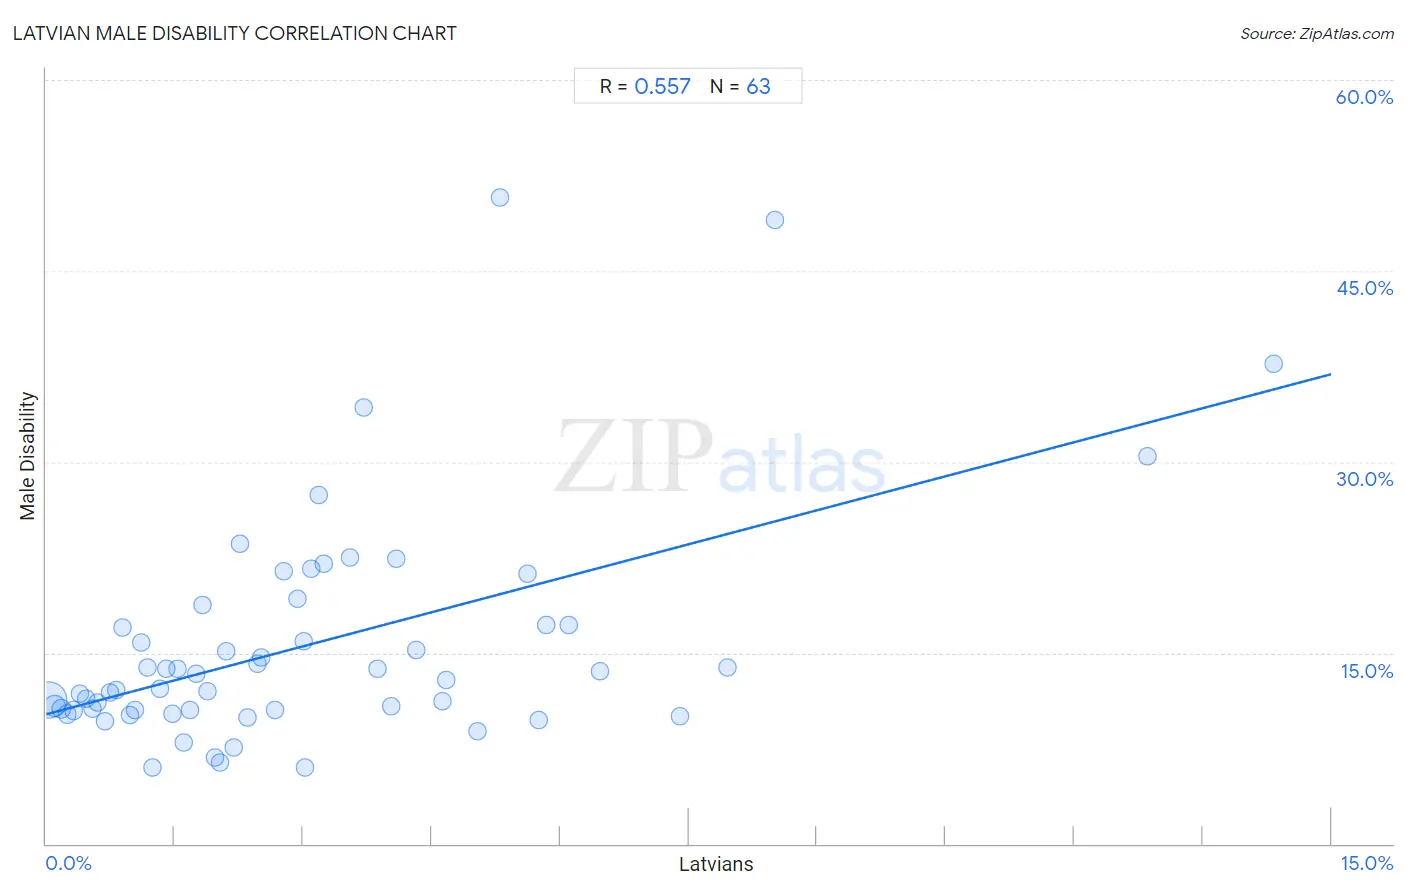
It is essential to understand that the correlation between the percentage of Latvians and percentage of males with a disability does not imply a direct cause-and-effect relationship. It remains uncertain whether the presence of Latvians influences an upward or downward trend in the level of percentage of males with a disability within an area, or if Latvians simply ended up residing in those areas with higher or lower levels of percentage of males with a disability due to other factors.

Demographics Similar to Latvians by Male Disability

In terms of male disability, the demographic groups most similar to Latvians are Guatemalan (11.1%, a difference of 0.060%), Immigrants from Western Africa (11.1%, a difference of 0.070%), Russian (11.1%, a difference of 0.11%), Albanian (11.1%, a difference of 0.11%), and Immigrants from West Indies (11.1%, a difference of 0.16%).
DemographicsRating | RankMale Disability
Cubans
74.9
/100
|
#151
Good
11.0%
Immigrants from Albania
74.4
/100
|
#152
Good
11.0%
Immigrants from Northern Europe
73.2
/100
|
#153
Good
11.1%
Immigrants from Moldova
72.8
/100
|
#154
Good
11.1%
Immigrants from Middle Africa
70.9
/100
|
#155
Good
11.1%
Russians
69.8
/100
|
#156
Good
11.1%
Immigrants from Western Africa
69.2
/100
|
#157
Good
11.1%
Latvians
68.1
/100
|
#158
Good
11.1%
Guatemalans
67.2
/100
|
#159
Good
11.1%
Albanians
66.5
/100
|
#160
Good
11.1%
Immigrants from West Indies
65.7
/100
|
#161
Good
11.1%
Immigrants from Haiti
65.3
/100
|
#162
Good
11.1%
Immigrants from Kenya
63.8
/100
|
#163
Good
11.1%
British West Indians
62.8
/100
|
#164
Good
11.1%
Luxembourgers
61.9
/100
|
#165
Good
11.1%

Latvian Male Disability Correlation Summary

MeasurementLatvian DataMale Disability Data
Minimum0.030%6.0%
Maximum14.3%50.8%
Range14.3%44.8%
Mean3.0%15.6%
Median2.3%12.8%
Interquartile 25% (IQ1)1.1%10.5%
Interquartile 75% (IQ3)4.1%17.2%
Interquartile Range (IQR)3.0%6.7%
Standard Deviation (Sample)2.8%9.0%
Standard Deviation (Population)2.8%8.9%

Correlation Details

Latvian PercentileSample SizeMale Disability
[
0.0%
-
0.5%
]
0.030%
161,515,84111.3%
[
0.0%
-
0.5%
]
0.100%
37,604,96010.8%
[
0.0%
-
0.5%
]
0.17%
10,125,21210.6%
[
0.0%
-
0.5%
]
0.25%
4,610,99610.2%
[
0.0%
-
0.5%
]
0.32%
2,638,20410.5%
[
0.0%
-
0.5%
]
0.39%
1,360,17711.8%
[
0.0%
-
0.5%
]
0.47%
604,23511.4%
[
0.5%
-
1.0%
]
0.53%
614,49310.6%
[
0.5%
-
1.0%
]
0.60%
467,65511.1%
[
0.5%
-
1.0%
]
0.68%
284,7319.6%
[
0.5%
-
1.0%
]
0.75%
192,87311.9%
[
0.5%
-
1.0%
]
0.81%
87,27912.1%
[
0.5%
-
1.0%
]
0.89%
122,13217.0%
[
0.5%
-
1.0%
]
0.97%
76,77610.1%
[
1.0%
-
1.5%
]
1.03%
107,96810.5%
[
1.0%
-
1.5%
]
1.11%
10,50715.8%
[
1.0%
-
1.5%
]
1.18%
31,07113.8%
[
1.0%
-
1.5%
]
1.24%
6,4726.0%
[
1.0%
-
1.5%
]
1.33%
21,03312.1%
[
1.0%
-
1.5%
]
1.40%
20,39313.8%
[
1.0%
-
1.5%
]
1.48%
11,49310.2%
[
1.5%
-
2.0%
]
1.53%
47,13613.7%
[
1.5%
-
2.0%
]
1.61%
10,2107.9%
[
1.5%
-
2.0%
]
1.68%
12,51610.5%
[
1.5%
-
2.0%
]
1.75%
4,50213.4%
[
1.5%
-
2.0%
]
1.82%
11,28218.8%
[
1.5%
-
2.0%
]
1.88%
9,43512.0%
[
1.5%
-
2.0%
]
1.98%
13,9736.8%
[
2.0%
-
2.5%
]
2.03%
4,2766.4%
[
2.0%
-
2.5%
]
2.10%
1,80715.1%
[
2.0%
-
2.5%
]
2.19%
20,5297.5%
[
2.0%
-
2.5%
]
2.25%
3,99223.6%
[
2.0%
-
2.5%
]
2.35%
8,0509.9%
[
2.0%
-
2.5%
]
2.46%
1,74514.1%
[
2.5%
-
3.0%
]
2.51%
1,39214.7%
[
2.5%
-
3.0%
]
2.67%
13,49710.5%
[
2.5%
-
3.0%
]
2.77%
3,57521.4%
[
2.5%
-
3.0%
]
2.94%
2,01019.2%
[
3.0%
-
3.5%
]
3.01%
13315.9%
[
3.0%
-
3.5%
]
3.03%
8,4256.0%
[
3.0%
-
3.5%
]
3.09%
16221.6%
[
3.0%
-
3.5%
]
3.17%
44127.4%
[
3.0%
-
3.5%
]
3.23%
40222.0%
[
3.5%
-
4.0%
]
3.55%
73222.5%
[
3.5%
-
4.0%
]
3.70%
81134.3%
[
3.5%
-
4.0%
]
3.87%
1,47213.8%
[
4.0%
-
4.5%
]
4.03%
2,03610.8%
[
4.0%
-
4.5%
]
4.09%
22022.4%
[
4.0%
-
4.5%
]
4.32%
1,34315.2%
[
4.5%
-
5.0%
]
4.62%
2,14311.2%
[
4.5%
-
5.0%
]
4.67%
30012.8%
[
5.0%
-
5.5%
]
5.03%
1598.8%
[
5.0%
-
5.5%
]
5.30%
77450.8%
[
5.5%
-
6.0%
]
5.62%
4,61121.3%
[
5.5%
-
6.0%
]
5.75%
2269.8%
[
5.5%
-
6.0%
]
5.83%
22317.2%
[
6.0%
-
6.5%
]
6.10%
77117.2%
[
6.0%
-
6.5%
]
6.46%
44913.6%
[
7.0%
-
7.5%
]
7.39%
2,31310.1%
[
7.5%
-
8.0%
]
7.95%
39013.8%
[
8.5%
-
9.0%
]
8.51%
9449.0%
[
12.5%
-
13.0%
]
12.85%
42830.5%
[
14.0%
-
14.5%
]
14.32%
1,99037.7%