Iranian Married-couple Households
COMPARE
Iranian
Select to Compare
Married-couple Households
Iranian Married-couple Households
49.0%
MARRIED-COUPLE HOUSEHOLDS
99.7/ 100
METRIC RATING
36th/ 347
METRIC RANK
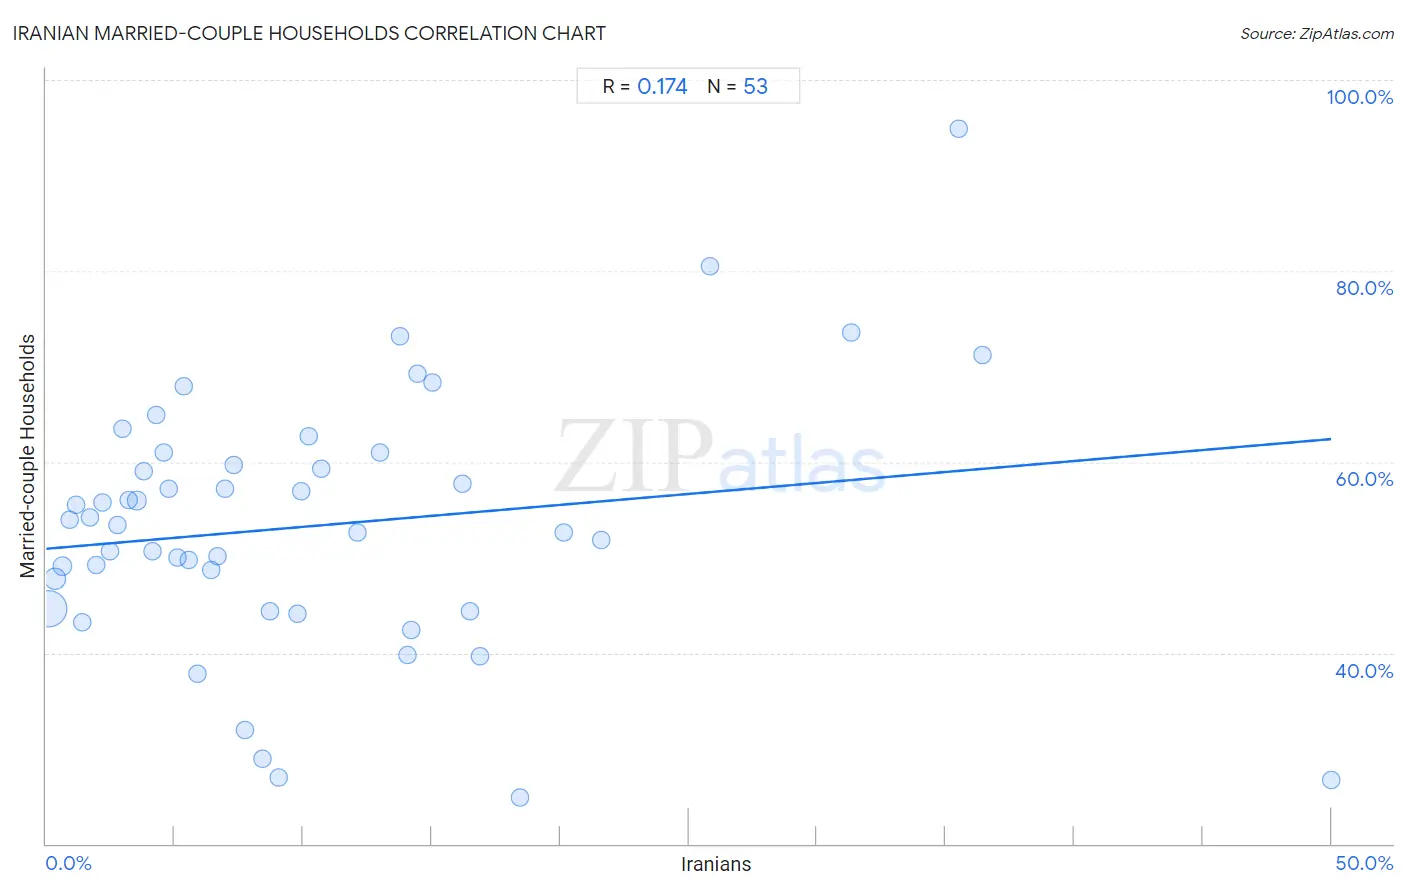
Iranian Married-couple Households Correlation Chart
The statistical analysis conducted on geographies consisting of 316,648,263 people shows a poor positive correlation between the proportion of Iranians and percentage of married-couple family households in the United States with a correlation coefficient (R) of 0.174 and weighted average of 49.0%. On average, for every 1% (one percent) increase in Iranians within a typical geography, there is an increase of 0.23% in percentage of married-couple family households.
It is essential to understand that the correlation between the percentage of Iranians and percentage of married-couple family households does not imply a direct cause-and-effect relationship. It remains uncertain whether the presence of Iranians influences an upward or downward trend in the level of percentage of married-couple family households within an area, or if Iranians simply ended up residing in those areas with higher or lower levels of percentage of married-couple family households due to other factors.
Demographics Similar to Iranians by Married-couple Households
In terms of married-couple households, the demographic groups most similar to Iranians are Sri Lankan (49.0%, a difference of 0.0%), Scottish (49.0%, a difference of 0.090%), Greek (48.9%, a difference of 0.10%), Italian (49.0%, a difference of 0.11%), and Lithuanian (48.9%, a difference of 0.18%).
| Demographics | Rating | Rank | Married-couple Households |
| Maltese | 99.8 /100 | #29 | Exceptional 49.2% |
| Bolivians | 99.8 /100 | #30 | Exceptional 49.2% |
| Native Hawaiians | 99.8 /100 | #31 | Exceptional 49.1% |
| Hungarians | 99.8 /100 | #32 | Exceptional 49.1% |
| Immigrants from Asia | 99.7 /100 | #33 | Exceptional 49.1% |
| Italians | 99.7 /100 | #34 | Exceptional 49.0% |
| Scottish | 99.7 /100 | #35 | Exceptional 49.0% |
| Iranians | 99.7 /100 | #36 | Exceptional 49.0% |
| Sri Lankans | 99.7 /100 | #37 | Exceptional 49.0% |
| Greeks | 99.7 /100 | #38 | Exceptional 48.9% |
| Lithuanians | 99.6 /100 | #39 | Exceptional 48.9% |
| Immigrants from Bolivia | 99.6 /100 | #40 | Exceptional 48.9% |
| Immigrants from Lebanon | 99.6 /100 | #41 | Exceptional 48.9% |
| Immigrants from Vietnam | 99.6 /100 | #42 | Exceptional 48.8% |
| Immigrants from Iran | 99.6 /100 | #43 | Exceptional 48.8% |
Iranian Married-couple Households Correlation Summary
| Measurement | Iranian Data | Married-couple Households Data |
| Minimum | 0.097% | 24.8% |
| Maximum | 50.0% | 94.9% |
| Range | 49.9% | 70.0% |
| Mean | 10.5% | 53.3% |
| Median | 7.3% | 53.4% |
| Interquartile 25% (IQ1) | 3.4% | 44.5% |
| Interquartile 75% (IQ3) | 14.3% | 60.3% |
| Interquartile Range (IQR) | 11.0% | 15.8% |
| Standard Deviation (Sample) | 10.2% | 13.5% |
| Standard Deviation (Population) | 10.1% | 13.4% |
Correlation Details
| Iranian Percentile | Sample Size | Married-couple Households |
[ 0.0% - 0.5% ] 0.097% | 228,752,035 | 44.6% |
[ 0.0% - 0.5% ] 0.36% | 45,757,186 | 47.8% |
[ 0.5% - 1.0% ] 0.63% | 16,964,730 | 49.1% |
[ 0.5% - 1.0% ] 0.91% | 7,308,648 | 53.9% |
[ 1.0% - 1.5% ] 1.17% | 4,466,770 | 55.5% |
[ 1.0% - 1.5% ] 1.39% | 6,265,776 | 43.2% |
[ 1.5% - 2.0% ] 1.69% | 1,878,771 | 54.2% |
[ 1.5% - 2.0% ] 1.93% | 913,168 | 49.2% |
[ 2.0% - 2.5% ] 2.20% | 716,559 | 55.7% |
[ 2.0% - 2.5% ] 2.47% | 562,067 | 50.7% |
[ 2.5% - 3.0% ] 2.79% | 556,336 | 53.4% |
[ 2.5% - 3.0% ] 2.95% | 246,192 | 63.4% |
[ 3.0% - 3.5% ] 3.22% | 274,439 | 56.0% |
[ 3.5% - 4.0% ] 3.53% | 597,935 | 55.9% |
[ 3.5% - 4.0% ] 3.82% | 257,349 | 59.0% |
[ 4.0% - 4.5% ] 4.13% | 74,773 | 50.6% |
[ 4.0% - 4.5% ] 4.29% | 95,989 | 64.9% |
[ 4.5% - 5.0% ] 4.59% | 81,131 | 60.9% |
[ 4.5% - 5.0% ] 4.77% | 175,449 | 57.1% |
[ 5.0% - 5.5% ] 5.11% | 8,205 | 50.0% |
[ 5.0% - 5.5% ] 5.34% | 13,175 | 67.9% |
[ 5.5% - 6.0% ] 5.54% | 24,167 | 49.7% |
[ 5.5% - 6.0% ] 5.89% | 82,117 | 37.8% |
[ 6.0% - 6.5% ] 6.44% | 71,129 | 48.7% |
[ 6.5% - 7.0% ] 6.68% | 69,278 | 50.2% |
[ 6.5% - 7.0% ] 6.94% | 35,333 | 57.2% |
[ 7.0% - 7.5% ] 7.27% | 26,318 | 59.6% |
[ 7.5% - 8.0% ] 7.74% | 349 | 31.9% |
[ 8.0% - 8.5% ] 8.41% | 52,741 | 28.9% |
[ 8.5% - 9.0% ] 8.72% | 64,485 | 44.4% |
[ 9.0% - 9.5% ] 9.06% | 50,392 | 26.9% |
[ 9.5% - 10.0% ] 9.77% | 37,705 | 44.1% |
[ 9.5% - 10.0% ] 9.92% | 23,669 | 56.9% |
[ 10.0% - 10.5% ] 10.23% | 577 | 62.6% |
[ 10.5% - 11.0% ] 10.72% | 9,169 | 59.3% |
[ 12.0% - 12.5% ] 12.13% | 5,589 | 52.5% |
[ 12.5% - 13.0% ] 12.98% | 7,868 | 61.0% |
[ 13.5% - 14.0% ] 13.77% | 1,445 | 73.1% |
[ 14.0% - 14.5% ] 14.05% | 11,289 | 39.8% |
[ 14.0% - 14.5% ] 14.21% | 366 | 42.4% |
[ 14.0% - 14.5% ] 14.47% | 9,699 | 69.2% |
[ 15.0% - 15.5% ] 15.02% | 11,060 | 68.4% |
[ 16.0% - 16.5% ] 16.20% | 16,652 | 57.7% |
[ 16.5% - 17.0% ] 16.51% | 32,963 | 44.3% |
[ 16.5% - 17.0% ] 16.88% | 77 | 39.6% |
[ 18.0% - 18.5% ] 18.45% | 233 | 24.8% |
[ 20.0% - 20.5% ] 20.15% | 19,180 | 52.6% |
[ 21.5% - 22.0% ] 21.60% | 1,139 | 51.8% |
[ 25.5% - 26.0% ] 25.85% | 1,207 | 80.4% |
[ 31.0% - 31.5% ] 31.30% | 9,105 | 73.6% |
[ 35.5% - 36.0% ] 35.51% | 642 | 94.9% |
[ 36.0% - 36.5% ] 36.42% | 5,593 | 71.2% |
[ 50.0% - 50.5% ] 50.00% | 44 | 26.7% |