Iranian 4 or more Vehicles in Household

COMPARE

Iranian
Race
Ancestry
AfghanAfricanAlaska NativeAlaskan AthabascanAlbanianAleutAlsatianAmericanApacheArabArapahoArgentineanArmenianAssyrian/Chaldean/SyriacAustralianAustrianBahamianBangladeshiBarbadianBasqueBelgianBelizeanBermudanBhutaneseBlackfeetBolivianBrazilianBritishBritish West IndianBulgarianBurmeseCajunCambodianCanadianCape VerdeanCarpatho RusynCelticCentral AmericanCentral American IndianCherokeeCheyenneChickasawChileanChineseChippewaChoctawColombianColvilleComancheCosta RicanCreeCreekCroatianCrowCubanCypriotCzechCzechoslovakianDanishDelawareDominicanDutchDutch West IndianEastern EuropeanEcuadorianEgyptianEnglishEstonianEthiopianEuropeanFijianFilipinoFinnishFrenchFrench American IndianFrench CanadianGermanGerman RussianGhanaianGreekGuamanian/ChamorroGuatemalanGuyaneseHaitianHmongHonduranHopiHoumaHungarianIcelanderIndian (Asian)IndonesianInupiatIranianIraqiIrishIroquoisIsraeliItalianJamaicanJapaneseJordanianKenyanKiowaKoreanLaotianLatvianLebaneseLiberianLithuanianLumbeeLuxembourgerMacedonianMalaysianMalteseMarshalleseMenomineeMexicanMexican American IndianMongolianMoroccanNative HawaiianNavajoNepaleseNew ZealanderNicaraguanNigerianNorthern EuropeanNorwegianOkinawanOsageOttawaPaiutePakistaniPalestinianPanamanianParaguayanPennsylvania GermanPeruvianPimaPolishPortuguesePotawatomiPuebloPuerto RicanPuget Sound SalishRomanianRussianSalvadoranSamoanScandinavianScotch-IrishScottishSeminoleSenegaleseSerbianShoshoneSierra LeoneanSiouxSlavicSlovakSloveneSomaliSouth AfricanSouth AmericanSouth American IndianSoviet UnionSpaniardSpanishSpanish AmericanSpanish American IndianSri LankanSubsaharan AfricanSudaneseSwedishSwissSyrianTaiwaneseThaiTlingit-HaidaTohono O'OdhamTonganTrinidadian and TobagonianTsimshianTurkishU.S. Virgin IslanderUgandanUkrainianUruguayanUteVenezuelanVietnameseWelshWest IndianYakamaYaquiYugoslavianYumanYup'ikZimbabwean
Immigration
NonimmigrantsImmigrantsAfghanistanAfricaAlbaniaArgentinaArmeniaAsiaAustraliaAustriaBahamasBangladeshBarbadosBelarusBelgiumBelizeBoliviaBosnia and HerzegovinaBrazilBulgariaBurma/MyanmarCabo VerdeCambodiaCameroonCanadaCaribbeanCentral AmericaChileChinaColombiaCongoCosta RicaCroatiaCubaCzechoslovakiaDenmarkDominicaDominican RepublicEastern AfricaEastern AsiaEastern EuropeEcuadorEgyptEl SalvadorEnglandEritreaEthiopiaEuropeFijiFranceGermanyGhanaGreeceGrenadaGuatemalaGuyanaHaitiHondurasHong KongHungaryIndiaIndonesiaIranIraqIrelandIsraelItalyJamaicaJapanJordanKazakhstanKenyaKoreaKuwaitLaosLatin AmericaLatviaLebanonLiberiaLithuaniaMalaysiaMexicoMicronesiaMiddle AfricaMoldovaMoroccoNepalNetherlandsNicaraguaNigeriaNorth AmericaNorth MacedoniaNorthern AfricaNorthern EuropeNorwayOceaniaPakistanPanamaPeruPhilippinesPolandPortugalRomaniaRussiaSaudi ArabiaScotlandSenegalSerbiaSierra LeoneSingaporeSomaliaSouth AfricaSouth AmericaSouth Central AsiaSouth Eastern AsiaSouthern EuropeSpainSri LankaSt. Vincent and the GrenadinesSudanSwedenSwitzerlandSyriaTaiwanThailandTrinidad and TobagoTurkeyUgandaUkraineUruguayUzbekistanVenezuelaVietnamWest IndiesWestern AfricaWestern AsiaWestern EuropeYemenZaireZimbabweAzores
Select to Compare
Race
Ancestry
AfghanAfricanAlaska NativeAlaskan AthabascanAlbanianAleutAlsatianAmericanApacheArabArapahoArgentineanArmenianAssyrian/Chaldean/SyriacAustralianAustrianBahamianBangladeshiBarbadianBasqueBelgianBelizeanBermudanBhutaneseBlackfeetBolivianBrazilianBritishBritish West IndianBulgarianBurmeseCajunCambodianCanadianCape VerdeanCarpatho RusynCelticCentral AmericanCentral American IndianCherokeeCheyenneChickasawChileanChineseChippewaChoctawColombianColvilleComancheCosta RicanCreeCreekCroatianCrowCubanCypriotCzechCzechoslovakianDanishDelawareDominicanDutchDutch West IndianEastern EuropeanEcuadorianEgyptianEnglishEstonianEthiopianEuropeanFijianFilipinoFinnishFrenchFrench American IndianFrench CanadianGermanGerman RussianGhanaianGreekGuamanian/ChamorroGuatemalanGuyaneseHaitianHmongHonduranHopiHoumaHungarianIcelanderIndian (Asian)IndonesianInupiatIraqiIrishIroquoisIsraeliItalianJamaicanJapaneseJordanianKenyanKiowaKoreanLaotianLatvianLebaneseLiberianLithuanianLumbeeLuxembourgerMacedonianMalaysianMalteseMarshalleseMenomineeMexicanMexican American IndianMongolianMoroccanNative HawaiianNavajoNepaleseNew ZealanderNicaraguanNigerianNorthern EuropeanNorwegianOkinawanOsageOttawaPaiutePakistaniPalestinianPanamanianParaguayanPennsylvania GermanPeruvianPimaPolishPortuguesePotawatomiPuebloPuerto RicanPuget Sound SalishRomanianRussianSalvadoranSamoanScandinavianScotch-IrishScottishSeminoleSenegaleseSerbianShoshoneSierra LeoneanSiouxSlavicSlovakSloveneSomaliSouth AfricanSouth AmericanSouth American IndianSoviet UnionSpaniardSpanishSpanish AmericanSpanish American IndianSri LankanSubsaharan AfricanSudaneseSwedishSwissSyrianTaiwaneseThaiTlingit-HaidaTohono O'OdhamTonganTrinidadian and TobagonianTsimshianTurkishU.S. Virgin IslanderUgandanUkrainianUruguayanUteVenezuelanVietnameseWelshWest IndianYakamaYaquiYugoslavianYumanYup'ikZimbabwean
Immigration
NonimmigrantsImmigrantsAfghanistanAfricaAlbaniaArgentinaArmeniaAsiaAustraliaAustriaBahamasBangladeshBarbadosBelarusBelgiumBelizeBoliviaBosnia and HerzegovinaBrazilBulgariaBurma/MyanmarCabo VerdeCambodiaCameroonCanadaCaribbeanCentral AmericaChileChinaColombiaCongoCosta RicaCroatiaCubaCzechoslovakiaDenmarkDominicaDominican RepublicEastern AfricaEastern AsiaEastern EuropeEcuadorEgyptEl SalvadorEnglandEritreaEthiopiaEuropeFijiFranceGermanyGhanaGreeceGrenadaGuatemalaGuyanaHaitiHondurasHong KongHungaryIndiaIndonesiaIranIraqIrelandIsraelItalyJamaicaJapanJordanKazakhstanKenyaKoreaKuwaitLaosLatin AmericaLatviaLebanonLiberiaLithuaniaMalaysiaMexicoMicronesiaMiddle AfricaMoldovaMoroccoNepalNetherlandsNicaraguaNigeriaNorth AmericaNorth MacedoniaNorthern AfricaNorthern EuropeNorwayOceaniaPakistanPanamaPeruPhilippinesPolandPortugalRomaniaRussiaSaudi ArabiaScotlandSenegalSerbiaSierra LeoneSingaporeSomaliaSouth AfricaSouth AmericaSouth Central AsiaSouth Eastern AsiaSouthern EuropeSpainSri LankaSt. Vincent and the GrenadinesSudanSwedenSwitzerlandSyriaTaiwanThailandTrinidad and TobagoTurkeyUgandaUkraineUruguayUzbekistanVenezuelaVietnamWest IndiesWestern AfricaWestern AsiaWestern EuropeYemenZaireZimbabweAzores
4 or more Vehicles in Household
Income
Poverty
Unemployment
Labor Participation
Family Structure
Vehicle Availability
Education Level
Disability

Iranian 4 or more Vehicles in Household
Good

6.5%
4+ VEHICLES AVAILABLE
69.9/ 100
METRIC RATING
156th/ 347
METRIC RANK

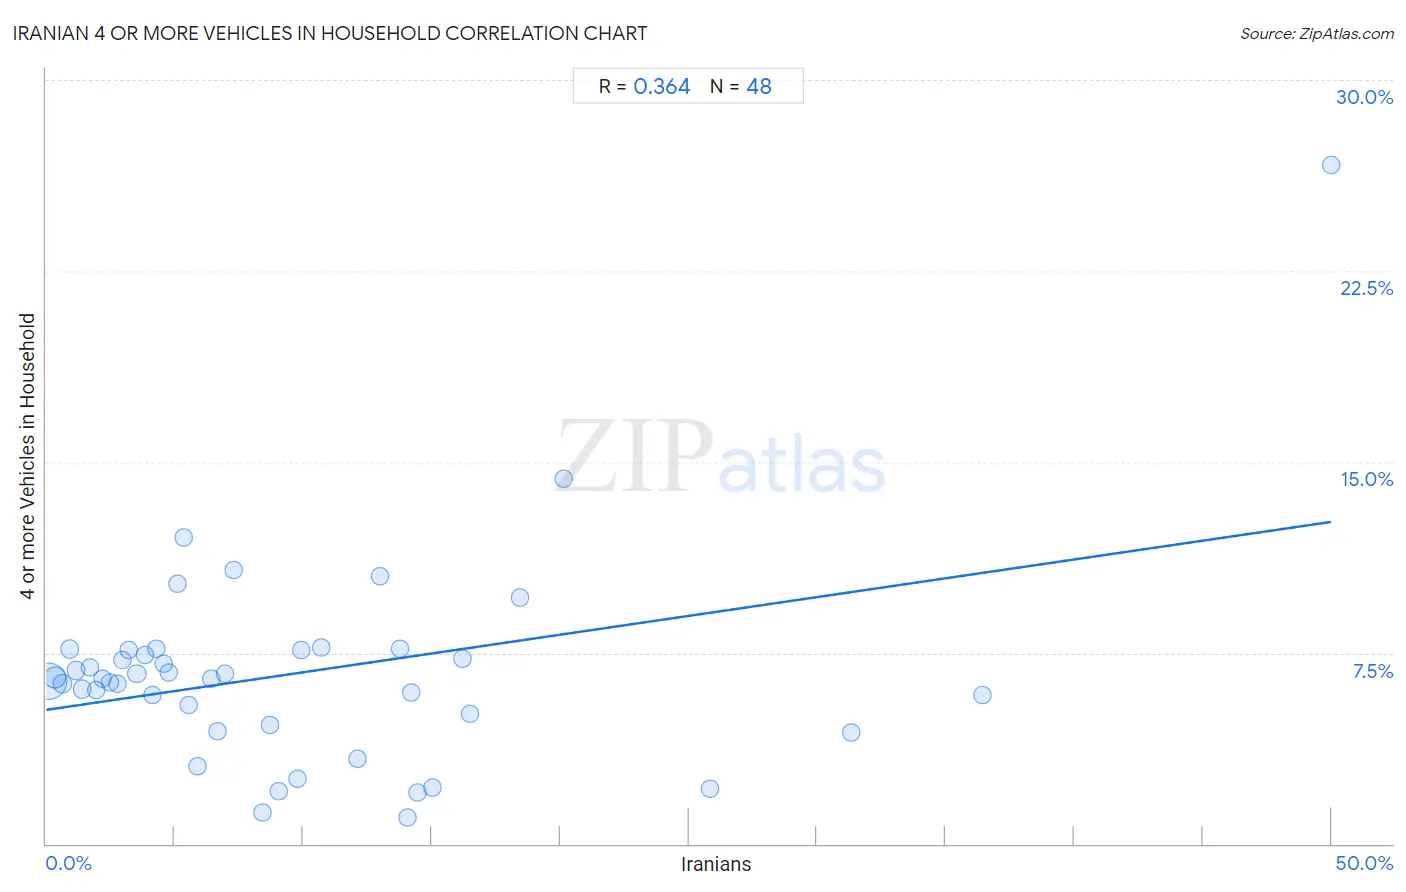
Iranian 4 or more Vehicles in Household Correlation Chart

The statistical analysis conducted on geographies consisting of 315,200,253 people shows a mild positive correlation between the proportion of Iranians and percentage of households with 4 or more vehicles available in the United States with a correlation coefficient (R) of 0.364 and weighted average of 6.5%. On average, for every 1% (one percent) increase in Iranians within a typical geography, there is an increase of 0.15% in percentage of households with 4 or more vehicles available.
Iranian 4 or more Vehicles in Household
It is essential to understand that the correlation between the percentage of Iranians and percentage of households with 4 or more vehicles available does not imply a direct cause-and-effect relationship. It remains uncertain whether the presence of Iranians influences an upward or downward trend in the level of percentage of households with 4 or more vehicles available within an area, or if Iranians simply ended up residing in those areas with higher or lower levels of percentage of households with 4 or more vehicles available due to other factors.

Demographics Similar to Iranians by 4 or more Vehicles in Household

In terms of 4 or more vehicles in household, the demographic groups most similar to Iranians are Peruvian (6.5%, a difference of 0.050%), Iroquois (6.5%, a difference of 0.060%), Central American Indian (6.5%, a difference of 0.14%), Immigrants from Armenia (6.5%, a difference of 0.16%), and Yuman (6.5%, a difference of 0.27%).
DemographicsRating | Rank4 or more Vehicles in Household
Greeks
73.6
/100
|
#149
Good
6.5%
New Zealanders
73.3
/100
|
#150
Good
6.5%
Immigrants from Hong Kong
72.2
/100
|
#151
Good
6.5%
Yuman
72.1
/100
|
#152
Good
6.5%
Immigrants from Armenia
71.2
/100
|
#153
Good
6.5%
Central American Indians
71.1
/100
|
#154
Good
6.5%
Iroquois
70.4
/100
|
#155
Good
6.5%
Iranians
69.9
/100
|
#156
Good
6.5%
Peruvians
69.4
/100
|
#157
Good
6.5%
Zimbabweans
67.1
/100
|
#158
Good
6.4%
Indians (Asian)
66.3
/100
|
#159
Good
6.4%
Palestinians
65.8
/100
|
#160
Good
6.4%
Immigrants from Cameroon
64.4
/100
|
#161
Good
6.4%
Immigrants from Pakistan
63.2
/100
|
#162
Good
6.4%
Chileans
61.2
/100
|
#163
Good
6.4%

Iranian 4 or more Vehicles in Household Correlation Summary

MeasurementIranian Data4 or more Vehicles in Household Data
Minimum0.097%1.1%
Maximum50.0%26.7%
Range49.9%25.6%
Mean9.7%6.7%
Median6.6%6.5%
Interquartile 25% (IQ1)3.1%4.9%
Interquartile 75% (IQ3)13.9%7.6%
Interquartile Range (IQR)10.8%2.7%
Standard Deviation (Sample)9.9%4.0%
Standard Deviation (Population)9.8%4.0%

Correlation Details

Iranian PercentileSample Size4 or more Vehicles in Household
[
0.0%
-
0.5%
]
0.097%
228,087,9116.4%
[
0.0%
-
0.5%
]
0.36%
45,302,9316.5%
[
0.5%
-
1.0%
]
0.63%
16,872,0676.3%
[
0.5%
-
1.0%
]
0.91%
7,241,9187.7%
[
1.0%
-
1.5%
]
1.17%
4,423,1986.8%
[
1.0%
-
1.5%
]
1.39%
6,219,9346.1%
[
1.5%
-
2.0%
]
1.69%
1,836,5776.9%
[
1.5%
-
2.0%
]
1.93%
910,4976.1%
[
2.0%
-
2.5%
]
2.20%
715,3686.5%
[
2.0%
-
2.5%
]
2.47%
555,4406.3%
[
2.5%
-
3.0%
]
2.79%
556,3366.3%
[
2.5%
-
3.0%
]
2.95%
244,6127.2%
[
3.0%
-
3.5%
]
3.22%
269,1567.6%
[
3.5%
-
4.0%
]
3.53%
597,9356.7%
[
3.5%
-
4.0%
]
3.82%
249,4197.4%
[
4.0%
-
4.5%
]
4.13%
74,7735.8%
[
4.0%
-
4.5%
]
4.29%
95,9897.7%
[
4.5%
-
5.0%
]
4.59%
80,2837.1%
[
4.5%
-
5.0%
]
4.77%
175,4496.7%
[
5.0%
-
5.5%
]
5.11%
8,20510.2%
[
5.0%
-
5.5%
]
5.34%
13,17512.0%
[
5.5%
-
6.0%
]
5.54%
24,1675.4%
[
5.5%
-
6.0%
]
5.89%
82,1173.1%
[
6.0%
-
6.5%
]
6.44%
70,6956.5%
[
6.5%
-
7.0%
]
6.68%
69,2784.4%
[
6.5%
-
7.0%
]
6.94%
35,3336.7%
[
7.0%
-
7.5%
]
7.27%
26,31810.8%
[
8.0%
-
8.5%
]
8.41%
45,2981.2%
[
8.5%
-
9.0%
]
8.72%
64,4854.7%
[
9.0%
-
9.5%
]
9.06%
50,3922.1%
[
9.5%
-
10.0%
]
9.77%
37,7052.5%
[
9.5%
-
10.0%
]
9.92%
23,1067.6%
[
10.5%
-
11.0%
]
10.72%
9,1697.7%
[
12.0%
-
12.5%
]
12.13%
5,5893.3%
[
12.5%
-
13.0%
]
12.98%
7,86810.5%
[
13.5%
-
14.0%
]
13.77%
1,4457.6%
[
14.0%
-
14.5%
]
14.05%
11,0321.1%
[
14.0%
-
14.5%
]
14.21%
3665.9%
[
14.0%
-
14.5%
]
14.47%
9,6992.0%
[
15.0%
-
15.5%
]
15.02%
11,0602.2%
[
16.0%
-
16.5%
]
16.20%
16,1907.2%
[
16.5%
-
17.0%
]
16.51%
32,4065.1%
[
18.0%
-
18.5%
]
18.45%
2339.7%
[
20.0%
-
20.5%
]
20.15%
19,18014.3%
[
25.5%
-
26.0%
]
25.85%
1,2072.1%
[
31.0%
-
31.5%
]
31.30%
9,1054.4%
[
36.0%
-
36.5%
]
36.42%
5,5935.9%
[
50.0%
-
50.5%
]
50.00%
4426.7%