Immigrants from North Macedonia 4 or more Vehicles in Household

COMPARE

Immigrants from North Macedonia
Race
Ancestry
AfghanAfricanAlaska NativeAlaskan AthabascanAlbanianAleutAlsatianAmericanApacheArabArapahoArgentineanArmenianAssyrian/Chaldean/SyriacAustralianAustrianBahamianBangladeshiBarbadianBasqueBelgianBelizeanBermudanBhutaneseBlackfeetBolivianBrazilianBritishBritish West IndianBulgarianBurmeseCajunCambodianCanadianCape VerdeanCarpatho RusynCelticCentral AmericanCentral American IndianCherokeeCheyenneChickasawChileanChineseChippewaChoctawColombianColvilleComancheCosta RicanCreeCreekCroatianCrowCubanCypriotCzechCzechoslovakianDanishDelawareDominicanDutchDutch West IndianEastern EuropeanEcuadorianEgyptianEnglishEstonianEthiopianEuropeanFijianFilipinoFinnishFrenchFrench American IndianFrench CanadianGermanGerman RussianGhanaianGreekGuamanian/ChamorroGuatemalanGuyaneseHaitianHmongHonduranHopiHoumaHungarianIcelanderIndian (Asian)IndonesianInupiatIranianIraqiIrishIroquoisIsraeliItalianJamaicanJapaneseJordanianKenyanKiowaKoreanLaotianLatvianLebaneseLiberianLithuanianLumbeeLuxembourgerMacedonianMalaysianMalteseMarshalleseMenomineeMexicanMexican American IndianMongolianMoroccanNative HawaiianNavajoNepaleseNew ZealanderNicaraguanNigerianNorthern EuropeanNorwegianOkinawanOsageOttawaPaiutePakistaniPalestinianPanamanianParaguayanPennsylvania GermanPeruvianPimaPolishPortuguesePotawatomiPuebloPuerto RicanPuget Sound SalishRomanianRussianSalvadoranSamoanScandinavianScotch-IrishScottishSeminoleSenegaleseSerbianShoshoneSierra LeoneanSiouxSlavicSlovakSloveneSomaliSouth AfricanSouth AmericanSouth American IndianSoviet UnionSpaniardSpanishSpanish AmericanSpanish American IndianSri LankanSubsaharan AfricanSudaneseSwedishSwissSyrianTaiwaneseThaiTlingit-HaidaTohono O'OdhamTonganTrinidadian and TobagonianTsimshianTurkishU.S. Virgin IslanderUgandanUkrainianUruguayanUteVenezuelanVietnameseWelshWest IndianYakamaYaquiYugoslavianYumanYup'ikZimbabwean
Immigration
NonimmigrantsImmigrantsAfghanistanAfricaAlbaniaArgentinaArmeniaAsiaAustraliaAustriaBahamasBangladeshBarbadosBelarusBelgiumBelizeBoliviaBosnia and HerzegovinaBrazilBulgariaBurma/MyanmarCabo VerdeCambodiaCameroonCanadaCaribbeanCentral AmericaChileChinaColombiaCongoCosta RicaCroatiaCubaCzechoslovakiaDenmarkDominicaDominican RepublicEastern AfricaEastern AsiaEastern EuropeEcuadorEgyptEl SalvadorEnglandEritreaEthiopiaEuropeFijiFranceGermanyGhanaGreeceGrenadaGuatemalaGuyanaHaitiHondurasHong KongHungaryIndiaIndonesiaIranIraqIrelandIsraelItalyJamaicaJapanJordanKazakhstanKenyaKoreaKuwaitLaosLatin AmericaLatviaLebanonLiberiaLithuaniaMalaysiaMexicoMicronesiaMiddle AfricaMoldovaMoroccoNepalNetherlandsNicaraguaNigeriaNorth AmericaNorth MacedoniaNorthern AfricaNorthern EuropeNorwayOceaniaPakistanPanamaPeruPhilippinesPolandPortugalRomaniaRussiaSaudi ArabiaScotlandSenegalSerbiaSierra LeoneSingaporeSomaliaSouth AfricaSouth AmericaSouth Central AsiaSouth Eastern AsiaSouthern EuropeSpainSri LankaSt. Vincent and the GrenadinesSudanSwedenSwitzerlandSyriaTaiwanThailandTrinidad and TobagoTurkeyUgandaUkraineUruguayUzbekistanVenezuelaVietnamWest IndiesWestern AfricaWestern AsiaWestern EuropeYemenZaireZimbabweAzores
Select to Compare
Race
Ancestry
AfghanAfricanAlaska NativeAlaskan AthabascanAlbanianAleutAlsatianAmericanApacheArabArapahoArgentineanArmenianAssyrian/Chaldean/SyriacAustralianAustrianBahamianBangladeshiBarbadianBasqueBelgianBelizeanBermudanBhutaneseBlackfeetBolivianBrazilianBritishBritish West IndianBulgarianBurmeseCajunCambodianCanadianCape VerdeanCarpatho RusynCelticCentral AmericanCentral American IndianCherokeeCheyenneChickasawChileanChineseChippewaChoctawColombianColvilleComancheCosta RicanCreeCreekCroatianCrowCubanCypriotCzechCzechoslovakianDanishDelawareDominicanDutchDutch West IndianEastern EuropeanEcuadorianEgyptianEnglishEstonianEthiopianEuropeanFijianFilipinoFinnishFrenchFrench American IndianFrench CanadianGermanGerman RussianGhanaianGreekGuamanian/ChamorroGuatemalanGuyaneseHaitianHmongHonduranHopiHoumaHungarianIcelanderIndian (Asian)IndonesianInupiatIranianIraqiIrishIroquoisIsraeliItalianJamaicanJapaneseJordanianKenyanKiowaKoreanLaotianLatvianLebaneseLiberianLithuanianLumbeeLuxembourgerMacedonianMalaysianMalteseMarshalleseMenomineeMexicanMexican American IndianMongolianMoroccanNative HawaiianNavajoNepaleseNew ZealanderNicaraguanNigerianNorthern EuropeanNorwegianOkinawanOsageOttawaPaiutePakistaniPalestinianPanamanianParaguayanPennsylvania GermanPeruvianPimaPolishPortuguesePotawatomiPuebloPuerto RicanPuget Sound SalishRomanianRussianSalvadoranSamoanScandinavianScotch-IrishScottishSeminoleSenegaleseSerbianShoshoneSierra LeoneanSiouxSlavicSlovakSloveneSomaliSouth AfricanSouth AmericanSouth American IndianSoviet UnionSpaniardSpanishSpanish AmericanSpanish American IndianSri LankanSubsaharan AfricanSudaneseSwedishSwissSyrianTaiwaneseThaiTlingit-HaidaTohono O'OdhamTonganTrinidadian and TobagonianTsimshianTurkishU.S. Virgin IslanderUgandanUkrainianUruguayanUteVenezuelanVietnameseWelshWest IndianYakamaYaquiYugoslavianYumanYup'ikZimbabwean
Immigration
NonimmigrantsImmigrantsAfghanistanAfricaAlbaniaArgentinaArmeniaAsiaAustraliaAustriaBahamasBangladeshBarbadosBelarusBelgiumBelizeBoliviaBosnia and HerzegovinaBrazilBulgariaBurma/MyanmarCabo VerdeCambodiaCameroonCanadaCaribbeanCentral AmericaChileChinaColombiaCongoCosta RicaCroatiaCubaCzechoslovakiaDenmarkDominicaDominican RepublicEastern AfricaEastern AsiaEastern EuropeEcuadorEgyptEl SalvadorEnglandEritreaEthiopiaEuropeFijiFranceGermanyGhanaGreeceGrenadaGuatemalaGuyanaHaitiHondurasHong KongHungaryIndiaIndonesiaIranIraqIrelandIsraelItalyJamaicaJapanJordanKazakhstanKenyaKoreaKuwaitLaosLatin AmericaLatviaLebanonLiberiaLithuaniaMalaysiaMexicoMicronesiaMiddle AfricaMoldovaMoroccoNepalNetherlandsNicaraguaNigeriaNorth AmericaNorthern AfricaNorthern EuropeNorwayOceaniaPakistanPanamaPeruPhilippinesPolandPortugalRomaniaRussiaSaudi ArabiaScotlandSenegalSerbiaSierra LeoneSingaporeSomaliaSouth AfricaSouth AmericaSouth Central AsiaSouth Eastern AsiaSouthern EuropeSpainSri LankaSt. Vincent and the GrenadinesSudanSwedenSwitzerlandSyriaTaiwanThailandTrinidad and TobagoTurkeyUgandaUkraineUruguayUzbekistanVenezuelaVietnamWest IndiesWestern AfricaWestern AsiaWestern EuropeYemenZaireZimbabweAzores
4 or more Vehicles in Household
Income
Poverty
Unemployment
Labor Participation
Family Structure
Vehicle Availability
Education Level
Disability

Immigrants from North Macedonia 4 or more Vehicles in Household
Tragic

5.7%
4+ VEHICLES AVAILABLE
2.5/ 100
METRIC RATING
246th/ 347
METRIC RANK

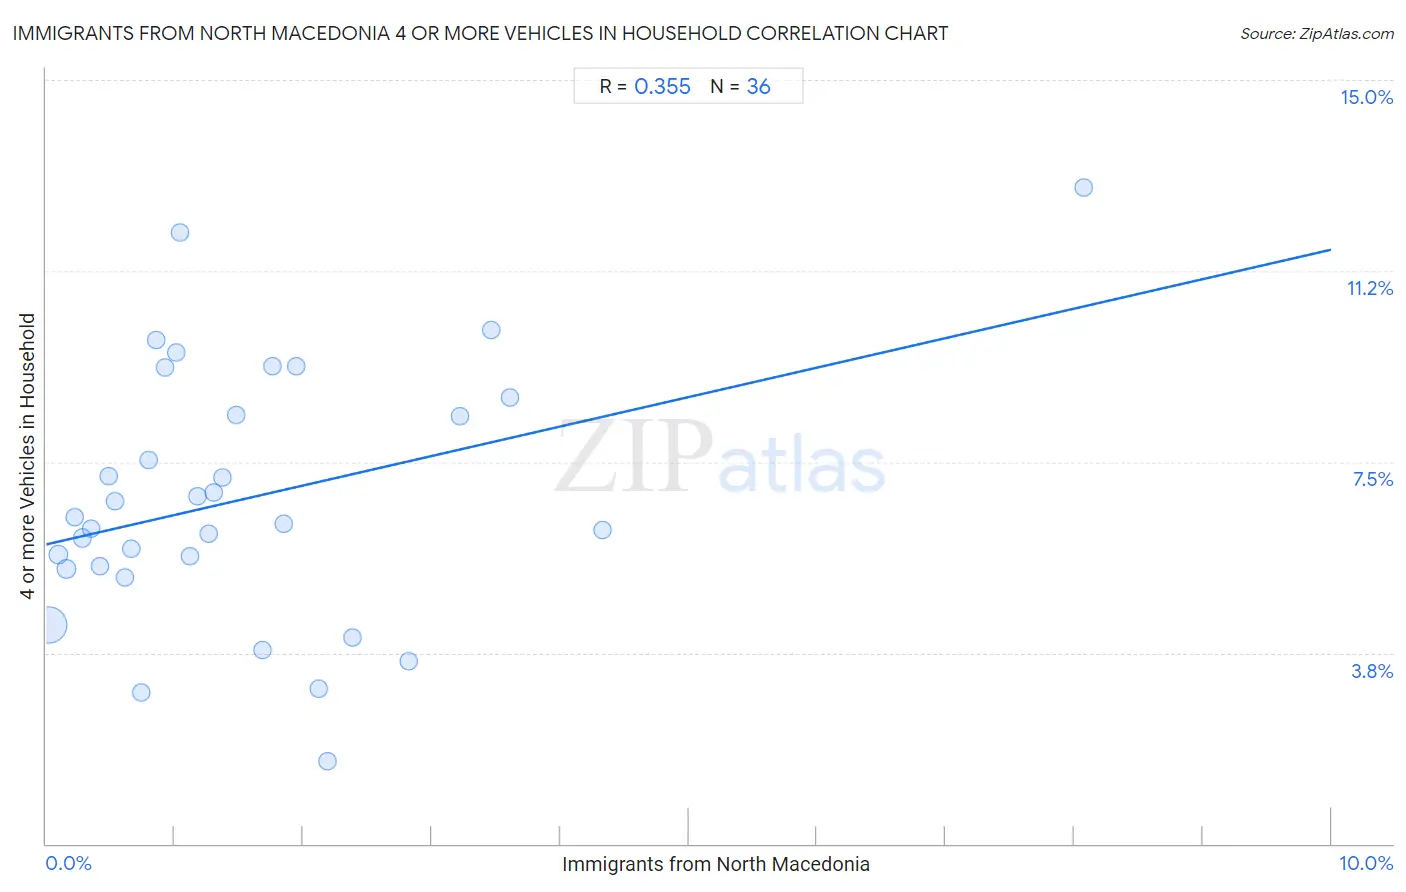
Immigrants from North Macedonia 4 or more Vehicles in Household Correlation Chart

The statistical analysis conducted on geographies consisting of 74,089,047 people shows a mild positive correlation between the proportion of Immigrants from North Macedonia and percentage of households with 4 or more vehicles available in the United States with a correlation coefficient (R) of 0.355 and weighted average of 5.7%. On average, for every 1% (one percent) increase in Immigrants from North Macedonia within a typical geography, there is an increase of 0.58% in percentage of households with 4 or more vehicles available.
Immigrants from North Macedonia 4 or more Vehicles in Household
It is essential to understand that the correlation between the percentage of Immigrants from North Macedonia and percentage of households with 4 or more vehicles available does not imply a direct cause-and-effect relationship. It remains uncertain whether the presence of Immigrants from North Macedonia influences an upward or downward trend in the level of percentage of households with 4 or more vehicles available within an area, or if Immigrants from North Macedonia simply ended up residing in those areas with higher or lower levels of percentage of households with 4 or more vehicles available due to other factors.

Demographics Similar to Immigrants from North Macedonia by 4 or more Vehicles in Household

In terms of 4 or more vehicles in household, the demographic groups most similar to Immigrants from North Macedonia are Immigrants from Ethiopia (5.7%, a difference of 0.030%), Immigrants from Eastern Africa (5.7%, a difference of 0.14%), Immigrants from Southern Europe (5.7%, a difference of 0.16%), Immigrants from Europe (5.7%, a difference of 0.26%), and Ugandan (5.7%, a difference of 0.28%).
DemographicsRating | Rank4 or more Vehicles in Household
Immigrants from Australia
3.8
/100
|
#239
Tragic
5.8%
Immigrants from Poland
3.8
/100
|
#240
Tragic
5.8%
Mongolians
3.7
/100
|
#241
Tragic
5.8%
Immigrants from Middle Africa
3.4
/100
|
#242
Tragic
5.8%
Immigrants from Czechoslovakia
3.2
/100
|
#243
Tragic
5.8%
Ethiopians
3.2
/100
|
#244
Tragic
5.8%
Bulgarians
3.1
/100
|
#245
Tragic
5.8%
Immigrants from North Macedonia
2.5
/100
|
#246
Tragic
5.7%
Immigrants from Ethiopia
2.4
/100
|
#247
Tragic
5.7%
Immigrants from Eastern Africa
2.4
/100
|
#248
Tragic
5.7%
Immigrants from Southern Europe
2.3
/100
|
#249
Tragic
5.7%
Immigrants from Europe
2.3
/100
|
#250
Tragic
5.7%
Ugandans
2.2
/100
|
#251
Tragic
5.7%
Sub-Saharan Africans
2.1
/100
|
#252
Tragic
5.7%
Immigrants from Cuba
1.6
/100
|
#253
Tragic
5.7%

Immigrants from North Macedonia 4 or more Vehicles in Household Correlation Summary

MeasurementImmigrants from North Macedonia Data4 or more Vehicles in Household Data
Minimum0.019%1.6%
Maximum8.1%12.9%
Range8.1%11.3%
Mean1.6%6.8%
Median1.1%6.3%
Interquartile 25% (IQ1)0.58%5.4%
Interquartile 75% (IQ3)2.0%8.6%
Interquartile Range (IQR)1.5%3.2%
Standard Deviation (Sample)1.5%2.5%
Standard Deviation (Population)1.5%2.5%

Correlation Details

Immigrants from North Macedonia PercentileSample Size4 or more Vehicles in Household
[
0.0%
-
0.5%
]
0.019%
59,599,4134.3%
[
0.0%
-
0.5%
]
0.093%
6,293,2835.7%
[
0.0%
-
0.5%
]
0.16%
2,680,3045.4%
[
0.0%
-
0.5%
]
0.22%
1,844,6886.4%
[
0.0%
-
0.5%
]
0.28%
894,9956.0%
[
0.0%
-
0.5%
]
0.35%
644,5646.2%
[
0.0%
-
0.5%
]
0.42%
267,0145.5%
[
0.0%
-
0.5%
]
0.48%
373,9207.2%
[
0.5%
-
1.0%
]
0.54%
193,9116.7%
[
0.5%
-
1.0%
]
0.61%
240,3355.2%
[
0.5%
-
1.0%
]
0.66%
210,7375.8%
[
0.5%
-
1.0%
]
0.74%
96,6783.0%
[
0.5%
-
1.0%
]
0.80%
153,2107.5%
[
0.5%
-
1.0%
]
0.86%
25,2889.9%
[
0.5%
-
1.0%
]
0.92%
12,8239.4%
[
1.0%
-
1.5%
]
1.01%
32,8519.6%
[
1.0%
-
1.5%
]
1.04%
13,88212.0%
[
1.0%
-
1.5%
]
1.12%
52,0335.6%
[
1.0%
-
1.5%
]
1.18%
61,6486.8%
[
1.0%
-
1.5%
]
1.26%
34,7506.1%
[
1.0%
-
1.5%
]
1.30%
20,4346.9%
[
1.0%
-
1.5%
]
1.37%
82,2087.2%
[
1.0%
-
1.5%
]
1.48%
43,3048.4%
[
1.5%
-
2.0%
]
1.68%
3,0353.8%
[
1.5%
-
2.0%
]
1.76%
16,7519.4%
[
1.5%
-
2.0%
]
1.85%
42,5226.3%
[
1.5%
-
2.0%
]
1.95%
26,0039.4%
[
2.0%
-
2.5%
]
2.12%
16,8423.0%
[
2.0%
-
2.5%
]
2.19%
4,4391.6%
[
2.0%
-
2.5%
]
2.38%
3,7814.1%
[
2.5%
-
3.0%
]
2.82%
64,9443.6%
[
3.0%
-
3.5%
]
3.22%
10,9428.4%
[
3.0%
-
3.5%
]
3.47%
2,99910.1%
[
3.5%
-
4.0%
]
3.61%
21,8068.8%
[
4.0%
-
4.5%
]
4.33%
1,4096.2%
[
8.0%
-
8.5%
]
8.07%
1,30112.9%