Immigrants from Bulgaria 4 or more Vehicles in Household
COMPARE
Immigrants from Bulgaria
Select to Compare
4 or more Vehicles in Household
Immigrants from Bulgaria 4 or more Vehicles in Household
5.5%
4+ VEHICLES AVAILABLE
0.5/ 100
METRIC RATING
277th/ 347
METRIC RANK
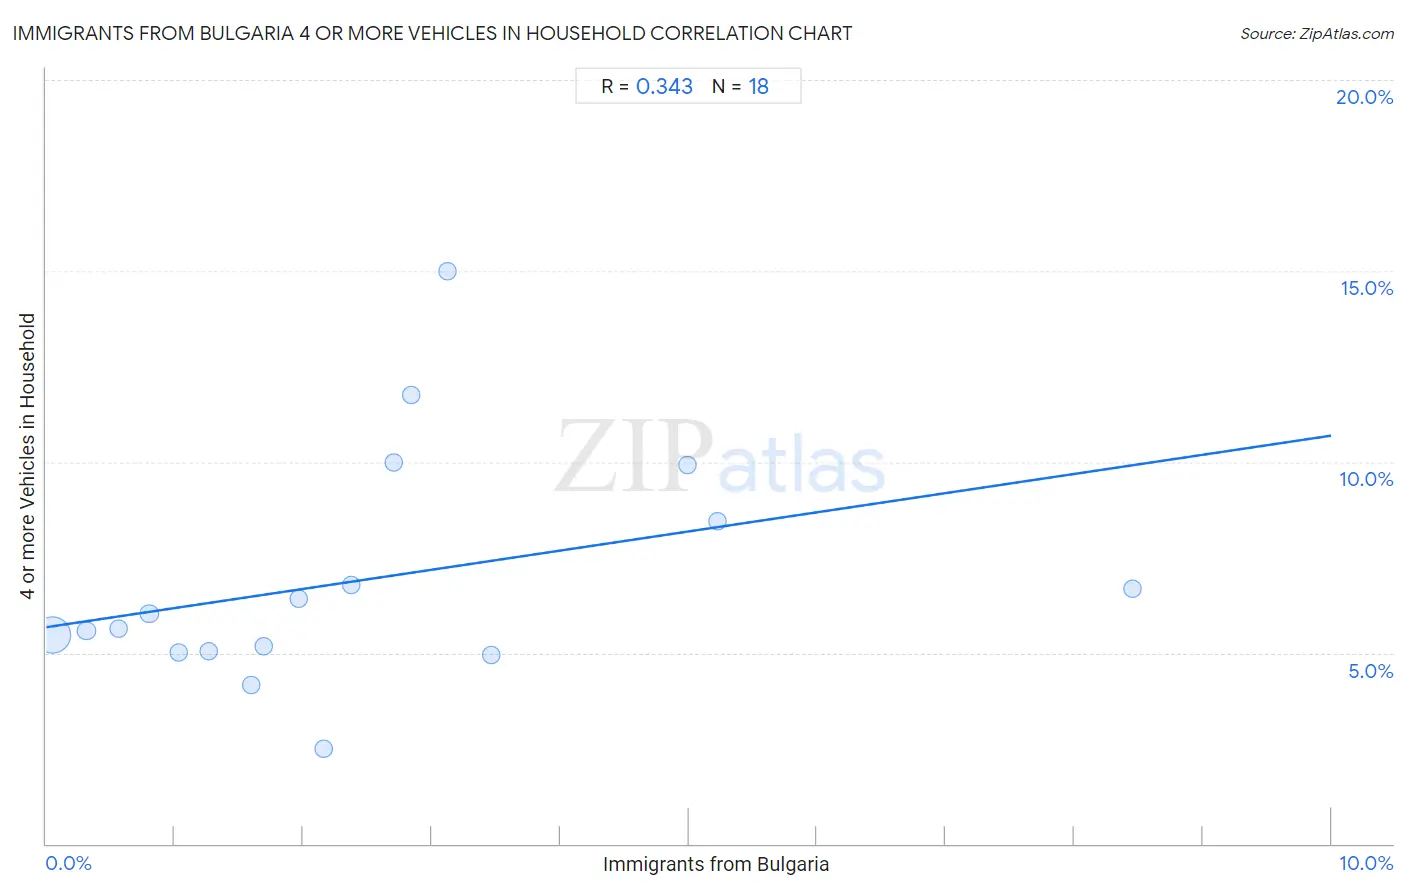
Immigrants from Bulgaria 4 or more Vehicles in Household Correlation Chart
The statistical analysis conducted on geographies consisting of 172,084,774 people shows a mild positive correlation between the proportion of Immigrants from Bulgaria and percentage of households with 4 or more vehicles available in the United States with a correlation coefficient (R) of 0.343 and weighted average of 5.5%. On average, for every 1% (one percent) increase in Immigrants from Bulgaria within a typical geography, there is an increase of 0.50% in percentage of households with 4 or more vehicles available.
It is essential to understand that the correlation between the percentage of Immigrants from Bulgaria and percentage of households with 4 or more vehicles available does not imply a direct cause-and-effect relationship. It remains uncertain whether the presence of Immigrants from Bulgaria influences an upward or downward trend in the level of percentage of households with 4 or more vehicles available within an area, or if Immigrants from Bulgaria simply ended up residing in those areas with higher or lower levels of percentage of households with 4 or more vehicles available due to other factors.
Demographics Similar to Immigrants from Bulgaria by 4 or more Vehicles in Household
In terms of 4 or more vehicles in household, the demographic groups most similar to Immigrants from Bulgaria are Immigrants from Latvia (5.5%, a difference of 0.12%), Cambodian (5.5%, a difference of 0.13%), Black/African American (5.5%, a difference of 0.25%), Macedonian (5.5%, a difference of 0.37%), and Immigrants from Kazakhstan (5.5%, a difference of 0.40%).
| Demographics | Rating | Rank | 4 or more Vehicles in Household |
| Okinawans | 0.6 /100 | #270 | Tragic 5.5% |
| Immigrants from Sudan | 0.6 /100 | #271 | Tragic 5.5% |
| Immigrants from Kazakhstan | 0.6 /100 | #272 | Tragic 5.5% |
| Macedonians | 0.6 /100 | #273 | Tragic 5.5% |
| Blacks/African Americans | 0.6 /100 | #274 | Tragic 5.5% |
| Cambodians | 0.5 /100 | #275 | Tragic 5.5% |
| Immigrants from Latvia | 0.5 /100 | #276 | Tragic 5.5% |
| Immigrants from Bulgaria | 0.5 /100 | #277 | Tragic 5.5% |
| Immigrants from Eastern Europe | 0.4 /100 | #278 | Tragic 5.4% |
| Immigrants from Uruguay | 0.3 /100 | #279 | Tragic 5.4% |
| Alsatians | 0.3 /100 | #280 | Tragic 5.4% |
| Immigrants from Western Africa | 0.3 /100 | #281 | Tragic 5.4% |
| Immigrants from Spain | 0.3 /100 | #282 | Tragic 5.4% |
| Immigrants from Ireland | 0.3 /100 | #283 | Tragic 5.4% |
| Brazilians | 0.3 /100 | #284 | Tragic 5.4% |
Immigrants from Bulgaria 4 or more Vehicles in Household Correlation Summary
| Measurement | Immigrants from Bulgaria Data | 4 or more Vehicles in Household Data |
| Minimum | 0.050% | 2.5% |
| Maximum | 8.5% | 15.0% |
| Range | 8.4% | 12.5% |
| Mean | 2.5% | 6.9% |
| Median | 2.1% | 5.8% |
| Interquartile 25% (IQ1) | 1.0% | 5.1% |
| Interquartile 75% (IQ3) | 3.1% | 8.4% |
| Interquartile Range (IQR) | 2.1% | 3.4% |
| Standard Deviation (Sample) | 2.1% | 3.0% |
| Standard Deviation (Population) | 2.0% | 3.0% |
Correlation Details
| Immigrants from Bulgaria Percentile | Sample Size | 4 or more Vehicles in Household |
[ 0.0% - 0.5% ] 0.050% | 161,032,930 | 5.5% |
[ 0.0% - 0.5% ] 0.32% | 7,136,932 | 5.6% |
[ 0.5% - 1.0% ] 0.56% | 1,946,422 | 5.6% |
[ 0.5% - 1.0% ] 0.80% | 843,389 | 6.0% |
[ 1.0% - 1.5% ] 1.03% | 443,079 | 5.0% |
[ 1.0% - 1.5% ] 1.26% | 289,169 | 5.1% |
[ 1.5% - 2.0% ] 1.60% | 150,556 | 4.1% |
[ 1.5% - 2.0% ] 1.70% | 96,601 | 5.2% |
[ 1.5% - 2.0% ] 1.97% | 6,403 | 6.4% |
[ 2.0% - 2.5% ] 2.16% | 41,436 | 2.5% |
[ 2.0% - 2.5% ] 2.38% | 71,461 | 6.8% |
[ 2.5% - 3.0% ] 2.71% | 6,978 | 10.0% |
[ 2.5% - 3.0% ] 2.84% | 1,727 | 11.7% |
[ 3.0% - 3.5% ] 3.13% | 3,294 | 15.0% |
[ 3.0% - 3.5% ] 3.46% | 9,960 | 4.9% |
[ 4.5% - 5.0% ] 4.99% | 1,123 | 9.9% |
[ 5.0% - 5.5% ] 5.23% | 3,042 | 8.4% |
[ 8.0% - 8.5% ] 8.46% | 272 | 6.7% |