Costa Rican Male Disability
COMPARE
Costa Rican
Select to Compare
Male Disability
Costa Rican Male Disability
11.0%
DISABILITY | MALES
78.0/ 100
METRIC RATING
145th/ 347
METRIC RANK
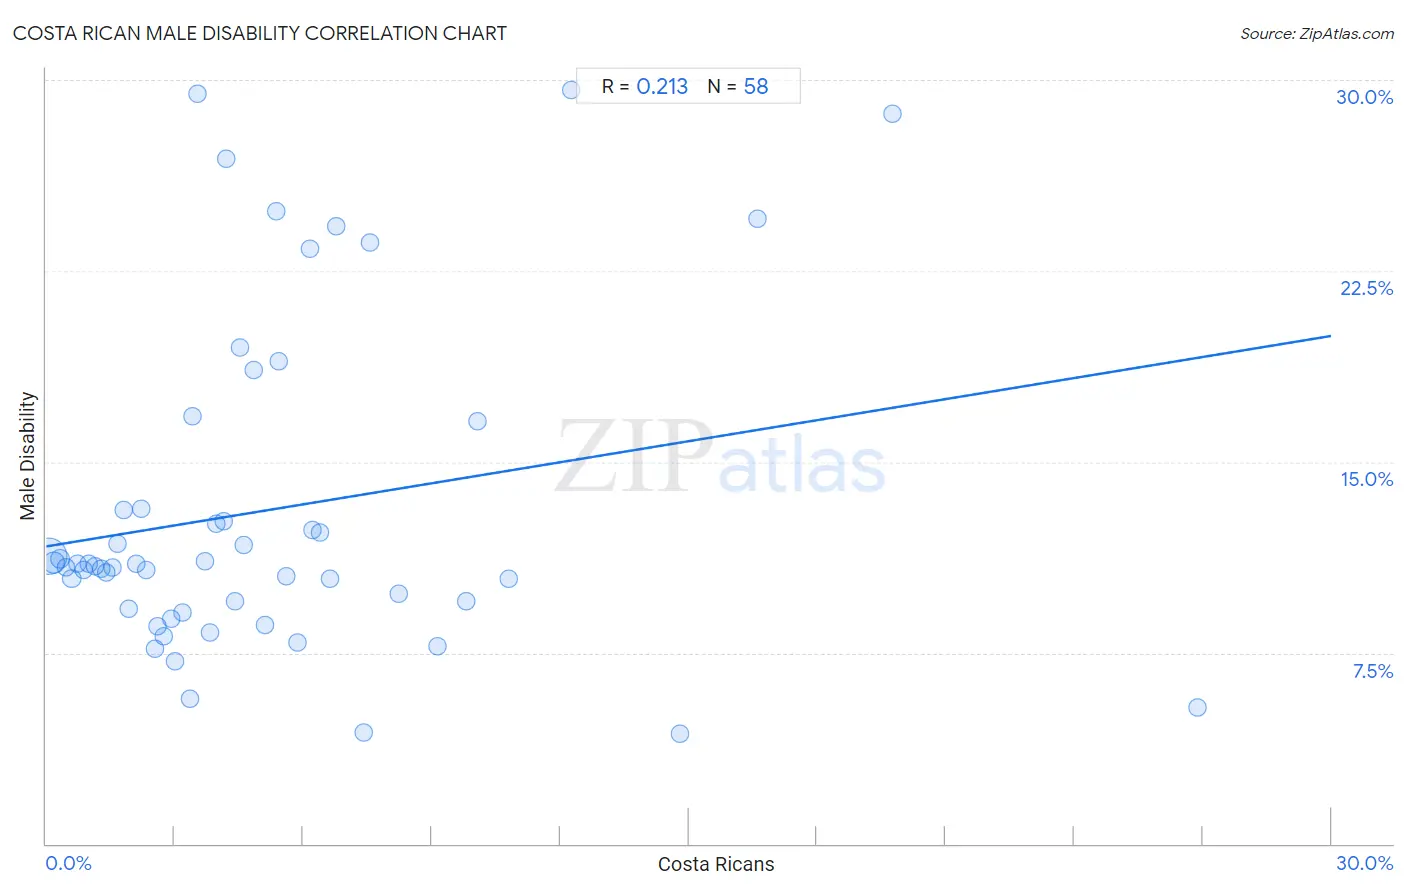
Costa Rican Male Disability Correlation Chart
The statistical analysis conducted on geographies consisting of 253,572,614 people shows a weak positive correlation between the proportion of Costa Ricans and percentage of males with a disability in the United States with a correlation coefficient (R) of 0.213 and weighted average of 11.0%. On average, for every 1% (one percent) increase in Costa Ricans within a typical geography, there is an increase of 0.28% in percentage of males with a disability.
It is essential to understand that the correlation between the percentage of Costa Ricans and percentage of males with a disability does not imply a direct cause-and-effect relationship. It remains uncertain whether the presence of Costa Ricans influences an upward or downward trend in the level of percentage of males with a disability within an area, or if Costa Ricans simply ended up residing in those areas with higher or lower levels of percentage of males with a disability due to other factors.
Demographics Similar to Costa Ricans by Male Disability
In terms of male disability, the demographic groups most similar to Costa Ricans are Kenyan (11.0%, a difference of 0.010%), Korean (11.0%, a difference of 0.040%), Immigrants from Croatia (11.0%, a difference of 0.060%), Sudanese (11.0%, a difference of 0.070%), and Immigrants from Denmark (11.0%, a difference of 0.13%).
| Demographics | Rating | Rank | Male Disability |
| Nigerians | 81.9 /100 | #138 | Excellent 11.0% |
| South Africans | 81.7 /100 | #139 | Excellent 11.0% |
| Immigrants from Italy | 81.5 /100 | #140 | Excellent 11.0% |
| Arabs | 81.5 /100 | #141 | Excellent 11.0% |
| Immigrants from Sudan | 81.5 /100 | #142 | Excellent 11.0% |
| Moroccans | 80.7 /100 | #143 | Excellent 11.0% |
| Kenyans | 78.1 /100 | #144 | Good 11.0% |
| Costa Ricans | 78.0 /100 | #145 | Good 11.0% |
| Koreans | 77.5 /100 | #146 | Good 11.0% |
| Immigrants from Croatia | 77.3 /100 | #147 | Good 11.0% |
| Sudanese | 77.1 /100 | #148 | Good 11.0% |
| Immigrants from Denmark | 76.4 /100 | #149 | Good 11.0% |
| Immigrants from Guatemala | 75.1 /100 | #150 | Good 11.0% |
| Cubans | 74.9 /100 | #151 | Good 11.0% |
| Immigrants from Albania | 74.4 /100 | #152 | Good 11.0% |
Costa Rican Male Disability Correlation Summary
| Measurement | Costa Rican Data | Male Disability Data |
| Minimum | 0.054% | 4.3% |
| Maximum | 26.9% | 29.6% |
| Range | 26.8% | 25.3% |
| Mean | 5.2% | 13.1% |
| Median | 3.9% | 11.0% |
| Interquartile 25% (IQ1) | 1.9% | 9.2% |
| Interquartile 75% (IQ3) | 6.4% | 13.1% |
| Interquartile Range (IQR) | 4.5% | 3.9% |
| Standard Deviation (Sample) | 5.0% | 6.5% |
| Standard Deviation (Population) | 5.0% | 6.4% |
Correlation Details
| Costa Rican Percentile | Sample Size | Male Disability |
[ 0.0% - 0.5% ] 0.054% | 193,644,793 | 11.3% |
[ 0.0% - 0.5% ] 0.19% | 35,470,393 | 11.0% |
[ 0.0% - 0.5% ] 0.33% | 11,355,519 | 11.2% |
[ 0.0% - 0.5% ] 0.46% | 4,996,050 | 10.8% |
[ 0.5% - 1.0% ] 0.59% | 2,813,197 | 10.4% |
[ 0.5% - 1.0% ] 0.73% | 1,719,023 | 11.0% |
[ 0.5% - 1.0% ] 0.87% | 890,528 | 10.7% |
[ 1.0% - 1.5% ] 1.00% | 645,778 | 11.0% |
[ 1.0% - 1.5% ] 1.13% | 353,272 | 10.9% |
[ 1.0% - 1.5% ] 1.28% | 323,230 | 10.8% |
[ 1.0% - 1.5% ] 1.41% | 218,565 | 10.7% |
[ 1.5% - 2.0% ] 1.55% | 140,157 | 10.8% |
[ 1.5% - 2.0% ] 1.68% | 147,760 | 11.8% |
[ 1.5% - 2.0% ] 1.81% | 73,547 | 13.1% |
[ 1.5% - 2.0% ] 1.93% | 202,355 | 9.2% |
[ 2.0% - 2.5% ] 2.10% | 90,548 | 11.0% |
[ 2.0% - 2.5% ] 2.22% | 38,329 | 13.1% |
[ 2.0% - 2.5% ] 2.33% | 35,924 | 10.8% |
[ 2.5% - 3.0% ] 2.54% | 7,766 | 7.6% |
[ 2.5% - 3.0% ] 2.60% | 45,765 | 8.6% |
[ 2.5% - 3.0% ] 2.74% | 30,438 | 8.1% |
[ 2.5% - 3.0% ] 2.91% | 70,544 | 8.8% |
[ 3.0% - 3.5% ] 3.01% | 40,321 | 7.2% |
[ 3.0% - 3.5% ] 3.19% | 8,266 | 9.1% |
[ 3.0% - 3.5% ] 3.35% | 24,178 | 5.7% |
[ 3.0% - 3.5% ] 3.42% | 12,649 | 16.8% |
[ 3.5% - 4.0% ] 3.53% | 1,273 | 29.5% |
[ 3.5% - 4.0% ] 3.71% | 2,292 | 11.1% |
[ 3.5% - 4.0% ] 3.83% | 21,507 | 8.3% |
[ 3.5% - 4.0% ] 3.96% | 30,866 | 12.6% |
[ 4.0% - 4.5% ] 4.14% | 8,954 | 12.7% |
[ 4.0% - 4.5% ] 4.20% | 786 | 26.9% |
[ 4.0% - 4.5% ] 4.41% | 9,781 | 9.5% |
[ 4.5% - 5.0% ] 4.52% | 9,105 | 19.5% |
[ 4.5% - 5.0% ] 4.60% | 587 | 11.7% |
[ 4.5% - 5.0% ] 4.84% | 3,309 | 18.6% |
[ 5.0% - 5.5% ] 5.10% | 16,602 | 8.6% |
[ 5.0% - 5.5% ] 5.36% | 616 | 24.8% |
[ 5.0% - 5.5% ] 5.42% | 277 | 19.0% |
[ 5.5% - 6.0% ] 5.60% | 1,519 | 10.5% |
[ 5.5% - 6.0% ] 5.85% | 8,287 | 7.9% |
[ 6.0% - 6.5% ] 6.15% | 1,594 | 23.4% |
[ 6.0% - 6.5% ] 6.22% | 5,373 | 12.3% |
[ 6.0% - 6.5% ] 6.39% | 5,226 | 12.2% |
[ 6.5% - 7.0% ] 6.61% | 9,676 | 10.4% |
[ 6.5% - 7.0% ] 6.78% | 915 | 24.3% |
[ 7.0% - 7.5% ] 7.41% | 297 | 4.4% |
[ 7.5% - 8.0% ] 7.55% | 159 | 23.6% |
[ 8.0% - 8.5% ] 8.24% | 14,778 | 9.8% |
[ 9.0% - 9.5% ] 9.14% | 372 | 7.8% |
[ 9.5% - 10.0% ] 9.80% | 11,906 | 9.5% |
[ 10.0% - 10.5% ] 10.07% | 1,132 | 16.6% |
[ 10.5% - 11.0% ] 10.81% | 657 | 10.4% |
[ 12.0% - 12.5% ] 12.24% | 98 | 29.6% |
[ 14.5% - 15.0% ] 14.80% | 4,771 | 4.3% |
[ 16.5% - 17.0% ] 16.60% | 253 | 24.5% |
[ 19.5% - 20.0% ] 19.76% | 167 | 28.7% |
[ 26.5% - 27.0% ] 26.88% | 584 | 5.4% |