Alaskan Athabascan vs Spanish Female Disability
COMPARE
Alaskan Athabascan
Spanish
Female Disability
Female Disability Comparison
Alaskan Athabascans
Spanish
13.9%
FEMALE DISABILITY
0.0/ 100
METRIC RATING
315th/ 347
METRIC RANK
13.0%
FEMALE DISABILITY
0.1/ 100
METRIC RATING
277th/ 347
METRIC RANK
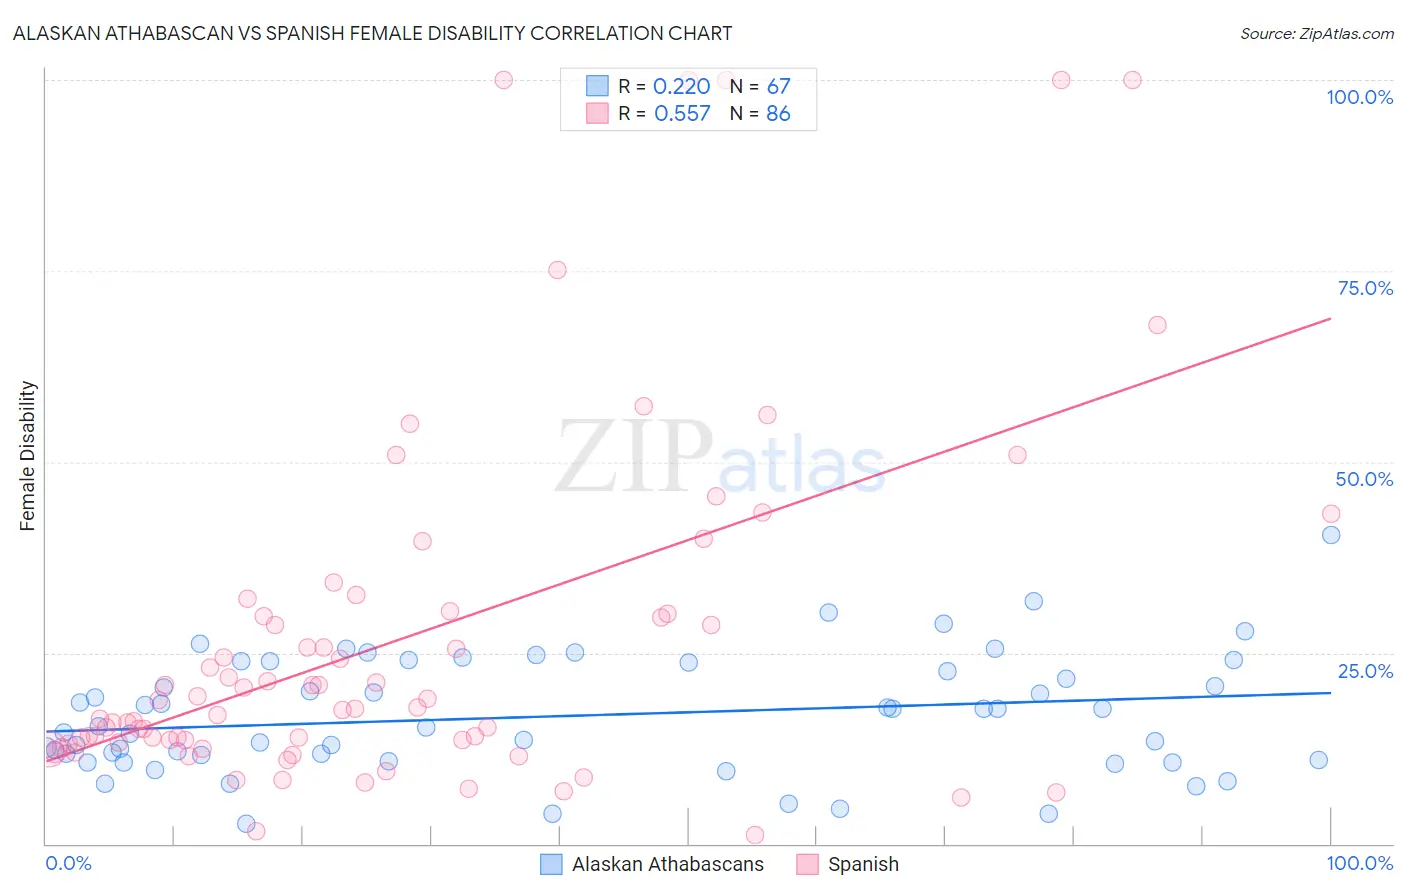
Alaskan Athabascan vs Spanish Female Disability Correlation Chart
The statistical analysis conducted on geographies consisting of 45,817,882 people shows a weak positive correlation between the proportion of Alaskan Athabascans and percentage of females with a disability in the United States with a correlation coefficient (R) of 0.220 and weighted average of 13.9%. Similarly, the statistical analysis conducted on geographies consisting of 422,090,479 people shows a substantial positive correlation between the proportion of Spanish and percentage of females with a disability in the United States with a correlation coefficient (R) of 0.557 and weighted average of 13.0%, a difference of 7.1%.
Female Disability Correlation Summary
| Measurement | Alaskan Athabascan | Spanish |
| Minimum | 2.6% | 1.1% |
| Maximum | 40.4% | 100.0% |
| Range | 37.8% | 98.9% |
| Mean | 16.7% | 26.7% |
| Median | 15.4% | 17.7% |
| Interquartile 25% (IQ1) | 10.9% | 13.3% |
| Interquartile 75% (IQ3) | 23.7% | 30.0% |
| Interquartile Range (IQR) | 12.8% | 16.8% |
| Standard Deviation (Sample) | 7.6% | 23.4% |
| Standard Deviation (Population) | 7.6% | 23.2% |
Similar Demographics by Female Disability
Demographics Similar to Alaskan Athabascans by Female Disability
In terms of female disability, the demographic groups most similar to Alaskan Athabascans are Spanish American (14.0%, a difference of 0.36%), Chippewa (14.0%, a difference of 0.47%), Paiute (14.0%, a difference of 0.58%), Puget Sound Salish (13.8%, a difference of 0.59%), and Blackfeet (13.8%, a difference of 0.69%).
| Demographics | Rating | Rank | Female Disability |
| Cree | 0.0 /100 | #308 | Tragic 13.7% |
| French American Indians | 0.0 /100 | #309 | Tragic 13.7% |
| Apache | 0.0 /100 | #310 | Tragic 13.7% |
| Hopi | 0.0 /100 | #311 | Tragic 13.7% |
| Delaware | 0.0 /100 | #312 | Tragic 13.8% |
| Blackfeet | 0.0 /100 | #313 | Tragic 13.8% |
| Puget Sound Salish | 0.0 /100 | #314 | Tragic 13.8% |
| Alaskan Athabascans | 0.0 /100 | #315 | Tragic 13.9% |
| Spanish Americans | 0.0 /100 | #316 | Tragic 14.0% |
| Chippewa | 0.0 /100 | #317 | Tragic 14.0% |
| Paiute | 0.0 /100 | #318 | Tragic 14.0% |
| Iroquois | 0.0 /100 | #319 | Tragic 14.0% |
| Americans | 0.0 /100 | #320 | Tragic 14.1% |
| Potawatomi | 0.0 /100 | #321 | Tragic 14.1% |
| Pueblo | 0.0 /100 | #322 | Tragic 14.1% |
Demographics Similar to Spanish by Female Disability
In terms of female disability, the demographic groups most similar to Spanish are Scottish (13.0%, a difference of 0.080%), Immigrants from Dominica (13.0%, a difference of 0.20%), Cheyenne (13.0%, a difference of 0.25%), Portuguese (13.0%, a difference of 0.31%), and Arapaho (13.0%, a difference of 0.33%).
| Demographics | Rating | Rank | Female Disability |
| Immigrants | Liberia | 0.3 /100 | #270 | Tragic 12.9% |
| Dutch | 0.2 /100 | #271 | Tragic 12.9% |
| Germans | 0.1 /100 | #272 | Tragic 12.9% |
| Sioux | 0.1 /100 | #273 | Tragic 12.9% |
| Portuguese | 0.1 /100 | #274 | Tragic 13.0% |
| Cheyenne | 0.1 /100 | #275 | Tragic 13.0% |
| Immigrants | Dominica | 0.1 /100 | #276 | Tragic 13.0% |
| Spanish | 0.1 /100 | #277 | Tragic 13.0% |
| Scottish | 0.1 /100 | #278 | Tragic 13.0% |
| Arapaho | 0.1 /100 | #279 | Tragic 13.0% |
| Irish | 0.1 /100 | #280 | Tragic 13.1% |
| U.S. Virgin Islanders | 0.1 /100 | #281 | Tragic 13.1% |
| Welsh | 0.0 /100 | #282 | Tragic 13.1% |
| English | 0.0 /100 | #283 | Tragic 13.1% |
| Hmong | 0.0 /100 | #284 | Tragic 13.1% |