Zip Codes with the Highest Percentage of Population Employed in Architecture & Engineering in West Bend, WI
RELATED REPORTS & OPTIONS
Architecture & Engineering
West Bend
Compare Zip Codes
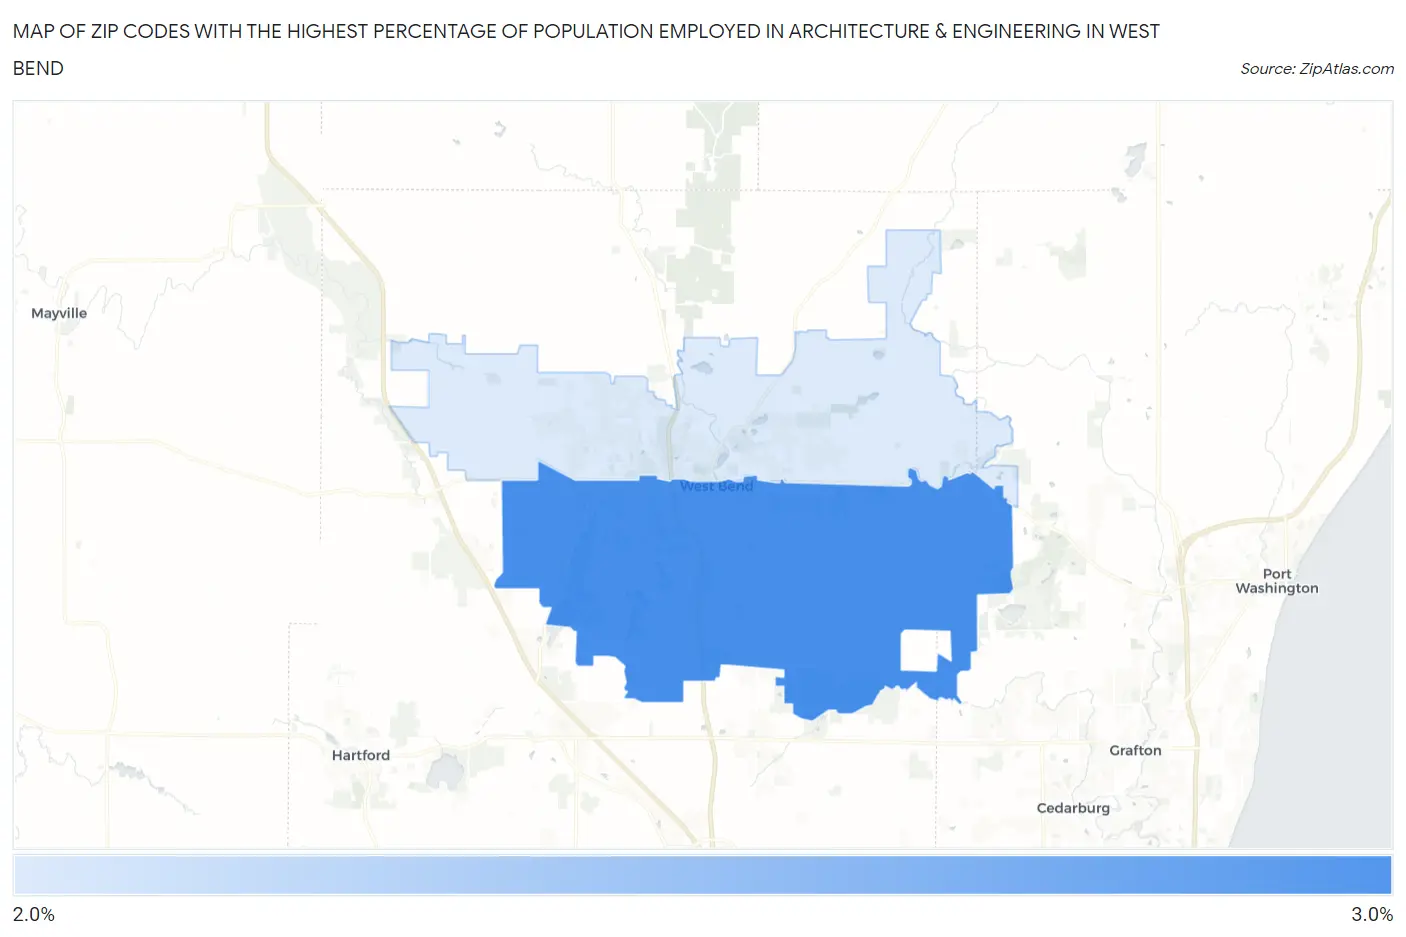
Map of Zip Codes with the Highest Percentage of Population Employed in Architecture & Engineering in West Bend
2.7%
2.8%
Zip Codes with the Highest Percentage of Population Employed in Architecture & Engineering in West Bend, WI
| Zip Code | % Employed | vs State | vs National | |
| 1. | 53095 | 2.8% | 2.2%(+0.535)#143 | 2.1%(+0.630)#5,870 |
| 2. | 53090 | 2.7% | 2.2%(+0.459)#152 | 2.1%(+0.553)#6,152 |
1
Common Questions
What are the Top Zip Codes with the Highest Percentage of Population Employed in Architecture & Engineering in West Bend, WI?
Top Zip Codes with the Highest Percentage of Population Employed in Architecture & Engineering in West Bend, WI are:
What zip code has the Highest Percentage of Population Employed in Architecture & Engineering in West Bend, WI?
53095 has the Highest Percentage of Population Employed in Architecture & Engineering in West Bend, WI with 2.8%.
What is the Percentage of Population Employed in Architecture & Engineering in West Bend, WI?
Percentage of Population Employed in Architecture & Engineering in West Bend is 2.1%.
What is the Percentage of Population Employed in Architecture & Engineering in Wisconsin?
Percentage of Population Employed in Architecture & Engineering in Wisconsin is 2.2%.
What is the Percentage of Population Employed in Architecture & Engineering in the United States?
Percentage of Population Employed in Architecture & Engineering in the United States is 2.1%.