Zip Codes with the Highest Percentage of Population Employed in Architecture & Engineering in La Crosse, WI
RELATED REPORTS & OPTIONS
Architecture & Engineering
La Crosse
Compare Zip Codes
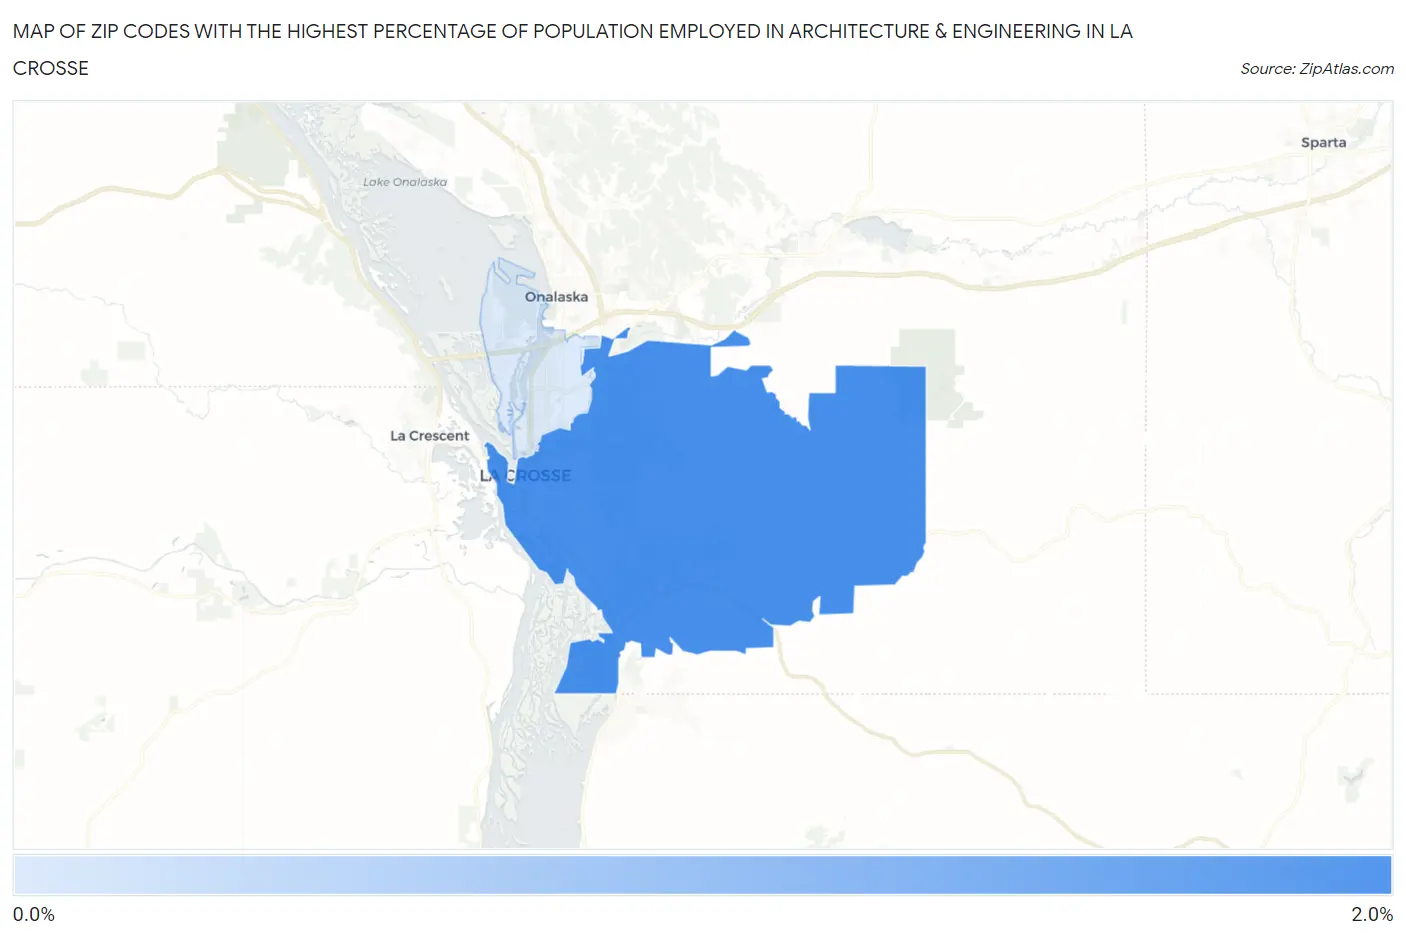
Map of Zip Codes with the Highest Percentage of Population Employed in Architecture & Engineering in La Crosse
0.78%
1.6%
Zip Codes with the Highest Percentage of Population Employed in Architecture & Engineering in La Crosse, WI
| Zip Code | % Employed | vs State | vs National | |
| 1. | 54601 | 1.6% | 2.2%(-0.644)#355 | 2.1%(-0.550)#12,188 |
| 2. | 54603 | 0.78% | 2.2%(-1.46)#583 | 2.1%(-1.37)#18,269 |
1
Common Questions
What are the Top Zip Codes with the Highest Percentage of Population Employed in Architecture & Engineering in La Crosse, WI?
Top Zip Codes with the Highest Percentage of Population Employed in Architecture & Engineering in La Crosse, WI are:
What zip code has the Highest Percentage of Population Employed in Architecture & Engineering in La Crosse, WI?
54601 has the Highest Percentage of Population Employed in Architecture & Engineering in La Crosse, WI with 1.6%.
What is the Percentage of Population Employed in Architecture & Engineering in La Crosse, WI?
Percentage of Population Employed in Architecture & Engineering in La Crosse is 1.4%.
What is the Percentage of Population Employed in Architecture & Engineering in Wisconsin?
Percentage of Population Employed in Architecture & Engineering in Wisconsin is 2.2%.
What is the Percentage of Population Employed in Architecture & Engineering in the United States?
Percentage of Population Employed in Architecture & Engineering in the United States is 2.1%.