Zip Codes with the Highest Percentage of Population Employed in Installation, Maintenance & Repair in West Bend, WI
RELATED REPORTS & OPTIONS
Installation, Maintenance & Repair
West Bend
Compare Zip Codes
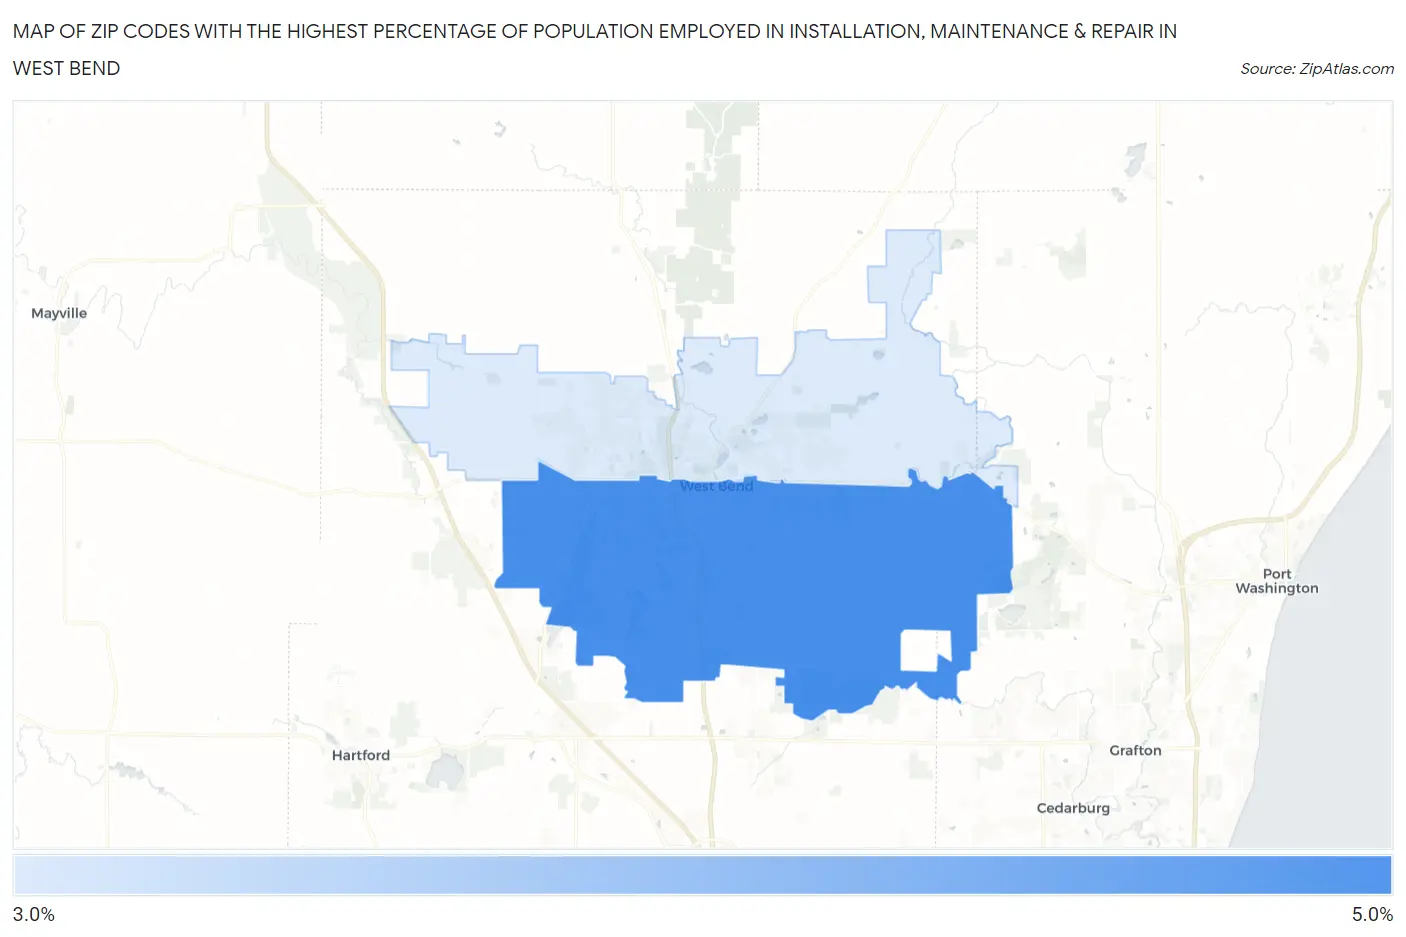
Map of Zip Codes with the Highest Percentage of Population Employed in Installation, Maintenance & Repair in West Bend
3.1%
4.2%
Zip Codes with the Highest Percentage of Population Employed in Installation, Maintenance & Repair in West Bend, WI
| Zip Code | % Employed | vs State | vs National | |
| 1. | 53095 | 4.2% | 3.3%(+0.820)#343 | 3.1%(+1.09)#11,709 |
| 2. | 53090 | 3.1% | 3.3%(-0.269)#505 | 3.1%(-0.003)#16,684 |
1
Common Questions
What are the Top Zip Codes with the Highest Percentage of Population Employed in Installation, Maintenance & Repair in West Bend, WI?
Top Zip Codes with the Highest Percentage of Population Employed in Installation, Maintenance & Repair in West Bend, WI are:
What zip code has the Highest Percentage of Population Employed in Installation, Maintenance & Repair in West Bend, WI?
53095 has the Highest Percentage of Population Employed in Installation, Maintenance & Repair in West Bend, WI with 4.2%.
What is the Percentage of Population Employed in Installation, Maintenance & Repair in West Bend, WI?
Percentage of Population Employed in Installation, Maintenance & Repair in West Bend is 3.7%.
What is the Percentage of Population Employed in Installation, Maintenance & Repair in Wisconsin?
Percentage of Population Employed in Installation, Maintenance & Repair in Wisconsin is 3.3%.
What is the Percentage of Population Employed in Installation, Maintenance & Repair in the United States?
Percentage of Population Employed in Installation, Maintenance & Repair in the United States is 3.1%.