Zip Codes with the Highest Percentage of Population Employed in Architecture & Engineering in Janesville, WI
RELATED REPORTS & OPTIONS
Architecture & Engineering
Janesville
Compare Zip Codes
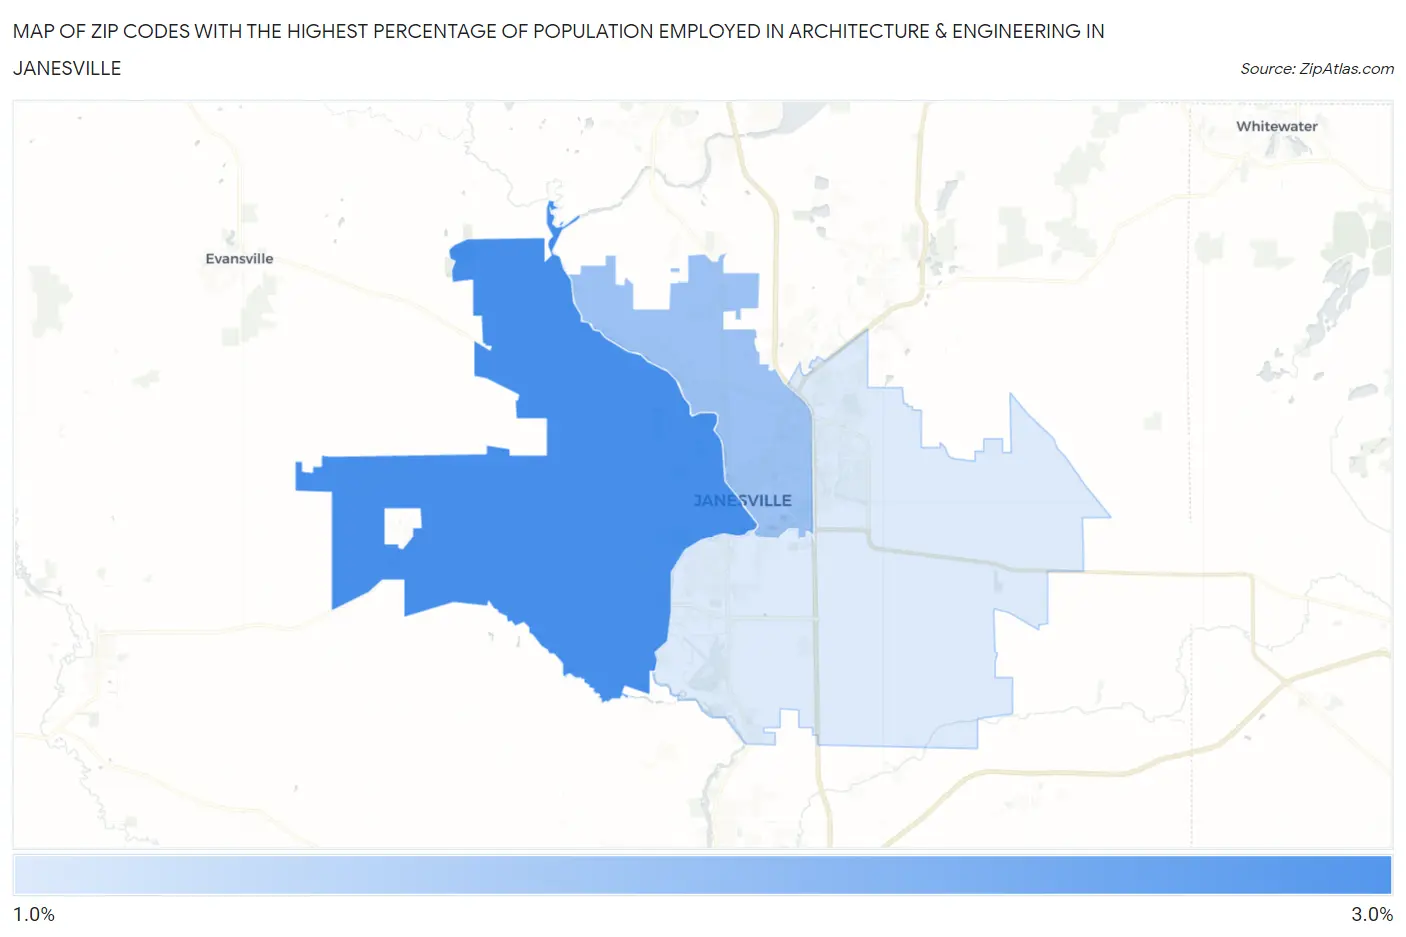
Map of Zip Codes with the Highest Percentage of Population Employed in Architecture & Engineering in Janesville
1.7%
2.6%
Zip Codes with the Highest Percentage of Population Employed in Architecture & Engineering in Janesville, WI
| Zip Code | % Employed | vs State | vs National | |
| 1. | 53548 | 2.6% | 2.2%(+0.313)#178 | 2.1%(+0.407)#6,762 |
| 2. | 53545 | 2.1% | 2.2%(-0.158)#253 | 2.1%(-0.064)#9,129 |
| 3. | 53546 | 1.7% | 2.2%(-0.515)#331 | 2.1%(-0.421)#11,306 |
1
Common Questions
What are the Top Zip Codes with the Highest Percentage of Population Employed in Architecture & Engineering in Janesville, WI?
Top Zip Codes with the Highest Percentage of Population Employed in Architecture & Engineering in Janesville, WI are:
What zip code has the Highest Percentage of Population Employed in Architecture & Engineering in Janesville, WI?
53548 has the Highest Percentage of Population Employed in Architecture & Engineering in Janesville, WI with 2.6%.
What is the Percentage of Population Employed in Architecture & Engineering in Janesville, WI?
Percentage of Population Employed in Architecture & Engineering in Janesville is 2.0%.
What is the Percentage of Population Employed in Architecture & Engineering in Wisconsin?
Percentage of Population Employed in Architecture & Engineering in Wisconsin is 2.2%.
What is the Percentage of Population Employed in Architecture & Engineering in the United States?
Percentage of Population Employed in Architecture & Engineering in the United States is 2.1%.