Zip Codes with the Highest Percentage of Population Employed in Architecture & Engineering in Wisconsin Rapids, WI
RELATED REPORTS & OPTIONS
Architecture & Engineering
Wisconsin Rapids
Compare Zip Codes
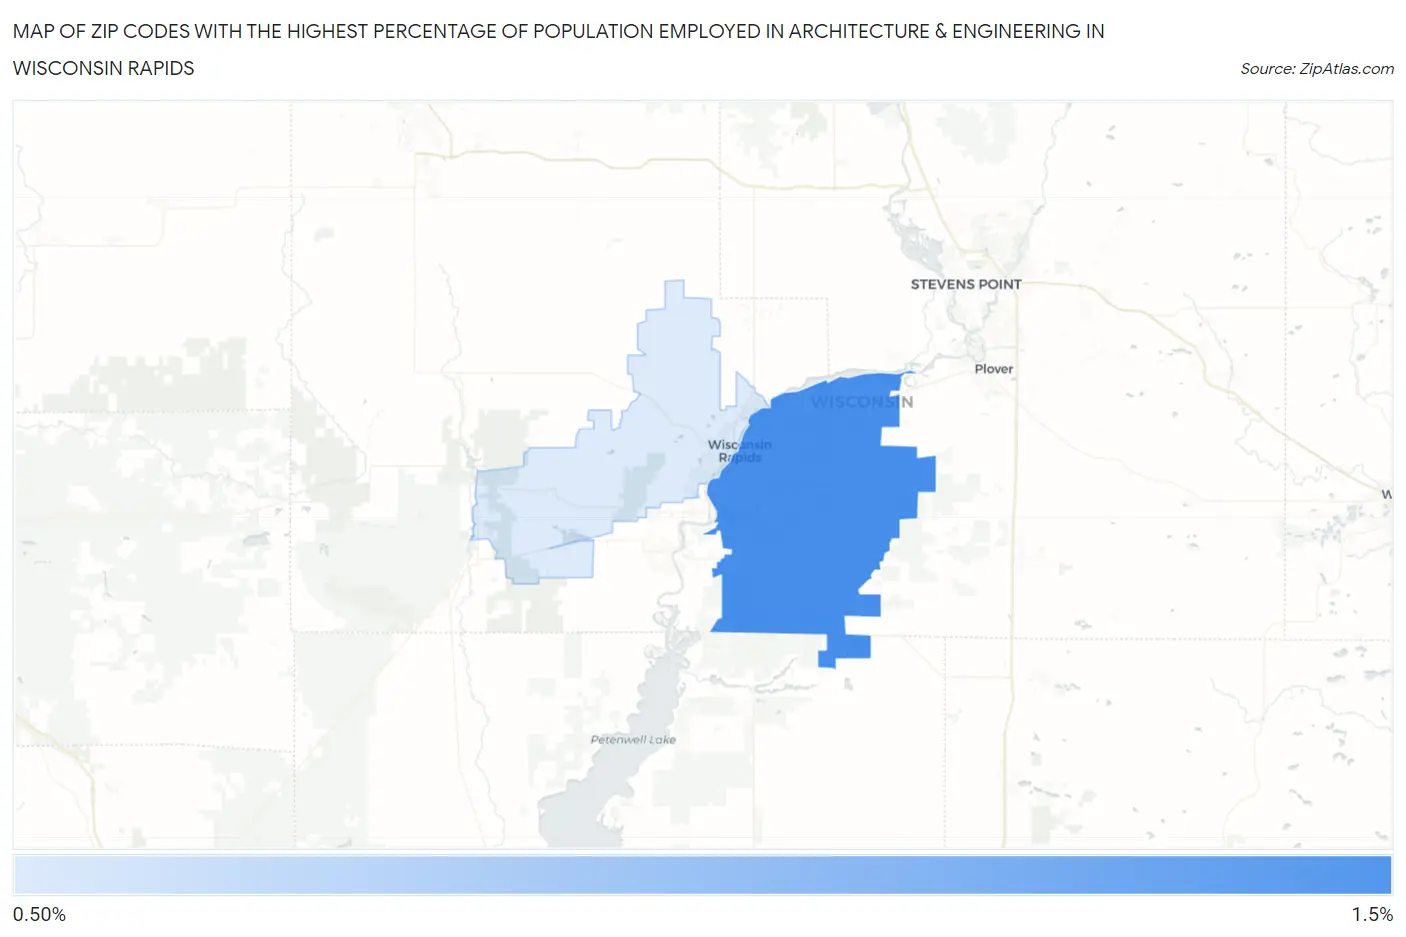
Map of Zip Codes with the Highest Percentage of Population Employed in Architecture & Engineering in Wisconsin Rapids
1.0%
1.4%
Zip Codes with the Highest Percentage of Population Employed in Architecture & Engineering in Wisconsin Rapids, WI
| Zip Code | % Employed | vs State | vs National | |
| 1. | 54494 | 1.4% | 2.2%(-0.888)#430 | 2.1%(-0.794)#13,917 |
| 2. | 54495 | 1.0% | 2.2%(-1.22)#517 | 2.1%(-1.13)#16,452 |
1
Common Questions
What are the Top Zip Codes with the Highest Percentage of Population Employed in Architecture & Engineering in Wisconsin Rapids, WI?
Top Zip Codes with the Highest Percentage of Population Employed in Architecture & Engineering in Wisconsin Rapids, WI are:
What zip code has the Highest Percentage of Population Employed in Architecture & Engineering in Wisconsin Rapids, WI?
54494 has the Highest Percentage of Population Employed in Architecture & Engineering in Wisconsin Rapids, WI with 1.4%.
What is the Percentage of Population Employed in Architecture & Engineering in Wisconsin Rapids, WI?
Percentage of Population Employed in Architecture & Engineering in Wisconsin Rapids is 1.3%.
What is the Percentage of Population Employed in Architecture & Engineering in Wisconsin?
Percentage of Population Employed in Architecture & Engineering in Wisconsin is 2.2%.
What is the Percentage of Population Employed in Architecture & Engineering in the United States?
Percentage of Population Employed in Architecture & Engineering in the United States is 2.1%.