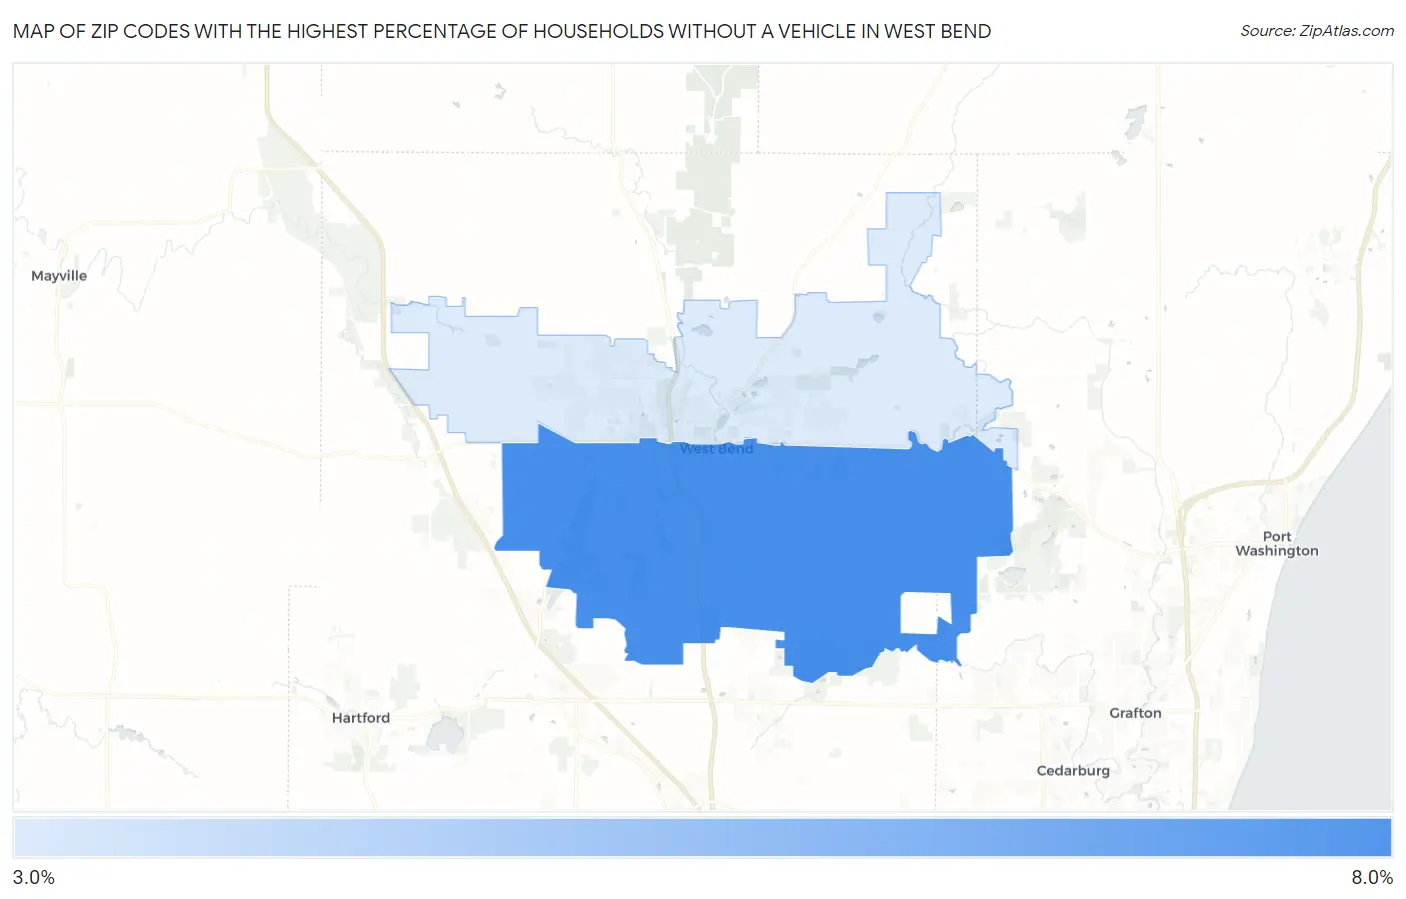
Zip Codes with the Highest Percentage of Households Without a Vehicle in West Bend, WI
RELATED REPORTS & OPTIONS
Households without a Cars
West Bend
Compare Zip Codes
Map of Zip Codes with the Highest Percentage of Households Without a Vehicle in West Bend
3.4%
6.2%
Zip Codes with the Highest Percentage of Households Without a Vehicle in West Bend, WI
| Zip Code | Housholds Without a Car | vs State | vs National | |
| 1. | 53095 | 6.2% | 6.3%(-0.100)#151 | 8.3%(-2.10)#10,006 |
| 2. | 53090 | 3.4% | 6.3%(-2.90)#372 | 8.3%(-4.90)#17,654 |
1
Common Questions
What are the Top Zip Codes with the Highest Percentage of Households Without a Vehicle in West Bend, WI?
Top Zip Codes with the Highest Percentage of Households Without a Vehicle in West Bend, WI are:
What zip code has the Highest Percentage of Households Without a Vehicle in West Bend, WI?
53095 has the Highest Percentage of Households Without a Vehicle in West Bend, WI with 6.2%.
What is the Percentage of Households Without a Vehicle in West Bend, WI?
Percentage of Households Without a Vehicle in West Bend is 5.8%.
What is the Percentage of Households Without a Vehicle in Wisconsin?
Percentage of Households Without a Vehicle in Wisconsin is 6.3%.
What is the Percentage of Households Without a Vehicle in the United States?
Percentage of Households Without a Vehicle in the United States is 8.3%.