Venezuelan vs Immigrants from Switzerland 3 or more Vehicles in Household
COMPARE
Venezuelan
Immigrants from Switzerland
3 or more Vehicles in Household
3 or more Vehicles in Household Comparison
Venezuelans
Immigrants from Switzerland
18.0%
3 OR MORE VEHICLES IN HOUSEHOLD
1.7/ 100
METRIC RATING
250th/ 347
METRIC RANK
18.4%
3 OR MORE VEHICLES IN HOUSEHOLD
5.0/ 100
METRIC RATING
229th/ 347
METRIC RANK
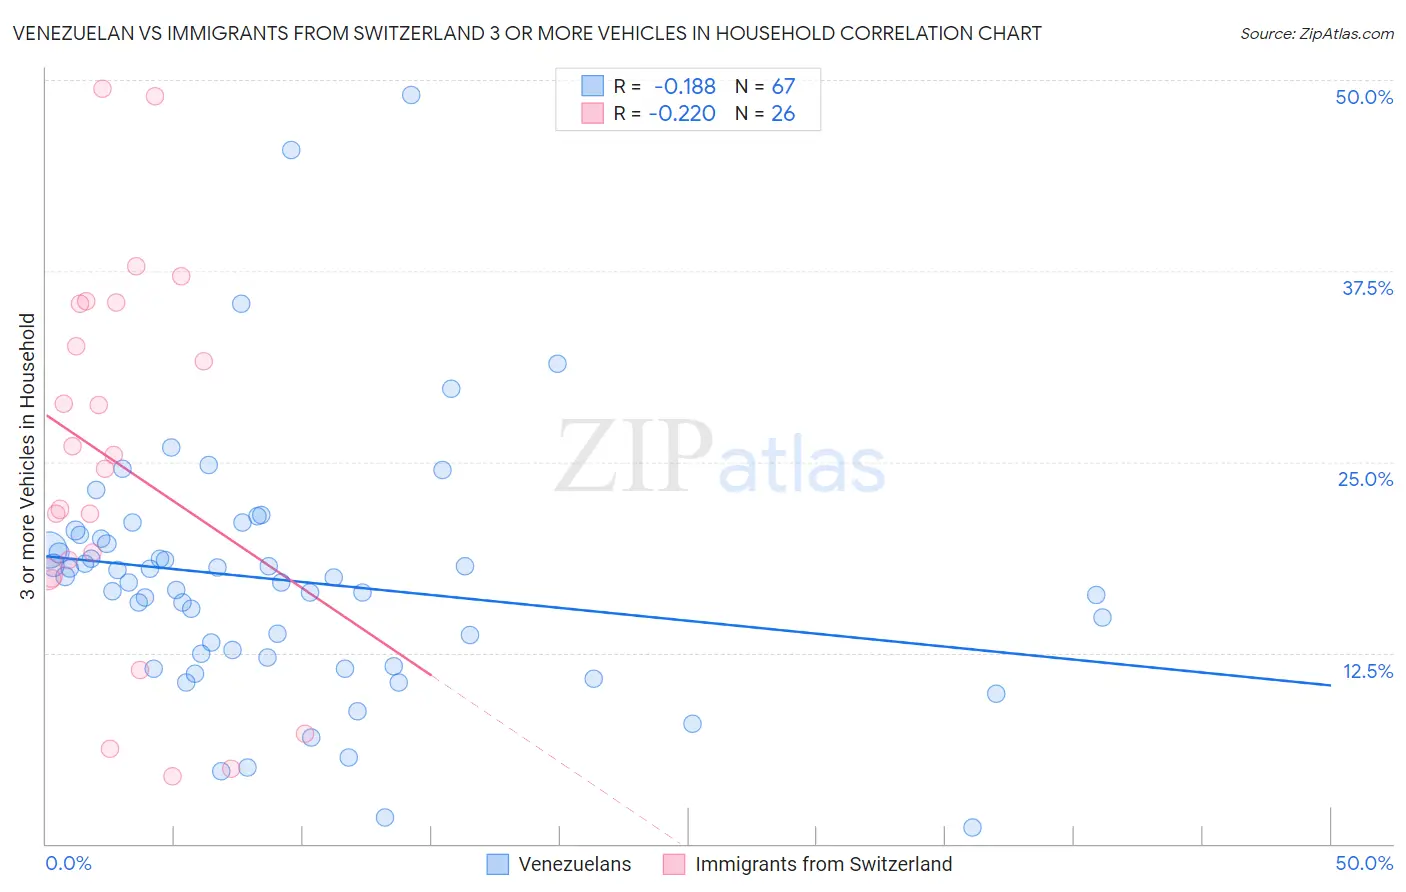
Venezuelan vs Immigrants from Switzerland 3 or more Vehicles in Household Correlation Chart
The statistical analysis conducted on geographies consisting of 306,053,229 people shows a poor negative correlation between the proportion of Venezuelans and percentage of households with 3 or more vehicles available in the United States with a correlation coefficient (R) of -0.188 and weighted average of 18.0%. Similarly, the statistical analysis conducted on geographies consisting of 148,020,738 people shows a weak negative correlation between the proportion of Immigrants from Switzerland and percentage of households with 3 or more vehicles available in the United States with a correlation coefficient (R) of -0.220 and weighted average of 18.4%, a difference of 2.3%.
3 or more Vehicles in Household Correlation Summary
| Measurement | Venezuelan | Immigrants from Switzerland |
| Minimum | 1.1% | 4.4% |
| Maximum | 49.0% | 49.4% |
| Range | 47.9% | 45.1% |
| Mean | 17.2% | 25.0% |
| Median | 17.1% | 25.0% |
| Interquartile 25% (IQ1) | 12.2% | 17.6% |
| Interquartile 75% (IQ3) | 20.0% | 35.3% |
| Interquartile Range (IQR) | 7.8% | 17.7% |
| Standard Deviation (Sample) | 8.3% | 12.4% |
| Standard Deviation (Population) | 8.2% | 12.2% |
Similar Demographics by 3 or more Vehicles in Household
Demographics Similar to Venezuelans by 3 or more Vehicles in Household
In terms of 3 or more vehicles in household, the demographic groups most similar to Venezuelans are Immigrants from Saudi Arabia (18.0%, a difference of 0.020%), Immigrants from Eastern Africa (18.0%, a difference of 0.080%), Alsatian (18.0%, a difference of 0.20%), Carpatho Rusyn (18.0%, a difference of 0.21%), and Immigrants from Australia (18.1%, a difference of 0.37%).
| Demographics | Rating | Rank | 3 or more Vehicles in Household |
| Immigrants | Europe | 2.4 /100 | #243 | Tragic 18.1% |
| Mongolians | 2.3 /100 | #244 | Tragic 18.1% |
| Immigrants | Belize | 2.1 /100 | #245 | Tragic 18.1% |
| Immigrants | Australia | 2.0 /100 | #246 | Tragic 18.1% |
| Carpatho Rusyns | 1.9 /100 | #247 | Tragic 18.0% |
| Immigrants | Eastern Africa | 1.8 /100 | #248 | Tragic 18.0% |
| Immigrants | Saudi Arabia | 1.7 /100 | #249 | Tragic 18.0% |
| Venezuelans | 1.7 /100 | #250 | Tragic 18.0% |
| Alsatians | 1.5 /100 | #251 | Tragic 18.0% |
| Immigrants | Southern Europe | 1.4 /100 | #252 | Tragic 17.9% |
| Immigrants | Ethiopia | 1.3 /100 | #253 | Tragic 17.9% |
| Ethiopians | 1.2 /100 | #254 | Tragic 17.9% |
| Immigrants | Turkey | 1.2 /100 | #255 | Tragic 17.9% |
| Sub-Saharan Africans | 1.1 /100 | #256 | Tragic 17.9% |
| Immigrants | Eritrea | 1.1 /100 | #257 | Tragic 17.8% |
Demographics Similar to Immigrants from Switzerland by 3 or more Vehicles in Household
In terms of 3 or more vehicles in household, the demographic groups most similar to Immigrants from Switzerland are Immigrants from Western Asia (18.4%, a difference of 0.060%), Immigrants from Belgium (18.4%, a difference of 0.080%), Immigrants from Uganda (18.4%, a difference of 0.14%), Honduran (18.4%, a difference of 0.16%), and Turkish (18.4%, a difference of 0.17%).
| Demographics | Rating | Rank | 3 or more Vehicles in Household |
| Belizeans | 7.3 /100 | #222 | Tragic 18.6% |
| Immigrants | Czechoslovakia | 5.9 /100 | #223 | Tragic 18.5% |
| Immigrants | Argentina | 5.6 /100 | #224 | Tragic 18.5% |
| Immigrants | Lithuania | 5.6 /100 | #225 | Tragic 18.5% |
| Immigrants | Hungary | 5.5 /100 | #226 | Tragic 18.5% |
| Immigrants | Singapore | 5.4 /100 | #227 | Tragic 18.4% |
| Turks | 5.4 /100 | #228 | Tragic 18.4% |
| Immigrants | Switzerland | 5.0 /100 | #229 | Tragic 18.4% |
| Immigrants | Western Asia | 4.8 /100 | #230 | Tragic 18.4% |
| Immigrants | Belgium | 4.8 /100 | #231 | Tragic 18.4% |
| Immigrants | Uganda | 4.6 /100 | #232 | Tragic 18.4% |
| Hondurans | 4.6 /100 | #233 | Tragic 18.4% |
| Immigrants | North Macedonia | 4.4 /100 | #234 | Tragic 18.4% |
| Sierra Leoneans | 3.9 /100 | #235 | Tragic 18.3% |
| Immigrants | Malaysia | 3.6 /100 | #236 | Tragic 18.3% |