Malaysian vs Immigrants from Switzerland 3 or more Vehicles in Household
COMPARE
Malaysian
Immigrants from Switzerland
3 or more Vehicles in Household
3 or more Vehicles in Household Comparison
Malaysians
Immigrants from Switzerland
22.6%
3 OR MORE VEHICLES IN HOUSEHOLD
100.0/ 100
METRIC RATING
47th/ 347
METRIC RANK
18.4%
3 OR MORE VEHICLES IN HOUSEHOLD
5.0/ 100
METRIC RATING
229th/ 347
METRIC RANK
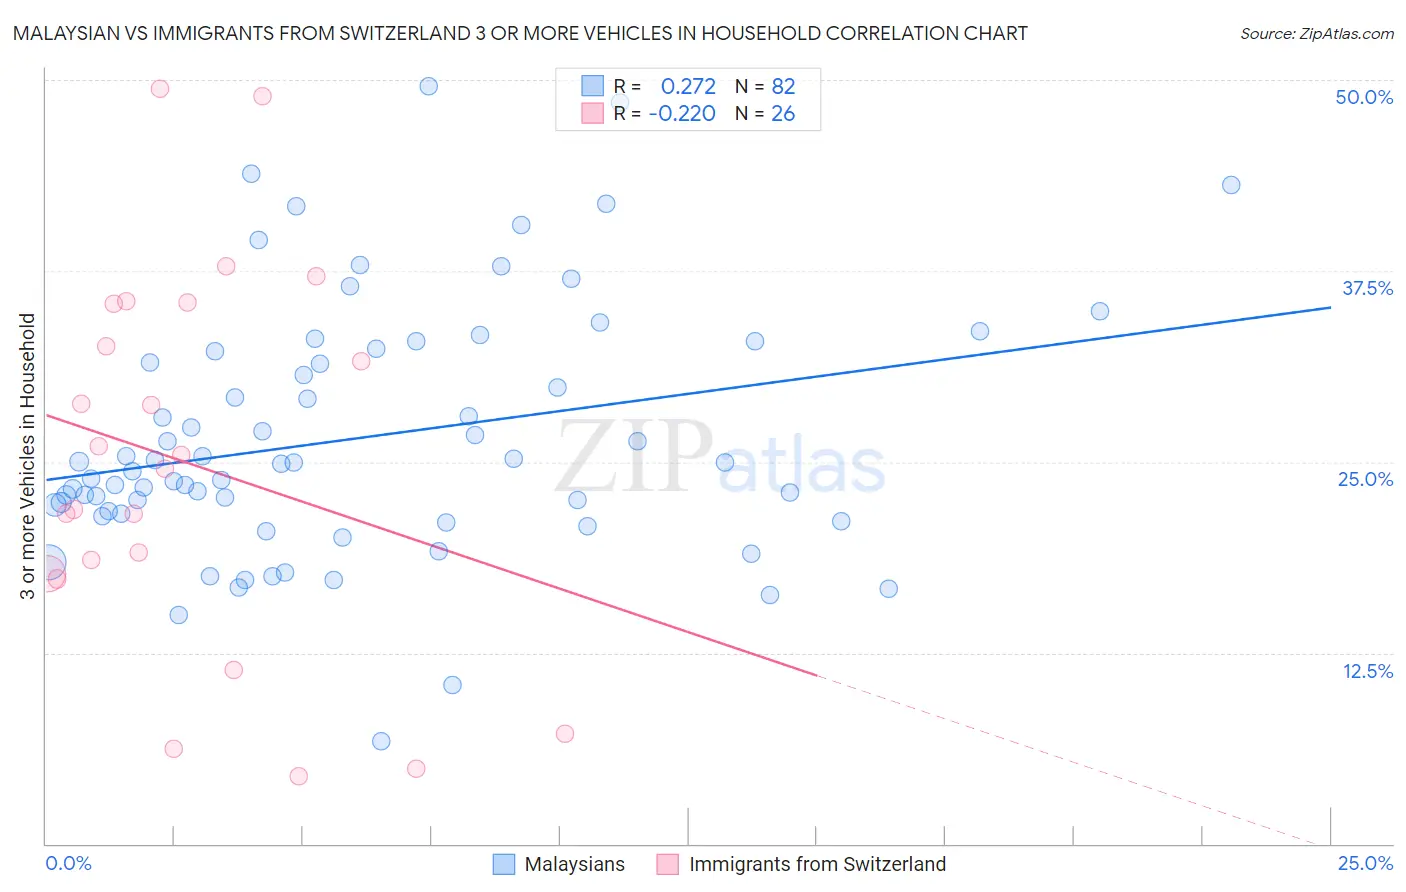
Malaysian vs Immigrants from Switzerland 3 or more Vehicles in Household Correlation Chart
The statistical analysis conducted on geographies consisting of 225,967,972 people shows a weak positive correlation between the proportion of Malaysians and percentage of households with 3 or more vehicles available in the United States with a correlation coefficient (R) of 0.272 and weighted average of 22.6%. Similarly, the statistical analysis conducted on geographies consisting of 148,020,738 people shows a weak negative correlation between the proportion of Immigrants from Switzerland and percentage of households with 3 or more vehicles available in the United States with a correlation coefficient (R) of -0.220 and weighted average of 18.4%, a difference of 22.9%.
3 or more Vehicles in Household Correlation Summary
| Measurement | Malaysian | Immigrants from Switzerland |
| Minimum | 6.8% | 4.4% |
| Maximum | 49.6% | 49.4% |
| Range | 42.9% | 45.1% |
| Mean | 26.6% | 25.0% |
| Median | 24.9% | 25.0% |
| Interquartile 25% (IQ1) | 21.6% | 17.6% |
| Interquartile 75% (IQ3) | 32.2% | 35.3% |
| Interquartile Range (IQR) | 10.7% | 17.7% |
| Standard Deviation (Sample) | 8.3% | 12.4% |
| Standard Deviation (Population) | 8.2% | 12.2% |
Similar Demographics by 3 or more Vehicles in Household
Demographics Similar to Malaysians by 3 or more Vehicles in Household
In terms of 3 or more vehicles in household, the demographic groups most similar to Malaysians are American (22.6%, a difference of 0.010%), Scottish (22.6%, a difference of 0.010%), Scotch-Irish (22.6%, a difference of 0.11%), Sioux (22.6%, a difference of 0.17%), and White/Caucasian (22.6%, a difference of 0.18%).
| Demographics | Rating | Rank | 3 or more Vehicles in Household |
| Europeans | 100.0 /100 | #40 | Exceptional 22.9% |
| Germans | 100.0 /100 | #41 | Exceptional 22.7% |
| Natives/Alaskans | 100.0 /100 | #42 | Exceptional 22.7% |
| Osage | 100.0 /100 | #43 | Exceptional 22.7% |
| Cheyenne | 100.0 /100 | #44 | Exceptional 22.7% |
| Ute | 100.0 /100 | #45 | Exceptional 22.7% |
| Americans | 100.0 /100 | #46 | Exceptional 22.6% |
| Malaysians | 100.0 /100 | #47 | Exceptional 22.6% |
| Scottish | 100.0 /100 | #48 | Exceptional 22.6% |
| Scotch-Irish | 100.0 /100 | #49 | Exceptional 22.6% |
| Sioux | 100.0 /100 | #50 | Exceptional 22.6% |
| Whites/Caucasians | 100.0 /100 | #51 | Exceptional 22.6% |
| Welsh | 100.0 /100 | #52 | Exceptional 22.6% |
| Czechs | 100.0 /100 | #53 | Exceptional 22.5% |
| Crow | 100.0 /100 | #54 | Exceptional 22.5% |
Demographics Similar to Immigrants from Switzerland by 3 or more Vehicles in Household
In terms of 3 or more vehicles in household, the demographic groups most similar to Immigrants from Switzerland are Immigrants from Western Asia (18.4%, a difference of 0.060%), Immigrants from Belgium (18.4%, a difference of 0.080%), Immigrants from Uganda (18.4%, a difference of 0.14%), Honduran (18.4%, a difference of 0.16%), and Turkish (18.4%, a difference of 0.17%).
| Demographics | Rating | Rank | 3 or more Vehicles in Household |
| Belizeans | 7.3 /100 | #222 | Tragic 18.6% |
| Immigrants | Czechoslovakia | 5.9 /100 | #223 | Tragic 18.5% |
| Immigrants | Argentina | 5.6 /100 | #224 | Tragic 18.5% |
| Immigrants | Lithuania | 5.6 /100 | #225 | Tragic 18.5% |
| Immigrants | Hungary | 5.5 /100 | #226 | Tragic 18.5% |
| Immigrants | Singapore | 5.4 /100 | #227 | Tragic 18.4% |
| Turks | 5.4 /100 | #228 | Tragic 18.4% |
| Immigrants | Switzerland | 5.0 /100 | #229 | Tragic 18.4% |
| Immigrants | Western Asia | 4.8 /100 | #230 | Tragic 18.4% |
| Immigrants | Belgium | 4.8 /100 | #231 | Tragic 18.4% |
| Immigrants | Uganda | 4.6 /100 | #232 | Tragic 18.4% |
| Hondurans | 4.6 /100 | #233 | Tragic 18.4% |
| Immigrants | North Macedonia | 4.4 /100 | #234 | Tragic 18.4% |
| Sierra Leoneans | 3.9 /100 | #235 | Tragic 18.3% |
| Immigrants | Malaysia | 3.6 /100 | #236 | Tragic 18.3% |