Venezuelan vs Icelander 3 or more Vehicles in Household
COMPARE
Venezuelan
Icelander
3 or more Vehicles in Household
3 or more Vehicles in Household Comparison
Venezuelans
Icelanders
18.0%
3 OR MORE VEHICLES IN HOUSEHOLD
1.7/ 100
METRIC RATING
250th/ 347
METRIC RANK
21.5%
3 OR MORE VEHICLES IN HOUSEHOLD
99.6/ 100
METRIC RATING
84th/ 347
METRIC RANK
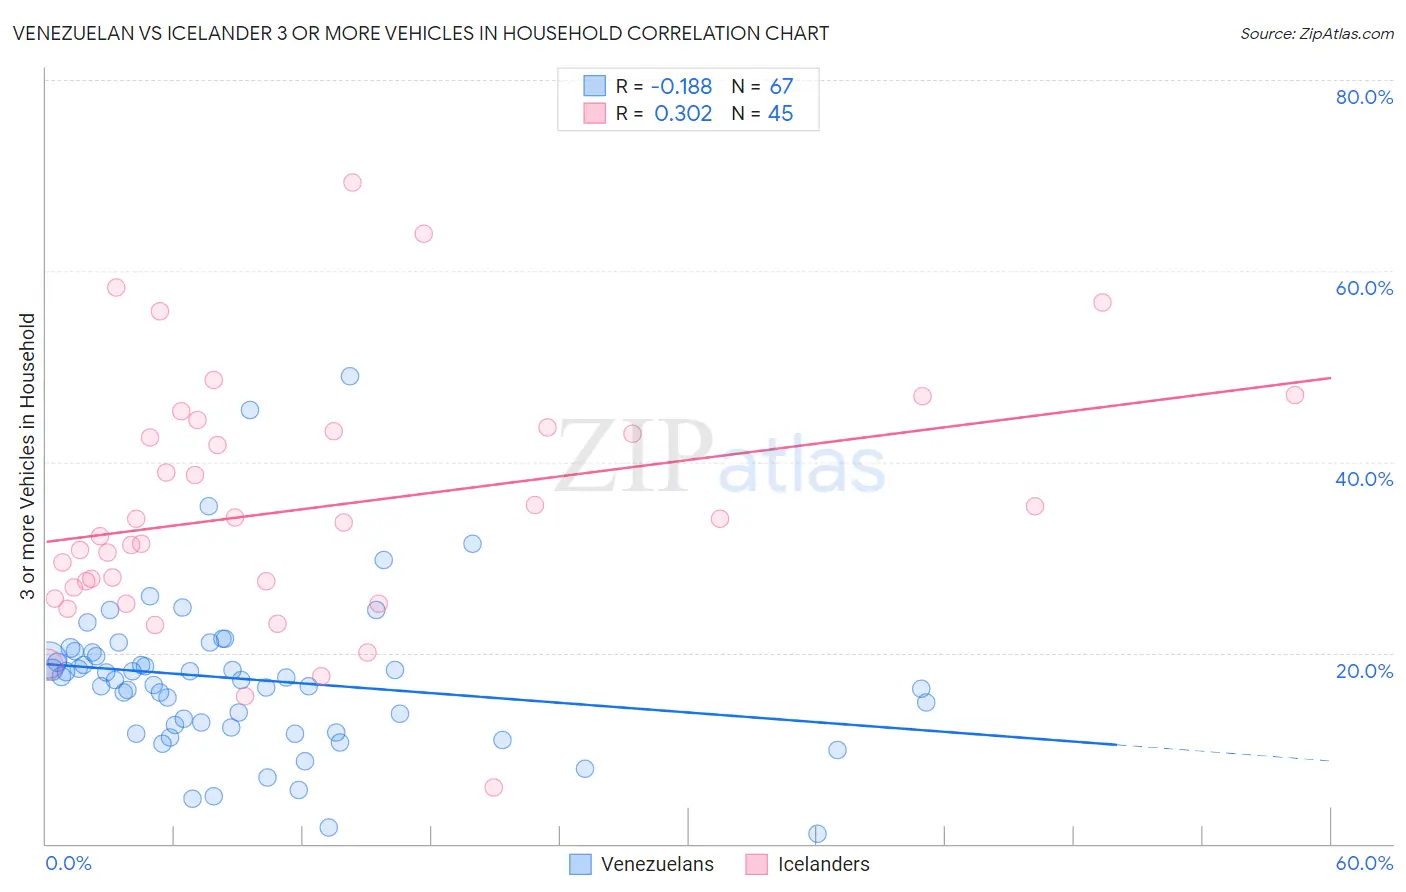
Venezuelan vs Icelander 3 or more Vehicles in Household Correlation Chart
The statistical analysis conducted on geographies consisting of 306,053,229 people shows a poor negative correlation between the proportion of Venezuelans and percentage of households with 3 or more vehicles available in the United States with a correlation coefficient (R) of -0.188 and weighted average of 18.0%. Similarly, the statistical analysis conducted on geographies consisting of 159,607,768 people shows a mild positive correlation between the proportion of Icelanders and percentage of households with 3 or more vehicles available in the United States with a correlation coefficient (R) of 0.302 and weighted average of 21.5%, a difference of 19.5%.
3 or more Vehicles in Household Correlation Summary
| Measurement | Venezuelan | Icelander |
| Minimum | 1.1% | 5.9% |
| Maximum | 49.0% | 69.2% |
| Range | 47.9% | 63.3% |
| Mean | 17.2% | 35.2% |
| Median | 17.1% | 33.7% |
| Interquartile 25% (IQ1) | 12.2% | 26.2% |
| Interquartile 75% (IQ3) | 20.0% | 43.5% |
| Interquartile Range (IQR) | 7.8% | 17.2% |
| Standard Deviation (Sample) | 8.3% | 13.1% |
| Standard Deviation (Population) | 8.2% | 12.9% |
Similar Demographics by 3 or more Vehicles in Household
Demographics Similar to Venezuelans by 3 or more Vehicles in Household
In terms of 3 or more vehicles in household, the demographic groups most similar to Venezuelans are Immigrants from Saudi Arabia (18.0%, a difference of 0.020%), Immigrants from Eastern Africa (18.0%, a difference of 0.080%), Alsatian (18.0%, a difference of 0.20%), Carpatho Rusyn (18.0%, a difference of 0.21%), and Immigrants from Australia (18.1%, a difference of 0.37%).
| Demographics | Rating | Rank | 3 or more Vehicles in Household |
| Immigrants | Europe | 2.4 /100 | #243 | Tragic 18.1% |
| Mongolians | 2.3 /100 | #244 | Tragic 18.1% |
| Immigrants | Belize | 2.1 /100 | #245 | Tragic 18.1% |
| Immigrants | Australia | 2.0 /100 | #246 | Tragic 18.1% |
| Carpatho Rusyns | 1.9 /100 | #247 | Tragic 18.0% |
| Immigrants | Eastern Africa | 1.8 /100 | #248 | Tragic 18.0% |
| Immigrants | Saudi Arabia | 1.7 /100 | #249 | Tragic 18.0% |
| Venezuelans | 1.7 /100 | #250 | Tragic 18.0% |
| Alsatians | 1.5 /100 | #251 | Tragic 18.0% |
| Immigrants | Southern Europe | 1.4 /100 | #252 | Tragic 17.9% |
| Immigrants | Ethiopia | 1.3 /100 | #253 | Tragic 17.9% |
| Ethiopians | 1.2 /100 | #254 | Tragic 17.9% |
| Immigrants | Turkey | 1.2 /100 | #255 | Tragic 17.9% |
| Sub-Saharan Africans | 1.1 /100 | #256 | Tragic 17.9% |
| Immigrants | Eritrea | 1.1 /100 | #257 | Tragic 17.8% |
Demographics Similar to Icelanders by 3 or more Vehicles in Household
In terms of 3 or more vehicles in household, the demographic groups most similar to Icelanders are Laotian (21.5%, a difference of 0.010%), Chippewa (21.5%, a difference of 0.050%), Immigrants from El Salvador (21.5%, a difference of 0.080%), Delaware (21.5%, a difference of 0.090%), and Immigrants from the Azores (21.5%, a difference of 0.21%).
| Demographics | Rating | Rank | 3 or more Vehicles in Household |
| Irish | 99.8 /100 | #77 | Exceptional 21.8% |
| Czechoslovakians | 99.8 /100 | #78 | Exceptional 21.7% |
| Assyrians/Chaldeans/Syriacs | 99.8 /100 | #79 | Exceptional 21.7% |
| Afghans | 99.7 /100 | #80 | Exceptional 21.7% |
| Celtics | 99.7 /100 | #81 | Exceptional 21.7% |
| Immigrants | El Salvador | 99.6 /100 | #82 | Exceptional 21.5% |
| Chippewa | 99.6 /100 | #83 | Exceptional 21.5% |
| Icelanders | 99.6 /100 | #84 | Exceptional 21.5% |
| Laotians | 99.6 /100 | #85 | Exceptional 21.5% |
| Delaware | 99.6 /100 | #86 | Exceptional 21.5% |
| Immigrants | Azores | 99.5 /100 | #87 | Exceptional 21.5% |
| French | 99.4 /100 | #88 | Exceptional 21.4% |
| Marshallese | 99.2 /100 | #89 | Exceptional 21.3% |
| Immigrants | Afghanistan | 99.1 /100 | #90 | Exceptional 21.2% |
| Belgians | 98.9 /100 | #91 | Exceptional 21.2% |