Venezuelan vs Somali 3 or more Vehicles in Household
COMPARE
Venezuelan
Somali
3 or more Vehicles in Household
3 or more Vehicles in Household Comparison
Venezuelans
Somalis
18.0%
3 OR MORE VEHICLES IN HOUSEHOLD
1.7/ 100
METRIC RATING
250th/ 347
METRIC RANK
16.2%
3 OR MORE VEHICLES IN HOUSEHOLD
0.0/ 100
METRIC RATING
306th/ 347
METRIC RANK
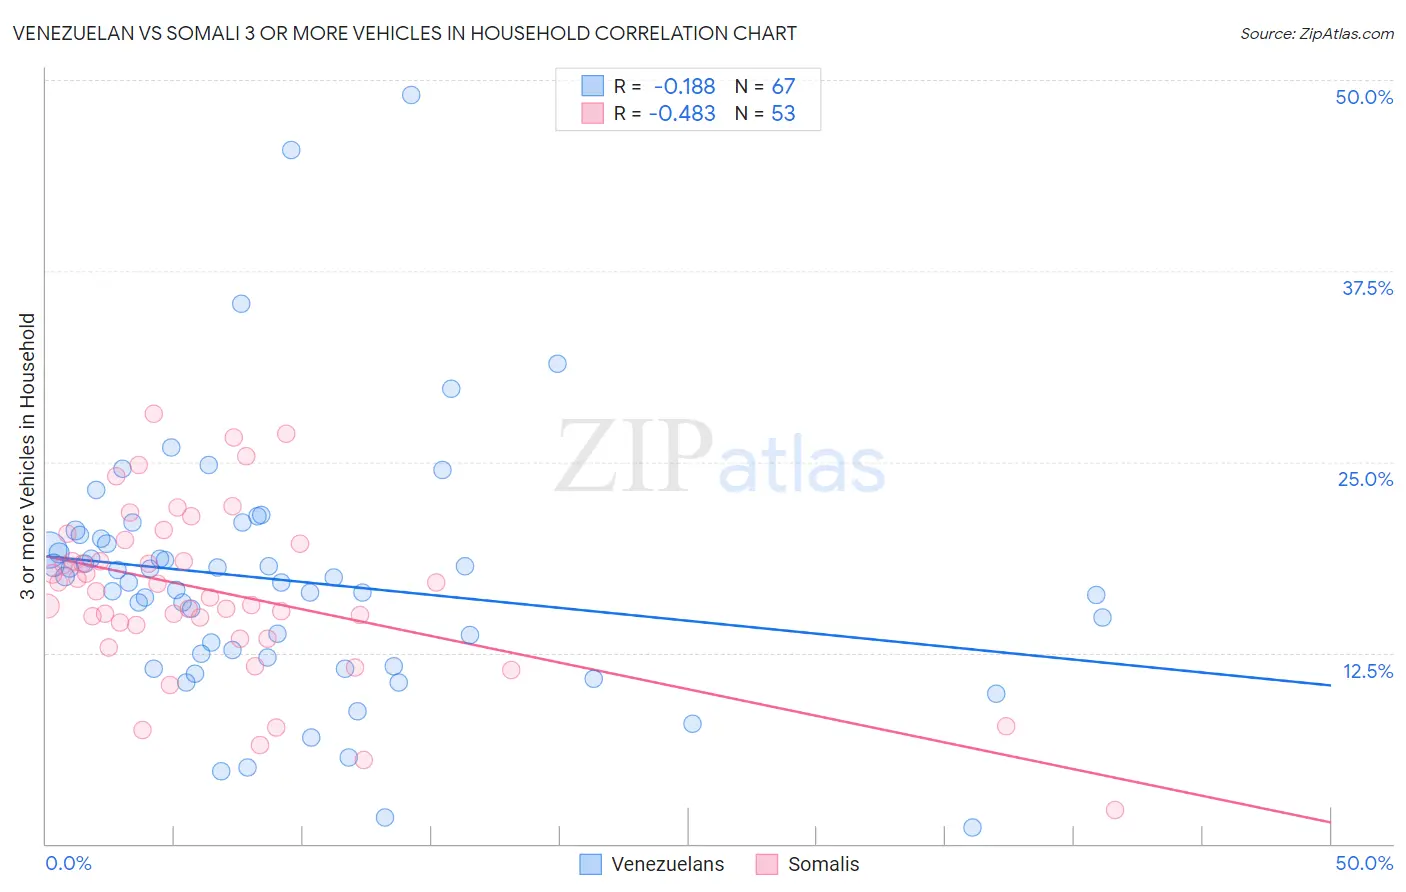
Venezuelan vs Somali 3 or more Vehicles in Household Correlation Chart
The statistical analysis conducted on geographies consisting of 306,053,229 people shows a poor negative correlation between the proportion of Venezuelans and percentage of households with 3 or more vehicles available in the United States with a correlation coefficient (R) of -0.188 and weighted average of 18.0%. Similarly, the statistical analysis conducted on geographies consisting of 99,282,686 people shows a moderate negative correlation between the proportion of Somalis and percentage of households with 3 or more vehicles available in the United States with a correlation coefficient (R) of -0.483 and weighted average of 16.2%, a difference of 11.3%.
3 or more Vehicles in Household Correlation Summary
| Measurement | Venezuelan | Somali |
| Minimum | 1.1% | 2.2% |
| Maximum | 49.0% | 28.2% |
| Range | 47.9% | 26.0% |
| Mean | 17.2% | 16.5% |
| Median | 17.1% | 16.5% |
| Interquartile 25% (IQ1) | 12.2% | 13.9% |
| Interquartile 75% (IQ3) | 20.0% | 19.8% |
| Interquartile Range (IQR) | 7.8% | 5.9% |
| Standard Deviation (Sample) | 8.3% | 5.5% |
| Standard Deviation (Population) | 8.2% | 5.5% |
Similar Demographics by 3 or more Vehicles in Household
Demographics Similar to Venezuelans by 3 or more Vehicles in Household
In terms of 3 or more vehicles in household, the demographic groups most similar to Venezuelans are Immigrants from Saudi Arabia (18.0%, a difference of 0.020%), Immigrants from Eastern Africa (18.0%, a difference of 0.080%), Alsatian (18.0%, a difference of 0.20%), Carpatho Rusyn (18.0%, a difference of 0.21%), and Immigrants from Australia (18.1%, a difference of 0.37%).
| Demographics | Rating | Rank | 3 or more Vehicles in Household |
| Immigrants | Europe | 2.4 /100 | #243 | Tragic 18.1% |
| Mongolians | 2.3 /100 | #244 | Tragic 18.1% |
| Immigrants | Belize | 2.1 /100 | #245 | Tragic 18.1% |
| Immigrants | Australia | 2.0 /100 | #246 | Tragic 18.1% |
| Carpatho Rusyns | 1.9 /100 | #247 | Tragic 18.0% |
| Immigrants | Eastern Africa | 1.8 /100 | #248 | Tragic 18.0% |
| Immigrants | Saudi Arabia | 1.7 /100 | #249 | Tragic 18.0% |
| Venezuelans | 1.7 /100 | #250 | Tragic 18.0% |
| Alsatians | 1.5 /100 | #251 | Tragic 18.0% |
| Immigrants | Southern Europe | 1.4 /100 | #252 | Tragic 17.9% |
| Immigrants | Ethiopia | 1.3 /100 | #253 | Tragic 17.9% |
| Ethiopians | 1.2 /100 | #254 | Tragic 17.9% |
| Immigrants | Turkey | 1.2 /100 | #255 | Tragic 17.9% |
| Sub-Saharan Africans | 1.1 /100 | #256 | Tragic 17.9% |
| Immigrants | Eritrea | 1.1 /100 | #257 | Tragic 17.8% |
Demographics Similar to Somalis by 3 or more Vehicles in Household
In terms of 3 or more vehicles in household, the demographic groups most similar to Somalis are Immigrants from Ghana (16.2%, a difference of 0.15%), Houma (16.1%, a difference of 0.74%), Immigrants from Morocco (16.3%, a difference of 0.82%), Ghanaian (16.4%, a difference of 1.1%), and Immigrants from Serbia (16.4%, a difference of 1.6%).
| Demographics | Rating | Rank | 3 or more Vehicles in Household |
| Immigrants | South America | 0.1 /100 | #299 | Tragic 16.7% |
| Cypriots | 0.0 /100 | #300 | Tragic 16.6% |
| Paraguayans | 0.0 /100 | #301 | Tragic 16.6% |
| Immigrants | Greece | 0.0 /100 | #302 | Tragic 16.5% |
| Immigrants | Serbia | 0.0 /100 | #303 | Tragic 16.4% |
| Ghanaians | 0.0 /100 | #304 | Tragic 16.4% |
| Immigrants | Morocco | 0.0 /100 | #305 | Tragic 16.3% |
| Somalis | 0.0 /100 | #306 | Tragic 16.2% |
| Immigrants | Ghana | 0.0 /100 | #307 | Tragic 16.2% |
| Houma | 0.0 /100 | #308 | Tragic 16.1% |
| Immigrants | Somalia | 0.0 /100 | #309 | Tragic 15.9% |
| Moroccans | 0.0 /100 | #310 | Tragic 15.9% |
| Albanians | 0.0 /100 | #311 | Tragic 15.8% |
| Puerto Ricans | 0.0 /100 | #312 | Tragic 15.6% |
| Immigrants | Israel | 0.0 /100 | #313 | Tragic 15.6% |