Belgian vs Trinidadian and Tobagonian 2 or more Vehicles in Household
COMPARE
Belgian
Trinidadian and Tobagonian
2 or more Vehicles in Household
2 or more Vehicles in Household Comparison
Belgians
Trinidadians and Tobagonians
59.3%
2 OR MORE VEHICLES IN HOUSEHOLD
99.9/ 100
METRIC RATING
49th/ 347
METRIC RANK
40.9%
2 OR MORE VEHICLES IN HOUSEHOLD
0.0/ 100
METRIC RATING
332nd/ 347
METRIC RANK
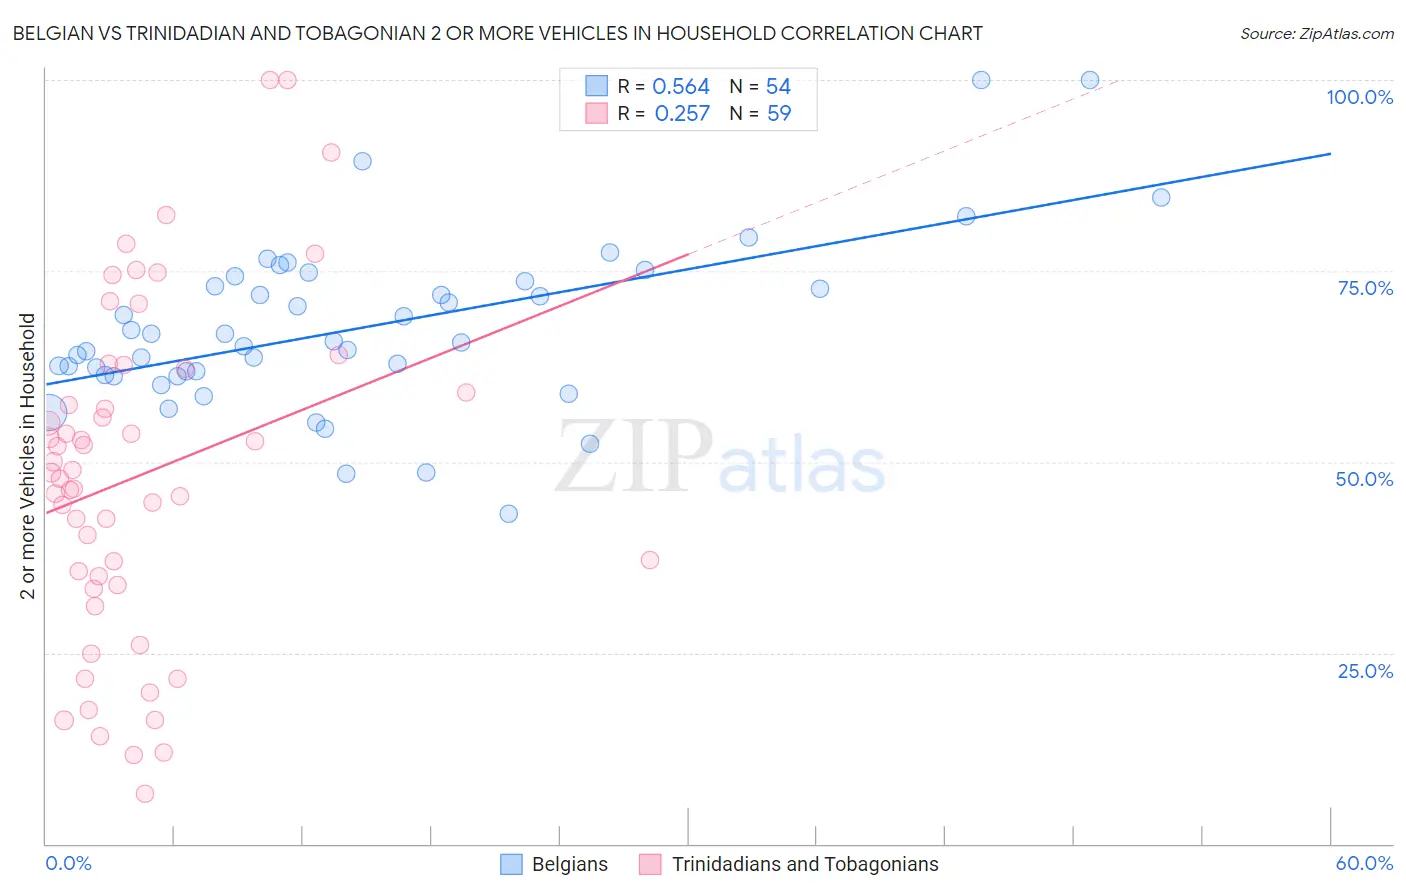
Belgian vs Trinidadian and Tobagonian 2 or more Vehicles in Household Correlation Chart
The statistical analysis conducted on geographies consisting of 355,869,079 people shows a substantial positive correlation between the proportion of Belgians and percentage of households with 2 or more vehicles available in the United States with a correlation coefficient (R) of 0.564 and weighted average of 59.3%. Similarly, the statistical analysis conducted on geographies consisting of 219,730,048 people shows a weak positive correlation between the proportion of Trinidadians and Tobagonians and percentage of households with 2 or more vehicles available in the United States with a correlation coefficient (R) of 0.257 and weighted average of 40.9%, a difference of 45.0%.
2 or more Vehicles in Household Correlation Summary
| Measurement | Belgian | Trinidadian and Tobagonian |
| Minimum | 43.1% | 6.5% |
| Maximum | 100.0% | 100.0% |
| Range | 56.9% | 93.5% |
| Mean | 67.6% | 48.2% |
| Median | 65.7% | 48.5% |
| Interquartile 25% (IQ1) | 61.3% | 33.8% |
| Interquartile 75% (IQ3) | 73.6% | 62.3% |
| Interquartile Range (IQR) | 12.3% | 28.4% |
| Standard Deviation (Sample) | 11.1% | 21.9% |
| Standard Deviation (Population) | 11.0% | 21.8% |
Similar Demographics by 2 or more Vehicles in Household
Demographics Similar to Belgians by 2 or more Vehicles in Household
In terms of 2 or more vehicles in household, the demographic groups most similar to Belgians are Choctaw (59.3%, a difference of 0.010%), Immigrants from India (59.3%, a difference of 0.040%), Yaqui (59.3%, a difference of 0.060%), Spaniard (59.2%, a difference of 0.15%), and Immigrants from Laos (59.2%, a difference of 0.15%).
| Demographics | Rating | Rank | 2 or more Vehicles in Household |
| Malaysians | 100.0 /100 | #42 | Exceptional 59.8% |
| Czechoslovakians | 100.0 /100 | #43 | Exceptional 59.8% |
| French | 100.0 /100 | #44 | Exceptional 59.8% |
| Immigrants | Taiwan | 100.0 /100 | #45 | Exceptional 59.7% |
| Immigrants | South Eastern Asia | 100.0 /100 | #46 | Exceptional 59.6% |
| Yaqui | 99.9 /100 | #47 | Exceptional 59.3% |
| Immigrants | India | 99.9 /100 | #48 | Exceptional 59.3% |
| Belgians | 99.9 /100 | #49 | Exceptional 59.3% |
| Choctaw | 99.9 /100 | #50 | Exceptional 59.3% |
| Spaniards | 99.9 /100 | #51 | Exceptional 59.2% |
| Immigrants | Laos | 99.9 /100 | #52 | Exceptional 59.2% |
| Celtics | 99.9 /100 | #53 | Exceptional 59.2% |
| Bhutanese | 99.9 /100 | #54 | Exceptional 59.1% |
| Luxembourgers | 99.9 /100 | #55 | Exceptional 59.1% |
| Chickasaw | 99.9 /100 | #56 | Exceptional 59.0% |
Demographics Similar to Trinidadians and Tobagonians by 2 or more Vehicles in Household
In terms of 2 or more vehicles in household, the demographic groups most similar to Trinidadians and Tobagonians are Immigrants from Ecuador (40.5%, a difference of 0.92%), West Indian (41.3%, a difference of 0.98%), Immigrants from Trinidad and Tobago (40.3%, a difference of 1.5%), Immigrants from Dominica (41.6%, a difference of 1.8%), and Ecuadorian (42.0%, a difference of 2.7%).
| Demographics | Rating | Rank | 2 or more Vehicles in Household |
| Immigrants | West Indies | 0.0 /100 | #325 | Tragic 43.1% |
| Immigrants | Senegal | 0.0 /100 | #326 | Tragic 43.0% |
| Immigrants | Yemen | 0.0 /100 | #327 | Tragic 42.8% |
| Inupiat | 0.0 /100 | #328 | Tragic 42.6% |
| Ecuadorians | 0.0 /100 | #329 | Tragic 42.0% |
| Immigrants | Dominica | 0.0 /100 | #330 | Tragic 41.6% |
| West Indians | 0.0 /100 | #331 | Tragic 41.3% |
| Trinidadians and Tobagonians | 0.0 /100 | #332 | Tragic 40.9% |
| Immigrants | Ecuador | 0.0 /100 | #333 | Tragic 40.5% |
| Immigrants | Trinidad and Tobago | 0.0 /100 | #334 | Tragic 40.3% |
| Immigrants | Bangladesh | 0.0 /100 | #335 | Tragic 38.8% |
| Vietnamese | 0.0 /100 | #336 | Tragic 38.5% |
| Barbadians | 0.0 /100 | #337 | Tragic 38.3% |
| Immigrants | Uzbekistan | 0.0 /100 | #338 | Tragic 37.9% |
| Immigrants | Barbados | 0.0 /100 | #339 | Tragic 35.8% |