Spanish American Indian vs Trinidadian and Tobagonian 2 or more Vehicles in Household
COMPARE
Spanish American Indian
Trinidadian and Tobagonian
2 or more Vehicles in Household
2 or more Vehicles in Household Comparison
Spanish American Indians
Trinidadians and Tobagonians
60.3%
2 OR MORE VEHICLES IN HOUSEHOLD
100.0/ 100
METRIC RATING
31st/ 347
METRIC RANK
40.9%
2 OR MORE VEHICLES IN HOUSEHOLD
0.0/ 100
METRIC RATING
332nd/ 347
METRIC RANK
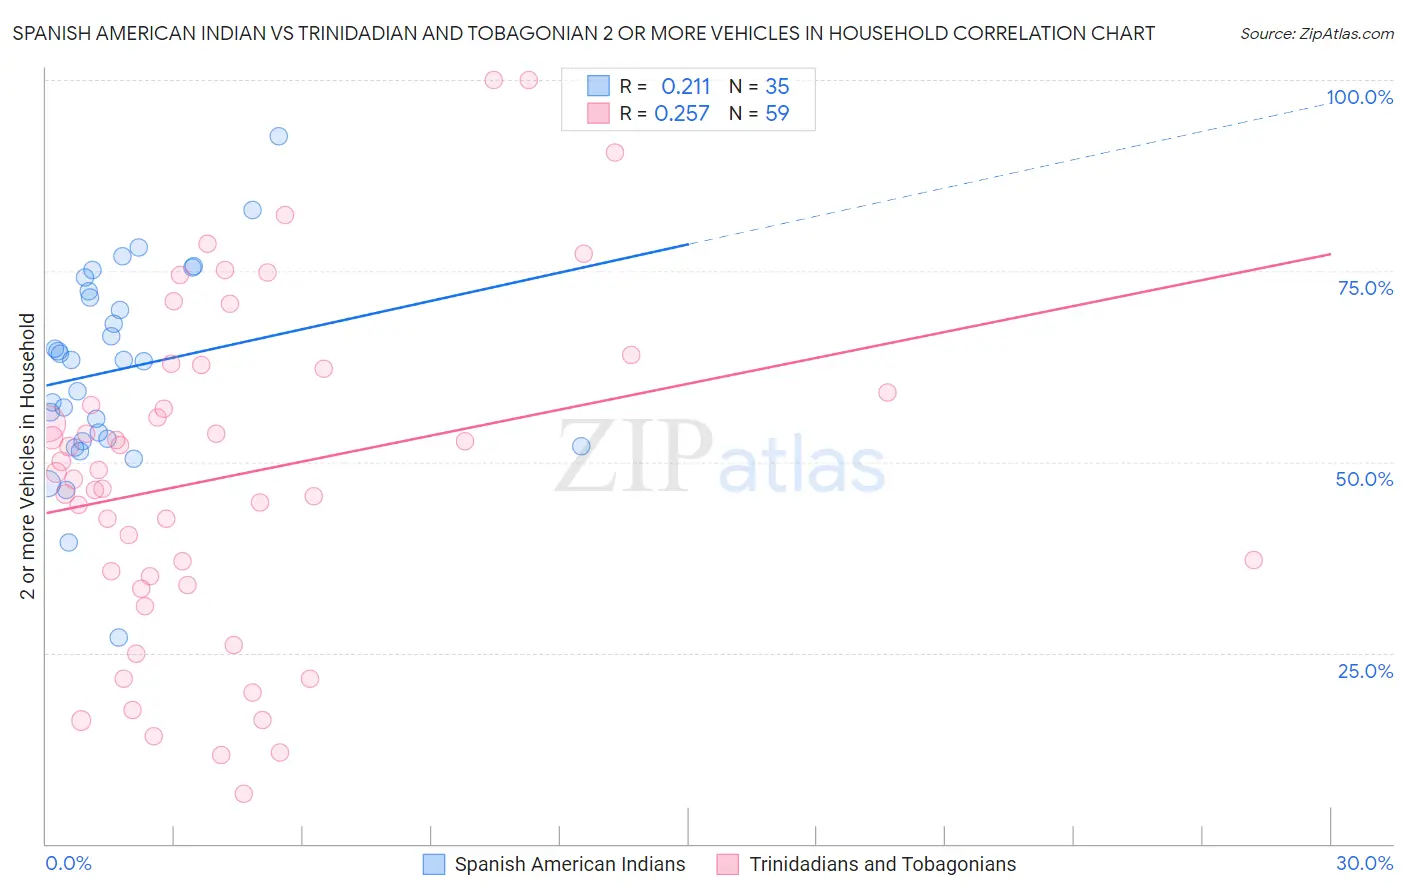
Spanish American Indian vs Trinidadian and Tobagonian 2 or more Vehicles in Household Correlation Chart
The statistical analysis conducted on geographies consisting of 73,145,550 people shows a weak positive correlation between the proportion of Spanish American Indians and percentage of households with 2 or more vehicles available in the United States with a correlation coefficient (R) of 0.211 and weighted average of 60.3%. Similarly, the statistical analysis conducted on geographies consisting of 219,730,048 people shows a weak positive correlation between the proportion of Trinidadians and Tobagonians and percentage of households with 2 or more vehicles available in the United States with a correlation coefficient (R) of 0.257 and weighted average of 40.9%, a difference of 47.5%.
2 or more Vehicles in Household Correlation Summary
| Measurement | Spanish American Indian | Trinidadian and Tobagonian |
| Minimum | 27.0% | 6.5% |
| Maximum | 92.6% | 100.0% |
| Range | 65.6% | 93.5% |
| Mean | 62.1% | 48.2% |
| Median | 63.3% | 48.5% |
| Interquartile 25% (IQ1) | 52.7% | 33.8% |
| Interquartile 75% (IQ3) | 72.3% | 62.3% |
| Interquartile Range (IQR) | 19.7% | 28.4% |
| Standard Deviation (Sample) | 13.2% | 21.9% |
| Standard Deviation (Population) | 13.0% | 21.8% |
Similar Demographics by 2 or more Vehicles in Household
Demographics Similar to Spanish American Indians by 2 or more Vehicles in Household
In terms of 2 or more vehicles in household, the demographic groups most similar to Spanish American Indians are Finnish (60.3%, a difference of 0.030%), Arapaho (60.2%, a difference of 0.11%), Hawaiian (60.4%, a difference of 0.16%), Immigrants from Mexico (60.2%, a difference of 0.16%), and Spanish (60.2%, a difference of 0.22%).
| Demographics | Rating | Rank | 2 or more Vehicles in Household |
| Immigrants | Vietnam | 100.0 /100 | #24 | Exceptional 60.9% |
| Whites/Caucasians | 100.0 /100 | #25 | Exceptional 60.8% |
| Welsh | 100.0 /100 | #26 | Exceptional 60.8% |
| Assyrians/Chaldeans/Syriacs | 100.0 /100 | #27 | Exceptional 60.5% |
| Guamanians/Chamorros | 100.0 /100 | #28 | Exceptional 60.5% |
| Hawaiians | 100.0 /100 | #29 | Exceptional 60.4% |
| Finns | 100.0 /100 | #30 | Exceptional 60.3% |
| Spanish American Indians | 100.0 /100 | #31 | Exceptional 60.3% |
| Arapaho | 100.0 /100 | #32 | Exceptional 60.2% |
| Immigrants | Mexico | 100.0 /100 | #33 | Exceptional 60.2% |
| Spanish | 100.0 /100 | #34 | Exceptional 60.2% |
| Immigrants | Philippines | 100.0 /100 | #35 | Exceptional 60.1% |
| Chinese | 100.0 /100 | #36 | Exceptional 60.1% |
| Irish | 100.0 /100 | #37 | Exceptional 60.1% |
| Americans | 100.0 /100 | #38 | Exceptional 60.0% |
Demographics Similar to Trinidadians and Tobagonians by 2 or more Vehicles in Household
In terms of 2 or more vehicles in household, the demographic groups most similar to Trinidadians and Tobagonians are Immigrants from Ecuador (40.5%, a difference of 0.92%), West Indian (41.3%, a difference of 0.98%), Immigrants from Trinidad and Tobago (40.3%, a difference of 1.5%), Immigrants from Dominica (41.6%, a difference of 1.8%), and Ecuadorian (42.0%, a difference of 2.7%).
| Demographics | Rating | Rank | 2 or more Vehicles in Household |
| Immigrants | West Indies | 0.0 /100 | #325 | Tragic 43.1% |
| Immigrants | Senegal | 0.0 /100 | #326 | Tragic 43.0% |
| Immigrants | Yemen | 0.0 /100 | #327 | Tragic 42.8% |
| Inupiat | 0.0 /100 | #328 | Tragic 42.6% |
| Ecuadorians | 0.0 /100 | #329 | Tragic 42.0% |
| Immigrants | Dominica | 0.0 /100 | #330 | Tragic 41.6% |
| West Indians | 0.0 /100 | #331 | Tragic 41.3% |
| Trinidadians and Tobagonians | 0.0 /100 | #332 | Tragic 40.9% |
| Immigrants | Ecuador | 0.0 /100 | #333 | Tragic 40.5% |
| Immigrants | Trinidad and Tobago | 0.0 /100 | #334 | Tragic 40.3% |
| Immigrants | Bangladesh | 0.0 /100 | #335 | Tragic 38.8% |
| Vietnamese | 0.0 /100 | #336 | Tragic 38.5% |
| Barbadians | 0.0 /100 | #337 | Tragic 38.3% |
| Immigrants | Uzbekistan | 0.0 /100 | #338 | Tragic 37.9% |
| Immigrants | Barbados | 0.0 /100 | #339 | Tragic 35.8% |