Portuguese vs Trinidadian and Tobagonian 2 or more Vehicles in Household
COMPARE
Portuguese
Trinidadian and Tobagonian
2 or more Vehicles in Household
2 or more Vehicles in Household Comparison
Portuguese
Trinidadians and Tobagonians
58.6%
2 OR MORE VEHICLES IN HOUSEHOLD
99.7/ 100
METRIC RATING
64th/ 347
METRIC RANK
40.9%
2 OR MORE VEHICLES IN HOUSEHOLD
0.0/ 100
METRIC RATING
332nd/ 347
METRIC RANK
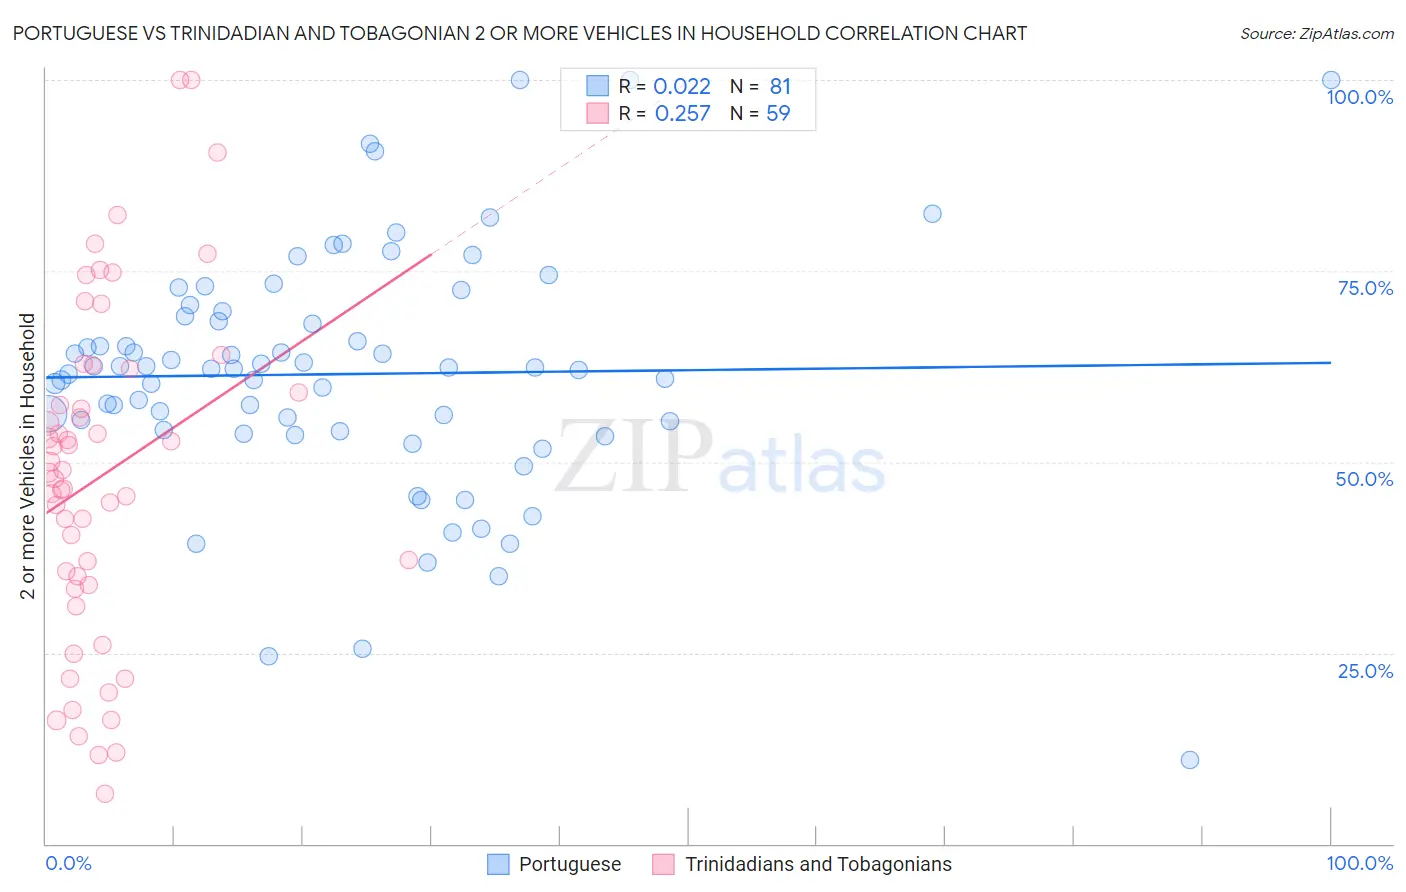
Portuguese vs Trinidadian and Tobagonian 2 or more Vehicles in Household Correlation Chart
The statistical analysis conducted on geographies consisting of 450,032,677 people shows no correlation between the proportion of Portuguese and percentage of households with 2 or more vehicles available in the United States with a correlation coefficient (R) of 0.022 and weighted average of 58.6%. Similarly, the statistical analysis conducted on geographies consisting of 219,730,048 people shows a weak positive correlation between the proportion of Trinidadians and Tobagonians and percentage of households with 2 or more vehicles available in the United States with a correlation coefficient (R) of 0.257 and weighted average of 40.9%, a difference of 43.4%.
2 or more Vehicles in Household Correlation Summary
| Measurement | Portuguese | Trinidadian and Tobagonian |
| Minimum | 11.0% | 6.5% |
| Maximum | 100.0% | 100.0% |
| Range | 89.0% | 93.5% |
| Mean | 61.5% | 48.2% |
| Median | 62.2% | 48.5% |
| Interquartile 25% (IQ1) | 54.1% | 33.8% |
| Interquartile 75% (IQ3) | 69.4% | 62.3% |
| Interquartile Range (IQR) | 15.3% | 28.4% |
| Standard Deviation (Sample) | 15.9% | 21.9% |
| Standard Deviation (Population) | 15.8% | 21.8% |
Similar Demographics by 2 or more Vehicles in Household
Demographics Similar to Portuguese by 2 or more Vehicles in Household
In terms of 2 or more vehicles in household, the demographic groups most similar to Portuguese are Immigrants from Central America (58.6%, a difference of 0.050%), Croatian (58.6%, a difference of 0.060%), Laotian (58.6%, a difference of 0.070%), Canadian (58.6%, a difference of 0.090%), and Mexican American Indian (58.7%, a difference of 0.16%).
| Demographics | Rating | Rank | 2 or more Vehicles in Household |
| Afghans | 99.9 /100 | #57 | Exceptional 59.0% |
| Immigrants | Scotland | 99.8 /100 | #58 | Exceptional 58.9% |
| Spanish Americans | 99.8 /100 | #59 | Exceptional 58.9% |
| French Canadians | 99.8 /100 | #60 | Exceptional 58.9% |
| Osage | 99.8 /100 | #61 | Exceptional 58.8% |
| Immigrants | Nonimmigrants | 99.8 /100 | #62 | Exceptional 58.8% |
| Mexican American Indians | 99.8 /100 | #63 | Exceptional 58.7% |
| Portuguese | 99.7 /100 | #64 | Exceptional 58.6% |
| Immigrants | Central America | 99.7 /100 | #65 | Exceptional 58.6% |
| Croatians | 99.7 /100 | #66 | Exceptional 58.6% |
| Laotians | 99.7 /100 | #67 | Exceptional 58.6% |
| Canadians | 99.7 /100 | #68 | Exceptional 58.6% |
| Pennsylvania Germans | 99.7 /100 | #69 | Exceptional 58.5% |
| Italians | 99.6 /100 | #70 | Exceptional 58.4% |
| Bangladeshis | 99.6 /100 | #71 | Exceptional 58.4% |
Demographics Similar to Trinidadians and Tobagonians by 2 or more Vehicles in Household
In terms of 2 or more vehicles in household, the demographic groups most similar to Trinidadians and Tobagonians are Immigrants from Ecuador (40.5%, a difference of 0.92%), West Indian (41.3%, a difference of 0.98%), Immigrants from Trinidad and Tobago (40.3%, a difference of 1.5%), Immigrants from Dominica (41.6%, a difference of 1.8%), and Ecuadorian (42.0%, a difference of 2.7%).
| Demographics | Rating | Rank | 2 or more Vehicles in Household |
| Immigrants | West Indies | 0.0 /100 | #325 | Tragic 43.1% |
| Immigrants | Senegal | 0.0 /100 | #326 | Tragic 43.0% |
| Immigrants | Yemen | 0.0 /100 | #327 | Tragic 42.8% |
| Inupiat | 0.0 /100 | #328 | Tragic 42.6% |
| Ecuadorians | 0.0 /100 | #329 | Tragic 42.0% |
| Immigrants | Dominica | 0.0 /100 | #330 | Tragic 41.6% |
| West Indians | 0.0 /100 | #331 | Tragic 41.3% |
| Trinidadians and Tobagonians | 0.0 /100 | #332 | Tragic 40.9% |
| Immigrants | Ecuador | 0.0 /100 | #333 | Tragic 40.5% |
| Immigrants | Trinidad and Tobago | 0.0 /100 | #334 | Tragic 40.3% |
| Immigrants | Bangladesh | 0.0 /100 | #335 | Tragic 38.8% |
| Vietnamese | 0.0 /100 | #336 | Tragic 38.5% |
| Barbadians | 0.0 /100 | #337 | Tragic 38.3% |
| Immigrants | Uzbekistan | 0.0 /100 | #338 | Tragic 37.9% |
| Immigrants | Barbados | 0.0 /100 | #339 | Tragic 35.8% |