Ugandan vs Ghanaian Householder Income Under 25 years
COMPARE
Ugandan
Ghanaian
Householder Income Under 25 years
Householder Income Under 25 years Comparison
Ugandans
Ghanaians
$50,923
HOUSEHOLDER INCOME UNDER 25 YEARS
4.3/ 100
METRIC RATING
231st/ 347
METRIC RANK
$52,594
HOUSEHOLDER INCOME UNDER 25 YEARS
72.9/ 100
METRIC RATING
157th/ 347
METRIC RANK
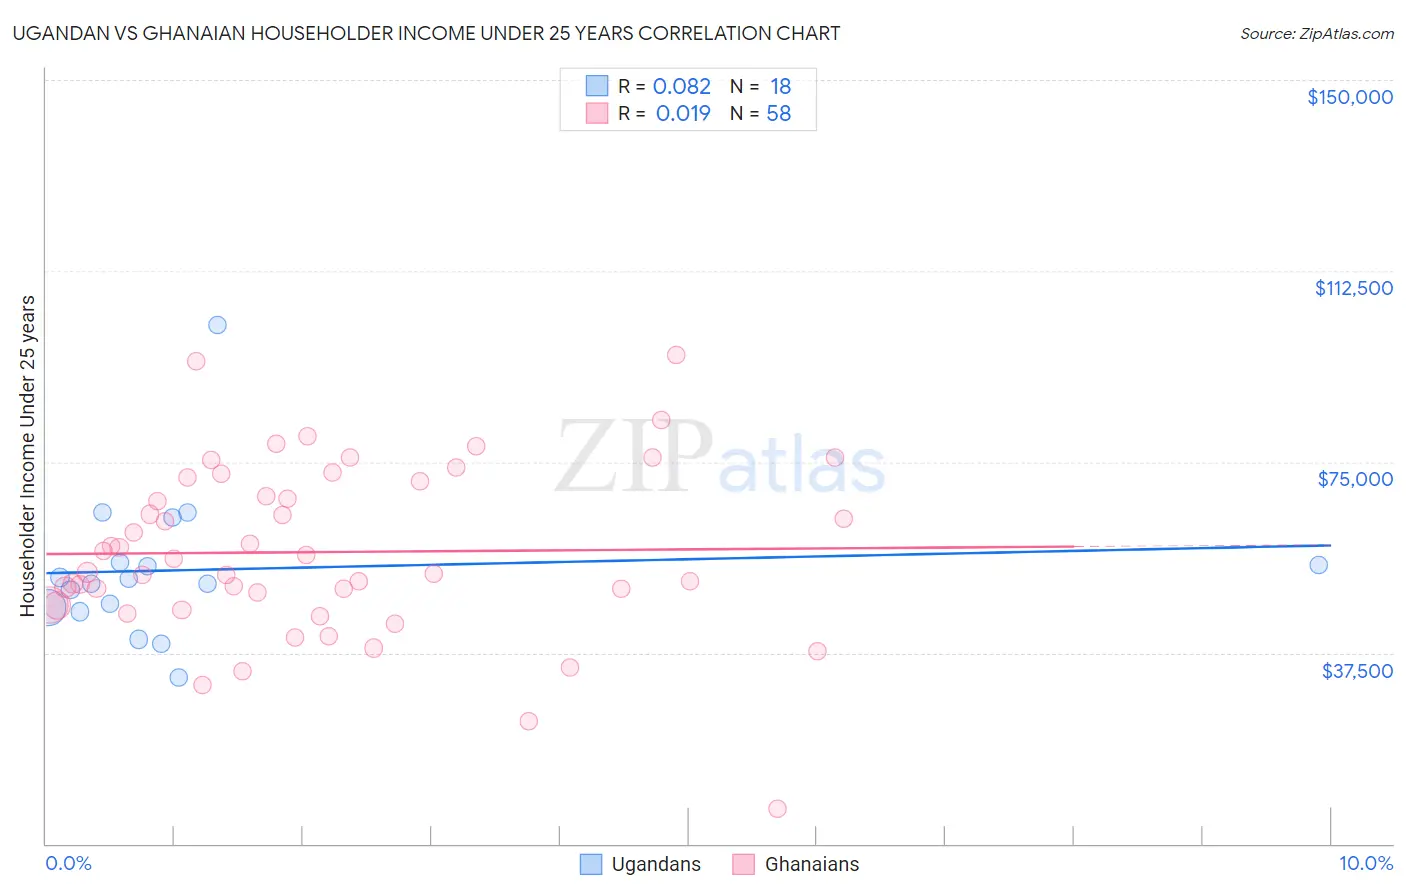
Ugandan vs Ghanaian Householder Income Under 25 years Correlation Chart
The statistical analysis conducted on geographies consisting of 89,521,491 people shows a slight positive correlation between the proportion of Ugandans and household income with householder under the age of 25 in the United States with a correlation coefficient (R) of 0.082 and weighted average of $50,923. Similarly, the statistical analysis conducted on geographies consisting of 172,179,779 people shows no correlation between the proportion of Ghanaians and household income with householder under the age of 25 in the United States with a correlation coefficient (R) of 0.019 and weighted average of $52,594, a difference of 3.3%.
Householder Income Under 25 years Correlation Summary
| Measurement | Ugandan | Ghanaian |
| Minimum | $32,682 | $6,940 |
| Maximum | $101,868 | $96,053 |
| Range | $69,186 | $89,113 |
| Mean | $53,778 | $57,281 |
| Median | $51,561 | $54,641 |
| Interquartile 25% (IQ1) | $46,457 | $46,996 |
| Interquartile 75% (IQ3) | $55,330 | $71,280 |
| Interquartile Range (IQR) | $8,874 | $24,284 |
| Standard Deviation (Sample) | $14,802 | $16,793 |
| Standard Deviation (Population) | $14,385 | $16,648 |
Similar Demographics by Householder Income Under 25 years
Demographics Similar to Ugandans by Householder Income Under 25 years
In terms of householder income under 25 years, the demographic groups most similar to Ugandans are Jamaican ($50,929, a difference of 0.010%), Yuman ($50,933, a difference of 0.020%), Slovene ($50,886, a difference of 0.070%), Immigrants from Norway ($50,984, a difference of 0.12%), and Pennsylvania German ($50,852, a difference of 0.14%).
| Demographics | Rating | Rank | Householder Income Under 25 years |
| Belizeans | 6.4 /100 | #224 | Tragic $51,094 |
| Immigrants | Jamaica | 5.6 /100 | #225 | Tragic $51,038 |
| Yugoslavians | 5.5 /100 | #226 | Tragic $51,028 |
| Immigrants | Central America | 5.4 /100 | #227 | Tragic $51,022 |
| Immigrants | Norway | 5.0 /100 | #228 | Tragic $50,984 |
| Yuman | 4.4 /100 | #229 | Tragic $50,933 |
| Jamaicans | 4.4 /100 | #230 | Tragic $50,929 |
| Ugandans | 4.3 /100 | #231 | Tragic $50,923 |
| Slovenes | 4.0 /100 | #232 | Tragic $50,886 |
| Pennsylvania Germans | 3.7 /100 | #233 | Tragic $50,852 |
| Kenyans | 3.3 /100 | #234 | Tragic $50,815 |
| Spanish | 3.3 /100 | #235 | Tragic $50,813 |
| English | 3.3 /100 | #236 | Tragic $50,805 |
| Germans | 3.3 /100 | #237 | Tragic $50,804 |
| Iraqis | 3.2 /100 | #238 | Tragic $50,802 |
Demographics Similar to Ghanaians by Householder Income Under 25 years
In terms of householder income under 25 years, the demographic groups most similar to Ghanaians are Immigrants from Netherlands ($52,592, a difference of 0.0%), Immigrants from Nepal ($52,611, a difference of 0.030%), Immigrants from Denmark ($52,612, a difference of 0.040%), Immigrants from the Azores ($52,621, a difference of 0.050%), and Central American ($52,626, a difference of 0.060%).
| Demographics | Rating | Rank | Householder Income Under 25 years |
| Immigrants | Costa Rica | 75.2 /100 | #150 | Good $52,643 |
| Immigrants | Scotland | 75.0 /100 | #151 | Good $52,638 |
| Trinidadians and Tobagonians | 74.6 /100 | #152 | Good $52,631 |
| Central Americans | 74.4 /100 | #153 | Good $52,626 |
| Immigrants | Azores | 74.2 /100 | #154 | Good $52,621 |
| Immigrants | Denmark | 73.8 /100 | #155 | Good $52,612 |
| Immigrants | Nepal | 73.7 /100 | #156 | Good $52,611 |
| Ghanaians | 72.9 /100 | #157 | Good $52,594 |
| Immigrants | Netherlands | 72.8 /100 | #158 | Good $52,592 |
| Mongolians | 70.2 /100 | #159 | Good $52,540 |
| Immigrants | Turkey | 68.3 /100 | #160 | Good $52,503 |
| Uruguayans | 66.2 /100 | #161 | Good $52,465 |
| Immigrants | Cambodia | 65.4 /100 | #162 | Good $52,450 |
| Immigrants | Chile | 64.8 /100 | #163 | Good $52,440 |
| Immigrants | Trinidad and Tobago | 64.7 /100 | #164 | Good $52,437 |