Immigrants from Singapore vs Ghanaian 2 or more Vehicles in Household
COMPARE
Immigrants from Singapore
Ghanaian
2 or more Vehicles in Household
2 or more Vehicles in Household Comparison
Immigrants from Singapore
Ghanaians
53.9%
2 OR MORE VEHICLES IN HOUSEHOLD
6.3/ 100
METRIC RATING
221st/ 347
METRIC RANK
48.0%
2 OR MORE VEHICLES IN HOUSEHOLD
0.0/ 100
METRIC RATING
310th/ 347
METRIC RANK
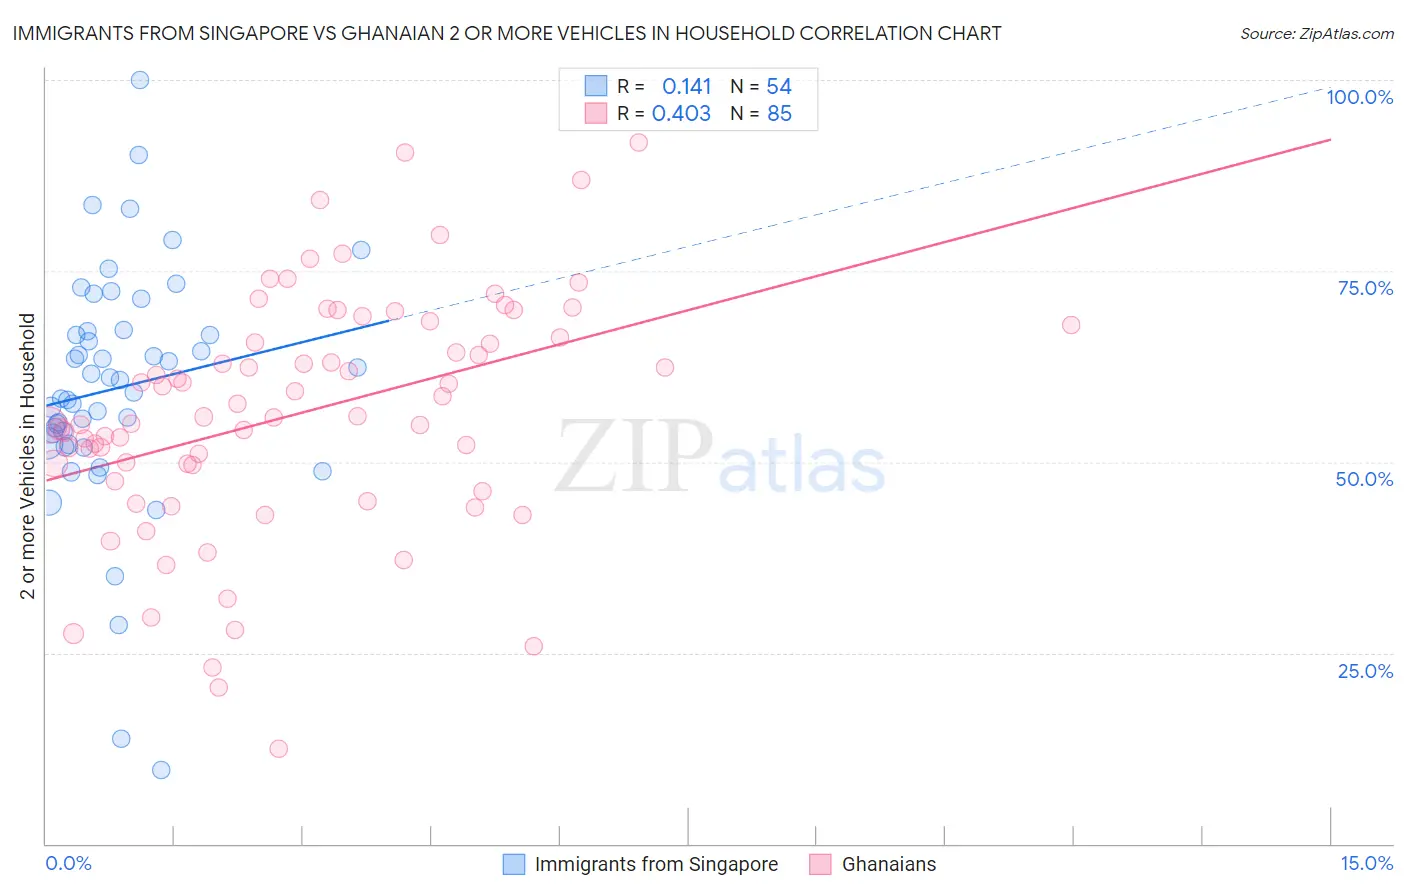
Immigrants from Singapore vs Ghanaian 2 or more Vehicles in Household Correlation Chart
The statistical analysis conducted on geographies consisting of 137,464,640 people shows a poor positive correlation between the proportion of Immigrants from Singapore and percentage of households with 2 or more vehicles available in the United States with a correlation coefficient (R) of 0.141 and weighted average of 53.9%. Similarly, the statistical analysis conducted on geographies consisting of 190,548,121 people shows a moderate positive correlation between the proportion of Ghanaians and percentage of households with 2 or more vehicles available in the United States with a correlation coefficient (R) of 0.403 and weighted average of 48.0%, a difference of 12.3%.
2 or more Vehicles in Household Correlation Summary
| Measurement | Immigrants from Singapore | Ghanaian |
| Minimum | 9.7% | 12.4% |
| Maximum | 100.0% | 91.9% |
| Range | 90.3% | 79.5% |
| Mean | 59.7% | 56.3% |
| Median | 59.9% | 55.9% |
| Interquartile 25% (IQ1) | 52.4% | 48.5% |
| Interquartile 75% (IQ3) | 67.1% | 67.2% |
| Interquartile Range (IQR) | 14.6% | 18.7% |
| Standard Deviation (Sample) | 15.9% | 15.6% |
| Standard Deviation (Population) | 15.7% | 15.5% |
Similar Demographics by 2 or more Vehicles in Household
Demographics Similar to Immigrants from Singapore by 2 or more Vehicles in Household
In terms of 2 or more vehicles in household, the demographic groups most similar to Immigrants from Singapore are Taiwanese (53.9%, a difference of 0.010%), Kiowa (53.9%, a difference of 0.010%), South American Indian (53.9%, a difference of 0.040%), Immigrants from Argentina (53.9%, a difference of 0.10%), and Immigrants from Burma/Myanmar (53.9%, a difference of 0.14%).
| Demographics | Rating | Rank | 2 or more Vehicles in Household |
| Immigrants | Czechoslovakia | 9.4 /100 | #214 | Tragic 54.1% |
| Aleuts | 9.3 /100 | #215 | Tragic 54.1% |
| Immigrants | Western Asia | 9.3 /100 | #216 | Tragic 54.1% |
| Immigrants | Burma/Myanmar | 7.1 /100 | #217 | Tragic 53.9% |
| Immigrants | Argentina | 6.8 /100 | #218 | Tragic 53.9% |
| South American Indians | 6.5 /100 | #219 | Tragic 53.9% |
| Taiwanese | 6.3 /100 | #220 | Tragic 53.9% |
| Immigrants | Singapore | 6.3 /100 | #221 | Tragic 53.9% |
| Kiowa | 6.2 /100 | #222 | Tragic 53.9% |
| Immigrants | Bosnia and Herzegovina | 5.5 /100 | #223 | Tragic 53.8% |
| Brazilians | 5.3 /100 | #224 | Tragic 53.8% |
| Immigrants | Egypt | 5.2 /100 | #225 | Tragic 53.8% |
| Immigrants | Eastern Africa | 5.1 /100 | #226 | Tragic 53.7% |
| Sudanese | 4.1 /100 | #227 | Tragic 53.6% |
| Alaska Natives | 3.9 /100 | #228 | Tragic 53.6% |
Demographics Similar to Ghanaians by 2 or more Vehicles in Household
In terms of 2 or more vehicles in household, the demographic groups most similar to Ghanaians are Immigrants from Belarus (47.9%, a difference of 0.12%), Haitian (47.6%, a difference of 0.86%), U.S. Virgin Islander (47.5%, a difference of 1.0%), Immigrants from Ghana (47.4%, a difference of 1.3%), and Moroccan (48.8%, a difference of 1.8%).
| Demographics | Rating | Rank | 2 or more Vehicles in Household |
| Tohono O'odham | 0.0 /100 | #303 | Tragic 50.0% |
| Immigrants | Belize | 0.0 /100 | #304 | Tragic 49.9% |
| Immigrants | Western Africa | 0.0 /100 | #305 | Tragic 49.4% |
| Immigrants | Israel | 0.0 /100 | #306 | Tragic 49.2% |
| Hopi | 0.0 /100 | #307 | Tragic 49.0% |
| Albanians | 0.0 /100 | #308 | Tragic 49.0% |
| Moroccans | 0.0 /100 | #309 | Tragic 48.8% |
| Ghanaians | 0.0 /100 | #310 | Tragic 48.0% |
| Immigrants | Belarus | 0.0 /100 | #311 | Tragic 47.9% |
| Haitians | 0.0 /100 | #312 | Tragic 47.6% |
| U.S. Virgin Islanders | 0.0 /100 | #313 | Tragic 47.5% |
| Immigrants | Ghana | 0.0 /100 | #314 | Tragic 47.4% |
| Puerto Ricans | 0.0 /100 | #315 | Tragic 47.1% |
| Cape Verdeans | 0.0 /100 | #316 | Tragic 46.8% |
| Immigrants | Haiti | 0.0 /100 | #317 | Tragic 46.5% |