Tlingit-Haida vs Ghanaian 2 or more Vehicles in Household
COMPARE
Tlingit-Haida
Ghanaian
2 or more Vehicles in Household
2 or more Vehicles in Household Comparison
Tlingit-Haida
Ghanaians
55.8%
2 OR MORE VEHICLES IN HOUSEHOLD
68.5/ 100
METRIC RATING
158th/ 347
METRIC RANK
48.0%
2 OR MORE VEHICLES IN HOUSEHOLD
0.0/ 100
METRIC RATING
310th/ 347
METRIC RANK
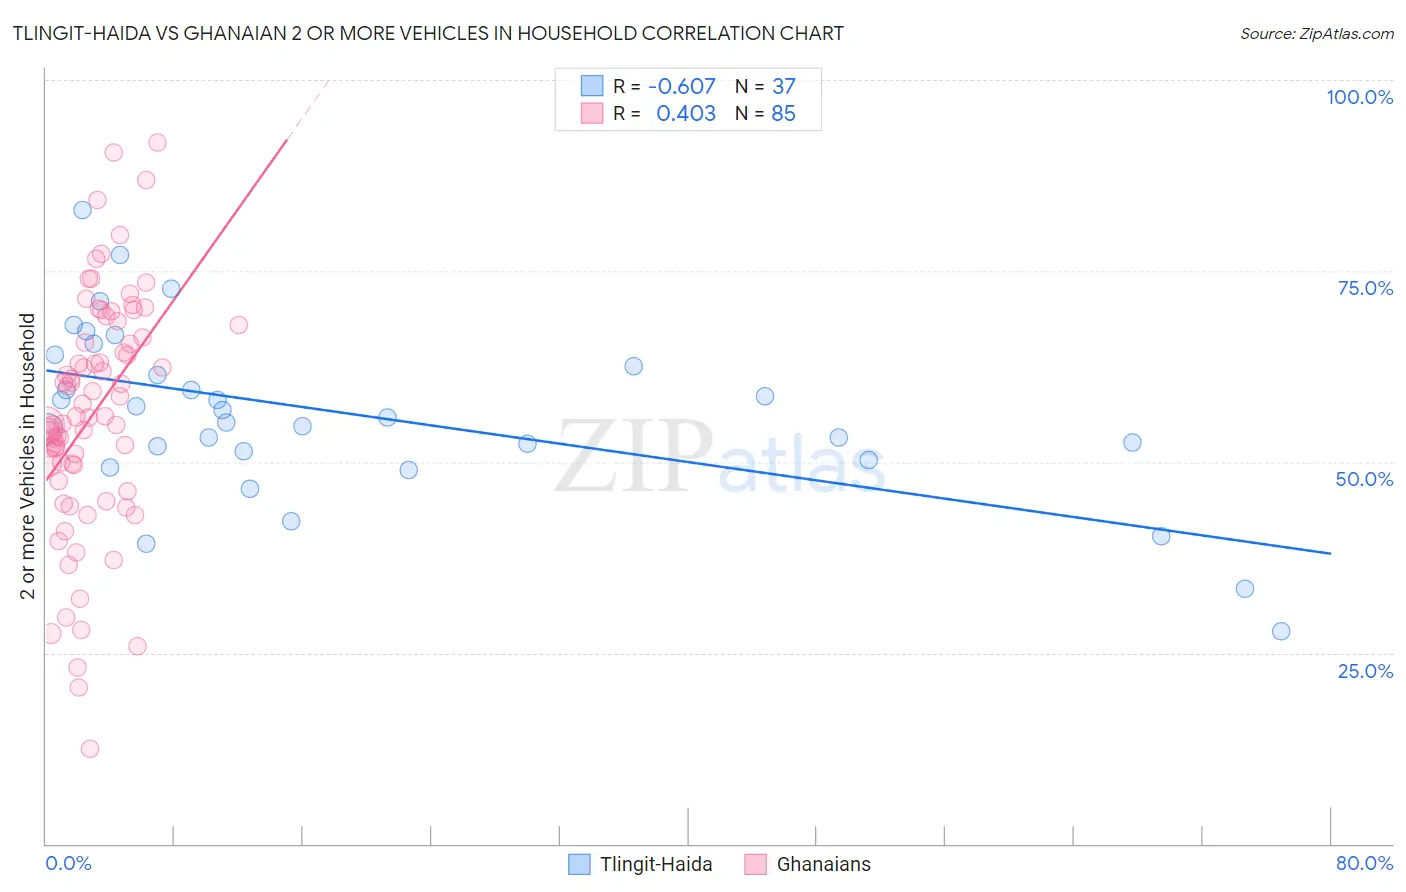
Tlingit-Haida vs Ghanaian 2 or more Vehicles in Household Correlation Chart
The statistical analysis conducted on geographies consisting of 60,853,675 people shows a significant negative correlation between the proportion of Tlingit-Haida and percentage of households with 2 or more vehicles available in the United States with a correlation coefficient (R) of -0.607 and weighted average of 55.8%. Similarly, the statistical analysis conducted on geographies consisting of 190,548,121 people shows a moderate positive correlation between the proportion of Ghanaians and percentage of households with 2 or more vehicles available in the United States with a correlation coefficient (R) of 0.403 and weighted average of 48.0%, a difference of 16.3%.
2 or more Vehicles in Household Correlation Summary
| Measurement | Tlingit-Haida | Ghanaian |
| Minimum | 27.8% | 12.4% |
| Maximum | 83.0% | 91.9% |
| Range | 55.2% | 79.5% |
| Mean | 56.2% | 56.3% |
| Median | 55.8% | 55.9% |
| Interquartile 25% (IQ1) | 50.8% | 48.5% |
| Interquartile 75% (IQ3) | 63.2% | 67.2% |
| Interquartile Range (IQR) | 12.4% | 18.7% |
| Standard Deviation (Sample) | 11.4% | 15.6% |
| Standard Deviation (Population) | 11.2% | 15.5% |
Similar Demographics by 2 or more Vehicles in Household
Demographics Similar to Tlingit-Haida by 2 or more Vehicles in Household
In terms of 2 or more vehicles in household, the demographic groups most similar to Tlingit-Haida are Paiute (55.8%, a difference of 0.020%), Crow (55.7%, a difference of 0.070%), Immigrants from Kuwait (55.8%, a difference of 0.080%), Immigrants from Lithuania (55.8%, a difference of 0.090%), and Ukrainian (55.8%, a difference of 0.10%).
| Demographics | Rating | Rank | 2 or more Vehicles in Household |
| Immigrants | Northern Europe | 78.7 /100 | #151 | Good 56.1% |
| Immigrants | Pakistan | 78.1 /100 | #152 | Good 56.1% |
| Lumbee | 71.9 /100 | #153 | Good 55.9% |
| Ukrainians | 70.8 /100 | #154 | Good 55.8% |
| Immigrants | Venezuela | 70.7 /100 | #155 | Good 55.8% |
| Immigrants | Lithuania | 70.4 /100 | #156 | Good 55.8% |
| Immigrants | Kuwait | 70.2 /100 | #157 | Good 55.8% |
| Tlingit-Haida | 68.5 /100 | #158 | Good 55.8% |
| Paiute | 68.0 /100 | #159 | Good 55.8% |
| Crow | 67.0 /100 | #160 | Good 55.7% |
| Colville | 61.1 /100 | #161 | Good 55.6% |
| German Russians | 60.9 /100 | #162 | Good 55.6% |
| Immigrants | Zimbabwe | 60.2 /100 | #163 | Good 55.6% |
| Dutch West Indians | 59.8 /100 | #164 | Average 55.6% |
| Immigrants | El Salvador | 59.4 /100 | #165 | Average 55.6% |
Demographics Similar to Ghanaians by 2 or more Vehicles in Household
In terms of 2 or more vehicles in household, the demographic groups most similar to Ghanaians are Immigrants from Belarus (47.9%, a difference of 0.12%), Haitian (47.6%, a difference of 0.86%), U.S. Virgin Islander (47.5%, a difference of 1.0%), Immigrants from Ghana (47.4%, a difference of 1.3%), and Moroccan (48.8%, a difference of 1.8%).
| Demographics | Rating | Rank | 2 or more Vehicles in Household |
| Tohono O'odham | 0.0 /100 | #303 | Tragic 50.0% |
| Immigrants | Belize | 0.0 /100 | #304 | Tragic 49.9% |
| Immigrants | Western Africa | 0.0 /100 | #305 | Tragic 49.4% |
| Immigrants | Israel | 0.0 /100 | #306 | Tragic 49.2% |
| Hopi | 0.0 /100 | #307 | Tragic 49.0% |
| Albanians | 0.0 /100 | #308 | Tragic 49.0% |
| Moroccans | 0.0 /100 | #309 | Tragic 48.8% |
| Ghanaians | 0.0 /100 | #310 | Tragic 48.0% |
| Immigrants | Belarus | 0.0 /100 | #311 | Tragic 47.9% |
| Haitians | 0.0 /100 | #312 | Tragic 47.6% |
| U.S. Virgin Islanders | 0.0 /100 | #313 | Tragic 47.5% |
| Immigrants | Ghana | 0.0 /100 | #314 | Tragic 47.4% |
| Puerto Ricans | 0.0 /100 | #315 | Tragic 47.1% |
| Cape Verdeans | 0.0 /100 | #316 | Tragic 46.8% |
| Immigrants | Haiti | 0.0 /100 | #317 | Tragic 46.5% |