Tlingit-Haida vs Immigrants from Cambodia Professional Degree
COMPARE
Tlingit-Haida
Immigrants from Cambodia
Professional Degree
Professional Degree Comparison
Tlingit-Haida
Immigrants from Cambodia
4.0%
PROFESSIONAL DEGREE
6.9/ 100
METRIC RATING
225th/ 347
METRIC RANK
3.6%
PROFESSIONAL DEGREE
0.9/ 100
METRIC RATING
264th/ 347
METRIC RANK
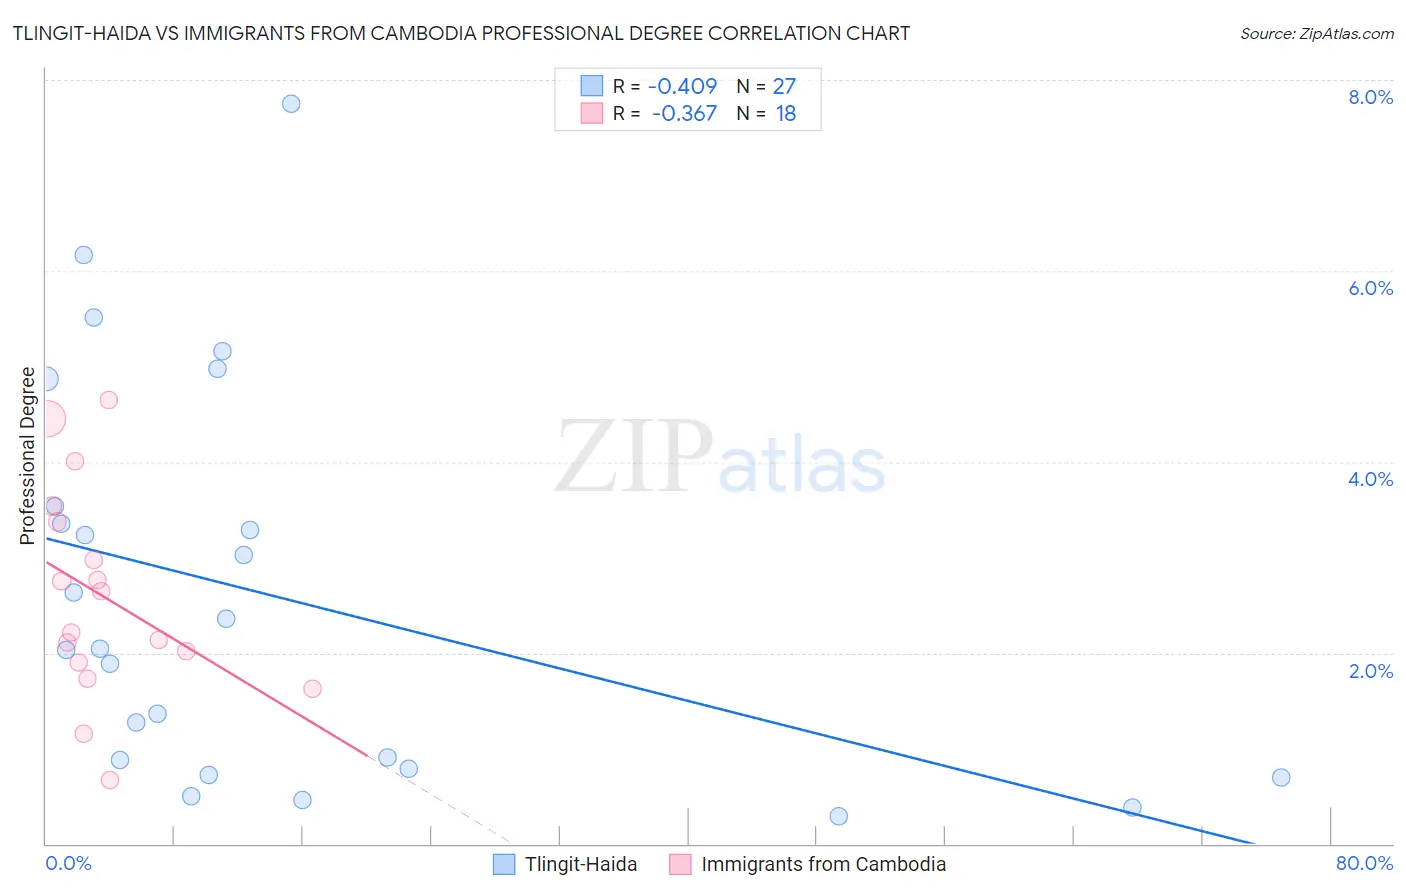
Tlingit-Haida vs Immigrants from Cambodia Professional Degree Correlation Chart
The statistical analysis conducted on geographies consisting of 60,804,228 people shows a moderate negative correlation between the proportion of Tlingit-Haida and percentage of population with at least professional degree education in the United States with a correlation coefficient (R) of -0.409 and weighted average of 4.0%. Similarly, the statistical analysis conducted on geographies consisting of 205,005,692 people shows a mild negative correlation between the proportion of Immigrants from Cambodia and percentage of population with at least professional degree education in the United States with a correlation coefficient (R) of -0.367 and weighted average of 3.6%, a difference of 9.5%.
Professional Degree Correlation Summary
| Measurement | Tlingit-Haida | Immigrants from Cambodia |
| Minimum | 0.29% | 0.67% |
| Maximum | 7.8% | 4.7% |
| Range | 7.5% | 4.0% |
| Mean | 2.6% | 2.6% |
| Median | 2.0% | 2.4% |
| Interquartile 25% (IQ1) | 0.79% | 1.9% |
| Interquartile 75% (IQ3) | 3.5% | 3.4% |
| Interquartile Range (IQR) | 2.7% | 1.5% |
| Standard Deviation (Sample) | 2.0% | 1.1% |
| Standard Deviation (Population) | 2.0% | 1.1% |
Similar Demographics by Professional Degree
Demographics Similar to Tlingit-Haida by Professional Degree
In terms of professional degree, the demographic groups most similar to Tlingit-Haida are Trinidadian and Tobagonian (4.0%, a difference of 0.13%), Immigrants from Bosnia and Herzegovina (4.0%, a difference of 0.27%), Immigrants from Western Africa (4.0%, a difference of 0.35%), German Russian (4.0%, a difference of 0.55%), and French Canadian (4.0%, a difference of 0.60%).
| Demographics | Rating | Rank | Professional Degree |
| Dutch | 9.0 /100 | #218 | Tragic 4.0% |
| Immigrants | South Eastern Asia | 8.9 /100 | #219 | Tragic 4.0% |
| Ute | 8.2 /100 | #220 | Tragic 4.0% |
| French Canadians | 8.0 /100 | #221 | Tragic 4.0% |
| Immigrants | Western Africa | 7.5 /100 | #222 | Tragic 4.0% |
| Immigrants | Bosnia and Herzegovina | 7.4 /100 | #223 | Tragic 4.0% |
| Trinidadians and Tobagonians | 7.1 /100 | #224 | Tragic 4.0% |
| Tlingit-Haida | 6.9 /100 | #225 | Tragic 4.0% |
| German Russians | 6.1 /100 | #226 | Tragic 4.0% |
| Cubans | 5.9 /100 | #227 | Tragic 4.0% |
| Immigrants | West Indies | 5.6 /100 | #228 | Tragic 4.0% |
| Immigrants | Burma/Myanmar | 5.4 /100 | #229 | Tragic 3.9% |
| Nicaraguans | 5.1 /100 | #230 | Tragic 3.9% |
| Ecuadorians | 4.6 /100 | #231 | Tragic 3.9% |
| Cree | 4.3 /100 | #232 | Tragic 3.9% |
Demographics Similar to Immigrants from Cambodia by Professional Degree
In terms of professional degree, the demographic groups most similar to Immigrants from Cambodia are Hopi (3.6%, a difference of 0.020%), Immigrants from Congo (3.6%, a difference of 0.040%), Central American Indian (3.6%, a difference of 0.36%), U.S. Virgin Islander (3.7%, a difference of 0.52%), and Immigrants from Guyana (3.7%, a difference of 0.53%).
| Demographics | Rating | Rank | Professional Degree |
| Bahamians | 1.1 /100 | #257 | Tragic 3.7% |
| Immigrants | St. Vincent and the Grenadines | 1.1 /100 | #258 | Tragic 3.7% |
| Africans | 1.0 /100 | #259 | Tragic 3.7% |
| Indonesians | 1.0 /100 | #260 | Tragic 3.7% |
| Immigrants | Guyana | 1.0 /100 | #261 | Tragic 3.7% |
| U.S. Virgin Islanders | 1.0 /100 | #262 | Tragic 3.7% |
| Hopi | 0.9 /100 | #263 | Tragic 3.6% |
| Immigrants | Cambodia | 0.9 /100 | #264 | Tragic 3.6% |
| Immigrants | Congo | 0.8 /100 | #265 | Tragic 3.6% |
| Central American Indians | 0.8 /100 | #266 | Tragic 3.6% |
| Delaware | 0.7 /100 | #267 | Tragic 3.6% |
| Aleuts | 0.7 /100 | #268 | Tragic 3.6% |
| Immigrants | Cuba | 0.6 /100 | #269 | Tragic 3.6% |
| Central Americans | 0.6 /100 | #270 | Tragic 3.6% |
| Belizeans | 0.5 /100 | #271 | Tragic 3.6% |