Tlingit-Haida vs Basque No Vehicles in Household
COMPARE
Tlingit-Haida
Basque
No Vehicles in Household
No Vehicles in Household Comparison
Tlingit-Haida
Basques
10.1%
NO VEHICLES IN HOUSEHOLD
72.5/ 100
METRIC RATING
153rd/ 347
METRIC RANK
7.8%
NO VEHICLES IN HOUSEHOLD
99.9/ 100
METRIC RATING
37th/ 347
METRIC RANK
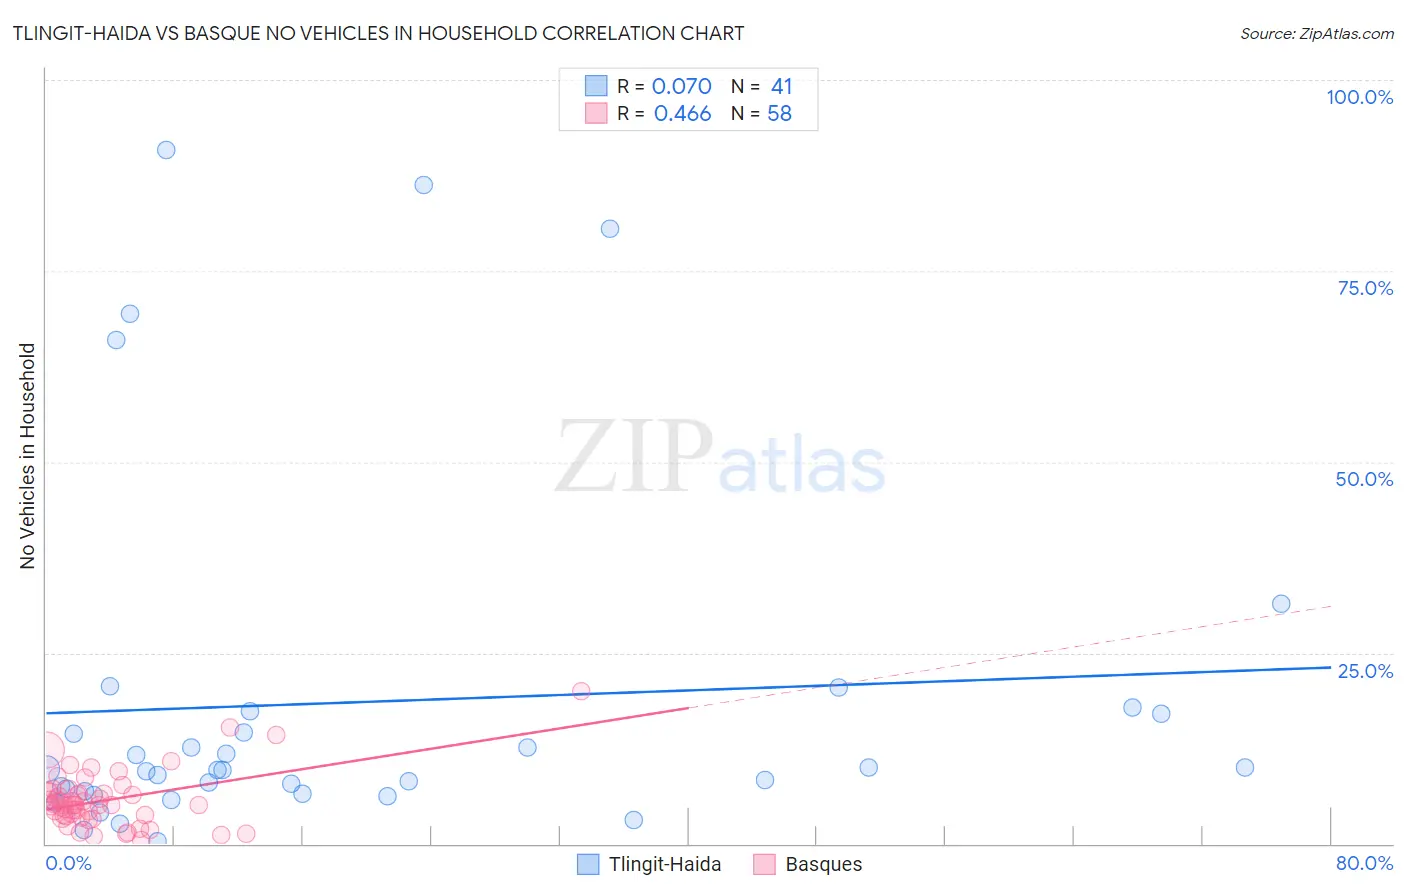
Tlingit-Haida vs Basque No Vehicles in Household Correlation Chart
The statistical analysis conducted on geographies consisting of 60,779,226 people shows a slight positive correlation between the proportion of Tlingit-Haida and percentage of households with no vehicle available in the United States with a correlation coefficient (R) of 0.070 and weighted average of 10.1%. Similarly, the statistical analysis conducted on geographies consisting of 165,489,078 people shows a moderate positive correlation between the proportion of Basques and percentage of households with no vehicle available in the United States with a correlation coefficient (R) of 0.466 and weighted average of 7.8%, a difference of 29.6%.
No Vehicles in Household Correlation Summary
| Measurement | Tlingit-Haida | Basque |
| Minimum | 0.39% | 0.51% |
| Maximum | 90.9% | 20.0% |
| Range | 90.5% | 19.5% |
| Mean | 18.5% | 5.7% |
| Median | 9.7% | 5.1% |
| Interquartile 25% (IQ1) | 6.7% | 3.6% |
| Interquartile 75% (IQ3) | 17.2% | 6.7% |
| Interquartile Range (IQR) | 10.4% | 3.1% |
| Standard Deviation (Sample) | 23.6% | 3.7% |
| Standard Deviation (Population) | 23.4% | 3.6% |
Similar Demographics by No Vehicles in Household
Demographics Similar to Tlingit-Haida by No Vehicles in Household
In terms of no vehicles in household, the demographic groups most similar to Tlingit-Haida are Sioux (10.1%, a difference of 0.020%), Salvadoran (10.1%, a difference of 0.030%), Immigrants from Congo (10.1%, a difference of 0.090%), Immigrants from Eastern Africa (10.0%, a difference of 0.23%), and Colombian (10.0%, a difference of 0.24%).
| Demographics | Rating | Rank | No Vehicles in Household |
| Hungarians | 80.0 /100 | #146 | Excellent 9.9% |
| Immigrants | Nicaragua | 79.8 /100 | #147 | Good 9.9% |
| Immigrants | Bosnia and Herzegovina | 79.1 /100 | #148 | Good 9.9% |
| Immigrants | Uganda | 76.1 /100 | #149 | Good 10.0% |
| Colombians | 73.9 /100 | #150 | Good 10.0% |
| Immigrants | Eastern Africa | 73.8 /100 | #151 | Good 10.0% |
| Immigrants | Congo | 73.0 /100 | #152 | Good 10.1% |
| Tlingit-Haida | 72.5 /100 | #153 | Good 10.1% |
| Sioux | 72.4 /100 | #154 | Good 10.1% |
| Salvadorans | 72.4 /100 | #155 | Good 10.1% |
| Immigrants | Micronesia | 70.9 /100 | #156 | Good 10.1% |
| Australians | 70.6 /100 | #157 | Good 10.1% |
| Spanish American Indians | 70.2 /100 | #158 | Good 10.1% |
| Immigrants | Indonesia | 69.3 /100 | #159 | Good 10.1% |
| Immigrants | Middle Africa | 65.7 /100 | #160 | Good 10.2% |
Demographics Similar to Basques by No Vehicles in Household
In terms of no vehicles in household, the demographic groups most similar to Basques are Creek (7.8%, a difference of 0.14%), Iraqi (7.7%, a difference of 0.25%), Cherokee (7.7%, a difference of 0.39%), Immigrants from Vietnam (7.7%, a difference of 0.53%), and Immigrants from Taiwan (7.7%, a difference of 0.66%).
| Demographics | Rating | Rank | No Vehicles in Household |
| Finns | 100.0 /100 | #30 | Exceptional 7.7% |
| Native Hawaiians | 100.0 /100 | #31 | Exceptional 7.7% |
| Malaysians | 100.0 /100 | #32 | Exceptional 7.7% |
| Immigrants | Taiwan | 100.0 /100 | #33 | Exceptional 7.7% |
| Immigrants | Vietnam | 100.0 /100 | #34 | Exceptional 7.7% |
| Cherokee | 99.9 /100 | #35 | Exceptional 7.7% |
| Iraqis | 99.9 /100 | #36 | Exceptional 7.7% |
| Basques | 99.9 /100 | #37 | Exceptional 7.8% |
| Creek | 99.9 /100 | #38 | Exceptional 7.8% |
| Immigrants | Fiji | 99.9 /100 | #39 | Exceptional 7.8% |
| Czechoslovakians | 99.9 /100 | #40 | Exceptional 7.8% |
| French Canadians | 99.9 /100 | #41 | Exceptional 7.8% |
| Swiss | 99.9 /100 | #42 | Exceptional 7.9% |
| Chickasaw | 99.9 /100 | #43 | Exceptional 7.9% |
| Choctaw | 99.9 /100 | #44 | Exceptional 7.9% |