Tlingit-Haida vs Maltese No Vehicles in Household
COMPARE
Tlingit-Haida
Maltese
No Vehicles in Household
No Vehicles in Household Comparison
Tlingit-Haida
Maltese
10.1%
NO VEHICLES IN HOUSEHOLD
72.5/ 100
METRIC RATING
153rd/ 347
METRIC RANK
9.1%
NO VEHICLES IN HOUSEHOLD
97.6/ 100
METRIC RATING
109th/ 347
METRIC RANK
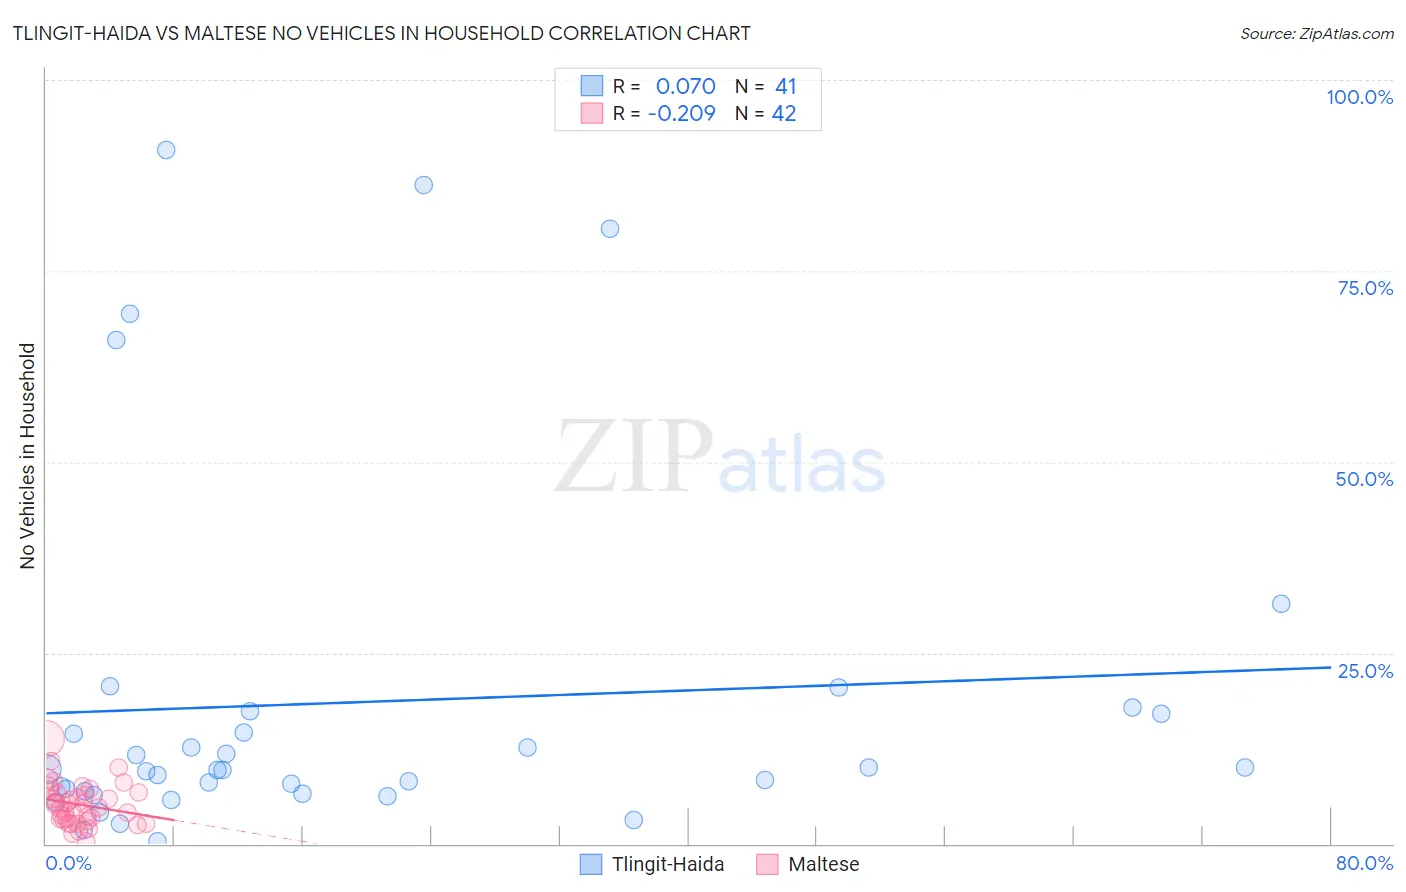
Tlingit-Haida vs Maltese No Vehicles in Household Correlation Chart
The statistical analysis conducted on geographies consisting of 60,779,226 people shows a slight positive correlation between the proportion of Tlingit-Haida and percentage of households with no vehicle available in the United States with a correlation coefficient (R) of 0.070 and weighted average of 10.1%. Similarly, the statistical analysis conducted on geographies consisting of 126,211,459 people shows a weak negative correlation between the proportion of Maltese and percentage of households with no vehicle available in the United States with a correlation coefficient (R) of -0.209 and weighted average of 9.1%, a difference of 10.5%.
No Vehicles in Household Correlation Summary
| Measurement | Tlingit-Haida | Maltese |
| Minimum | 0.39% | 0.26% |
| Maximum | 90.9% | 13.7% |
| Range | 90.5% | 13.5% |
| Mean | 18.5% | 5.1% |
| Median | 9.7% | 5.0% |
| Interquartile 25% (IQ1) | 6.7% | 3.2% |
| Interquartile 75% (IQ3) | 17.2% | 6.8% |
| Interquartile Range (IQR) | 10.4% | 3.6% |
| Standard Deviation (Sample) | 23.6% | 2.7% |
| Standard Deviation (Population) | 23.4% | 2.7% |
Similar Demographics by No Vehicles in Household
Demographics Similar to Tlingit-Haida by No Vehicles in Household
In terms of no vehicles in household, the demographic groups most similar to Tlingit-Haida are Sioux (10.1%, a difference of 0.020%), Salvadoran (10.1%, a difference of 0.030%), Immigrants from Congo (10.1%, a difference of 0.090%), Immigrants from Eastern Africa (10.0%, a difference of 0.23%), and Colombian (10.0%, a difference of 0.24%).
| Demographics | Rating | Rank | No Vehicles in Household |
| Hungarians | 80.0 /100 | #146 | Excellent 9.9% |
| Immigrants | Nicaragua | 79.8 /100 | #147 | Good 9.9% |
| Immigrants | Bosnia and Herzegovina | 79.1 /100 | #148 | Good 9.9% |
| Immigrants | Uganda | 76.1 /100 | #149 | Good 10.0% |
| Colombians | 73.9 /100 | #150 | Good 10.0% |
| Immigrants | Eastern Africa | 73.8 /100 | #151 | Good 10.0% |
| Immigrants | Congo | 73.0 /100 | #152 | Good 10.1% |
| Tlingit-Haida | 72.5 /100 | #153 | Good 10.1% |
| Sioux | 72.4 /100 | #154 | Good 10.1% |
| Salvadorans | 72.4 /100 | #155 | Good 10.1% |
| Immigrants | Micronesia | 70.9 /100 | #156 | Good 10.1% |
| Australians | 70.6 /100 | #157 | Good 10.1% |
| Spanish American Indians | 70.2 /100 | #158 | Good 10.1% |
| Immigrants | Indonesia | 69.3 /100 | #159 | Good 10.1% |
| Immigrants | Middle Africa | 65.7 /100 | #160 | Good 10.2% |
Demographics Similar to Maltese by No Vehicles in Household
In terms of no vehicles in household, the demographic groups most similar to Maltese are Mexican American Indian (9.1%, a difference of 0.13%), Hispanic or Latino (9.1%, a difference of 0.21%), Laotian (9.1%, a difference of 0.48%), Spanish American (9.1%, a difference of 0.57%), and Delaware (9.2%, a difference of 0.58%).
| Demographics | Rating | Rank | No Vehicles in Household |
| Yugoslavians | 98.3 /100 | #102 | Exceptional 9.0% |
| Seminole | 98.3 /100 | #103 | Exceptional 9.0% |
| Zimbabweans | 98.0 /100 | #104 | Exceptional 9.0% |
| Spanish Americans | 97.9 /100 | #105 | Exceptional 9.1% |
| Laotians | 97.8 /100 | #106 | Exceptional 9.1% |
| Hispanics or Latinos | 97.7 /100 | #107 | Exceptional 9.1% |
| Mexican American Indians | 97.6 /100 | #108 | Exceptional 9.1% |
| Maltese | 97.6 /100 | #109 | Exceptional 9.1% |
| Delaware | 97.2 /100 | #110 | Exceptional 9.2% |
| Immigrants | Kuwait | 95.1 /100 | #111 | Exceptional 9.4% |
| Armenians | 95.0 /100 | #112 | Exceptional 9.4% |
| Immigrants | Netherlands | 94.8 /100 | #113 | Exceptional 9.4% |
| Serbians | 94.3 /100 | #114 | Exceptional 9.4% |
| Navajo | 94.2 /100 | #115 | Exceptional 9.4% |
| Japanese | 94.1 /100 | #116 | Exceptional 9.4% |