Tlingit-Haida vs Vietnamese No Vehicles in Household
COMPARE
Tlingit-Haida
Vietnamese
No Vehicles in Household
No Vehicles in Household Comparison
Tlingit-Haida
Vietnamese
10.1%
NO VEHICLES IN HOUSEHOLD
72.5/ 100
METRIC RATING
153rd/ 347
METRIC RANK
26.2%
NO VEHICLES IN HOUSEHOLD
0.0/ 100
METRIC RATING
336th/ 347
METRIC RANK
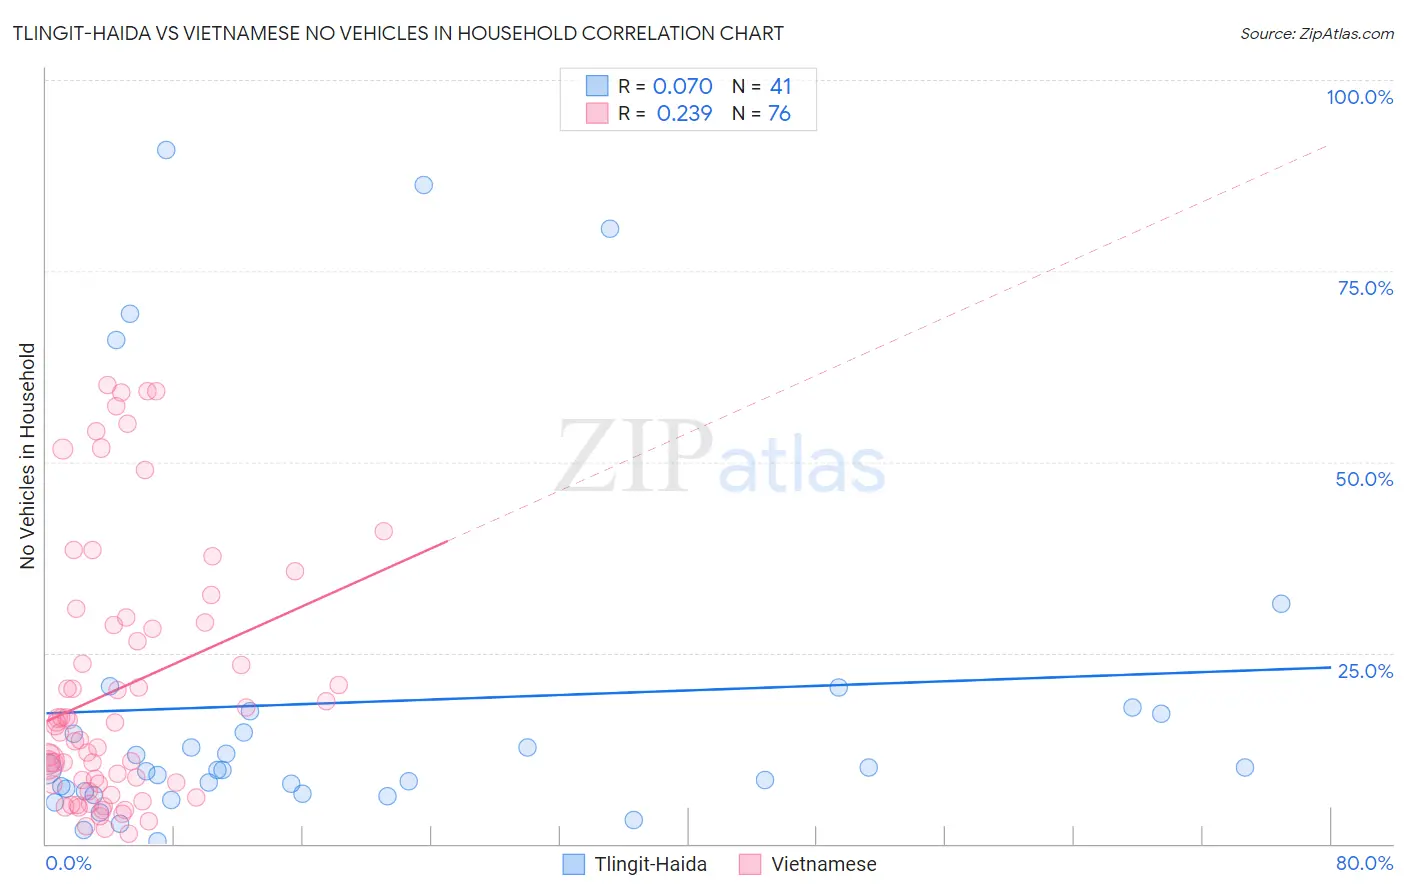
Tlingit-Haida vs Vietnamese No Vehicles in Household Correlation Chart
The statistical analysis conducted on geographies consisting of 60,779,226 people shows a slight positive correlation between the proportion of Tlingit-Haida and percentage of households with no vehicle available in the United States with a correlation coefficient (R) of 0.070 and weighted average of 10.1%. Similarly, the statistical analysis conducted on geographies consisting of 170,596,968 people shows a weak positive correlation between the proportion of Vietnamese and percentage of households with no vehicle available in the United States with a correlation coefficient (R) of 0.239 and weighted average of 26.2%, a difference of 160.7%.
No Vehicles in Household Correlation Summary
| Measurement | Tlingit-Haida | Vietnamese |
| Minimum | 0.39% | 1.2% |
| Maximum | 90.9% | 60.1% |
| Range | 90.5% | 58.8% |
| Mean | 18.5% | 20.3% |
| Median | 9.7% | 15.0% |
| Interquartile 25% (IQ1) | 6.7% | 7.8% |
| Interquartile 75% (IQ3) | 17.2% | 28.8% |
| Interquartile Range (IQR) | 10.4% | 21.0% |
| Standard Deviation (Sample) | 23.6% | 16.9% |
| Standard Deviation (Population) | 23.4% | 16.8% |
Similar Demographics by No Vehicles in Household
Demographics Similar to Tlingit-Haida by No Vehicles in Household
In terms of no vehicles in household, the demographic groups most similar to Tlingit-Haida are Sioux (10.1%, a difference of 0.020%), Salvadoran (10.1%, a difference of 0.030%), Immigrants from Congo (10.1%, a difference of 0.090%), Immigrants from Eastern Africa (10.0%, a difference of 0.23%), and Colombian (10.0%, a difference of 0.24%).
| Demographics | Rating | Rank | No Vehicles in Household |
| Hungarians | 80.0 /100 | #146 | Excellent 9.9% |
| Immigrants | Nicaragua | 79.8 /100 | #147 | Good 9.9% |
| Immigrants | Bosnia and Herzegovina | 79.1 /100 | #148 | Good 9.9% |
| Immigrants | Uganda | 76.1 /100 | #149 | Good 10.0% |
| Colombians | 73.9 /100 | #150 | Good 10.0% |
| Immigrants | Eastern Africa | 73.8 /100 | #151 | Good 10.0% |
| Immigrants | Congo | 73.0 /100 | #152 | Good 10.1% |
| Tlingit-Haida | 72.5 /100 | #153 | Good 10.1% |
| Sioux | 72.4 /100 | #154 | Good 10.1% |
| Salvadorans | 72.4 /100 | #155 | Good 10.1% |
| Immigrants | Micronesia | 70.9 /100 | #156 | Good 10.1% |
| Australians | 70.6 /100 | #157 | Good 10.1% |
| Spanish American Indians | 70.2 /100 | #158 | Good 10.1% |
| Immigrants | Indonesia | 69.3 /100 | #159 | Good 10.1% |
| Immigrants | Middle Africa | 65.7 /100 | #160 | Good 10.2% |
Demographics Similar to Vietnamese by No Vehicles in Household
In terms of no vehicles in household, the demographic groups most similar to Vietnamese are Barbadian (26.1%, a difference of 0.56%), Immigrants from Uzbekistan (26.7%, a difference of 1.7%), Immigrants from Bangladesh (25.8%, a difference of 1.9%), Immigrants from Trinidad and Tobago (24.6%, a difference of 6.5%), and Immigrants from Ecuador (23.8%, a difference of 10.1%).
| Demographics | Rating | Rank | No Vehicles in Household |
| Ecuadorians | 0.0 /100 | #329 | Tragic 22.8% |
| West Indians | 0.0 /100 | #330 | Tragic 23.7% |
| Trinidadians and Tobagonians | 0.0 /100 | #331 | Tragic 23.7% |
| Immigrants | Ecuador | 0.0 /100 | #332 | Tragic 23.8% |
| Immigrants | Trinidad and Tobago | 0.0 /100 | #333 | Tragic 24.6% |
| Immigrants | Bangladesh | 0.0 /100 | #334 | Tragic 25.8% |
| Barbadians | 0.0 /100 | #335 | Tragic 26.1% |
| Vietnamese | 0.0 /100 | #336 | Tragic 26.2% |
| Immigrants | Uzbekistan | 0.0 /100 | #337 | Tragic 26.7% |
| Guyanese | 0.0 /100 | #338 | Tragic 29.3% |
| Dominicans | 0.0 /100 | #339 | Tragic 29.4% |
| Immigrants | Barbados | 0.0 /100 | #340 | Tragic 29.5% |
| Immigrants | Guyana | 0.0 /100 | #341 | Tragic 29.5% |
| British West Indians | 0.0 /100 | #342 | Tragic 29.7% |
| Inupiat | 0.0 /100 | #343 | Tragic 29.9% |