Tlingit-Haida vs Immigrants from Switzerland No Vehicles in Household
COMPARE
Tlingit-Haida
Immigrants from Switzerland
No Vehicles in Household
No Vehicles in Household Comparison
Tlingit-Haida
Immigrants from Switzerland
10.1%
NO VEHICLES IN HOUSEHOLD
72.5/ 100
METRIC RATING
153rd/ 347
METRIC RANK
12.3%
NO VEHICLES IN HOUSEHOLD
0.5/ 100
METRIC RATING
264th/ 347
METRIC RANK
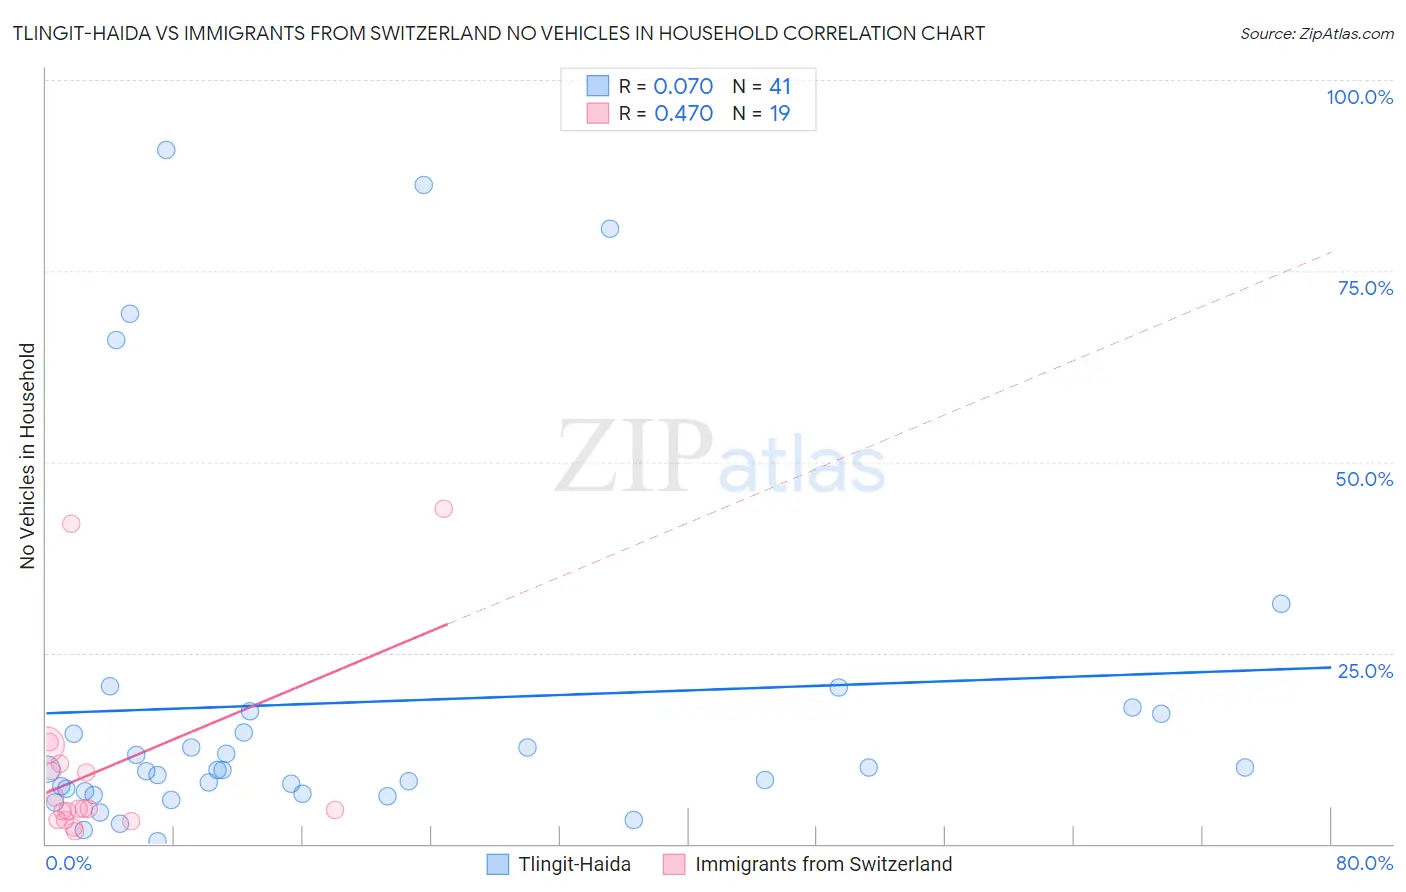
Tlingit-Haida vs Immigrants from Switzerland No Vehicles in Household Correlation Chart
The statistical analysis conducted on geographies consisting of 60,779,226 people shows a slight positive correlation between the proportion of Tlingit-Haida and percentage of households with no vehicle available in the United States with a correlation coefficient (R) of 0.070 and weighted average of 10.1%. Similarly, the statistical analysis conducted on geographies consisting of 147,956,430 people shows a moderate positive correlation between the proportion of Immigrants from Switzerland and percentage of households with no vehicle available in the United States with a correlation coefficient (R) of 0.470 and weighted average of 12.3%, a difference of 22.1%.
No Vehicles in Household Correlation Summary
| Measurement | Tlingit-Haida | Immigrants from Switzerland |
| Minimum | 0.39% | 1.6% |
| Maximum | 90.9% | 43.9% |
| Range | 90.5% | 42.3% |
| Mean | 18.5% | 9.9% |
| Median | 9.7% | 4.6% |
| Interquartile 25% (IQ1) | 6.7% | 3.2% |
| Interquartile 75% (IQ3) | 17.2% | 10.4% |
| Interquartile Range (IQR) | 10.4% | 7.3% |
| Standard Deviation (Sample) | 23.6% | 12.2% |
| Standard Deviation (Population) | 23.4% | 11.8% |
Similar Demographics by No Vehicles in Household
Demographics Similar to Tlingit-Haida by No Vehicles in Household
In terms of no vehicles in household, the demographic groups most similar to Tlingit-Haida are Sioux (10.1%, a difference of 0.020%), Salvadoran (10.1%, a difference of 0.030%), Immigrants from Congo (10.1%, a difference of 0.090%), Immigrants from Eastern Africa (10.0%, a difference of 0.23%), and Colombian (10.0%, a difference of 0.24%).
| Demographics | Rating | Rank | No Vehicles in Household |
| Hungarians | 80.0 /100 | #146 | Excellent 9.9% |
| Immigrants | Nicaragua | 79.8 /100 | #147 | Good 9.9% |
| Immigrants | Bosnia and Herzegovina | 79.1 /100 | #148 | Good 9.9% |
| Immigrants | Uganda | 76.1 /100 | #149 | Good 10.0% |
| Colombians | 73.9 /100 | #150 | Good 10.0% |
| Immigrants | Eastern Africa | 73.8 /100 | #151 | Good 10.0% |
| Immigrants | Congo | 73.0 /100 | #152 | Good 10.1% |
| Tlingit-Haida | 72.5 /100 | #153 | Good 10.1% |
| Sioux | 72.4 /100 | #154 | Good 10.1% |
| Salvadorans | 72.4 /100 | #155 | Good 10.1% |
| Immigrants | Micronesia | 70.9 /100 | #156 | Good 10.1% |
| Australians | 70.6 /100 | #157 | Good 10.1% |
| Spanish American Indians | 70.2 /100 | #158 | Good 10.1% |
| Immigrants | Indonesia | 69.3 /100 | #159 | Good 10.1% |
| Immigrants | Middle Africa | 65.7 /100 | #160 | Good 10.2% |
Demographics Similar to Immigrants from Switzerland by No Vehicles in Household
In terms of no vehicles in household, the demographic groups most similar to Immigrants from Switzerland are African (12.3%, a difference of 0.25%), Immigrants from Egypt (12.2%, a difference of 0.46%), Immigrants from Liberia (12.2%, a difference of 0.61%), Subsaharan African (12.2%, a difference of 0.69%), and Macedonian (12.2%, a difference of 1.1%).
| Demographics | Rating | Rank | No Vehicles in Household |
| Nigerians | 0.9 /100 | #257 | Tragic 12.1% |
| South American Indians | 0.9 /100 | #258 | Tragic 12.1% |
| Immigrants | Latvia | 0.8 /100 | #259 | Tragic 12.1% |
| Macedonians | 0.7 /100 | #260 | Tragic 12.2% |
| Sub-Saharan Africans | 0.6 /100 | #261 | Tragic 12.2% |
| Immigrants | Liberia | 0.6 /100 | #262 | Tragic 12.2% |
| Immigrants | Egypt | 0.6 /100 | #263 | Tragic 12.2% |
| Immigrants | Switzerland | 0.5 /100 | #264 | Tragic 12.3% |
| Africans | 0.4 /100 | #265 | Tragic 12.3% |
| Israelis | 0.3 /100 | #266 | Tragic 12.4% |
| Immigrants | Europe | 0.3 /100 | #267 | Tragic 12.5% |
| Immigrants | Africa | 0.2 /100 | #268 | Tragic 12.5% |
| Panamanians | 0.2 /100 | #269 | Tragic 12.5% |
| Immigrants | Northern Africa | 0.2 /100 | #270 | Tragic 12.6% |
| Immigrants | Morocco | 0.2 /100 | #271 | Tragic 12.6% |