Tlingit-Haida vs Venezuelan No Vehicles in Household
COMPARE
Tlingit-Haida
Venezuelan
No Vehicles in Household
No Vehicles in Household Comparison
Tlingit-Haida
Venezuelans
10.1%
NO VEHICLES IN HOUSEHOLD
72.5/ 100
METRIC RATING
153rd/ 347
METRIC RANK
8.1%
NO VEHICLES IN HOUSEHOLD
99.8/ 100
METRIC RATING
57th/ 347
METRIC RANK
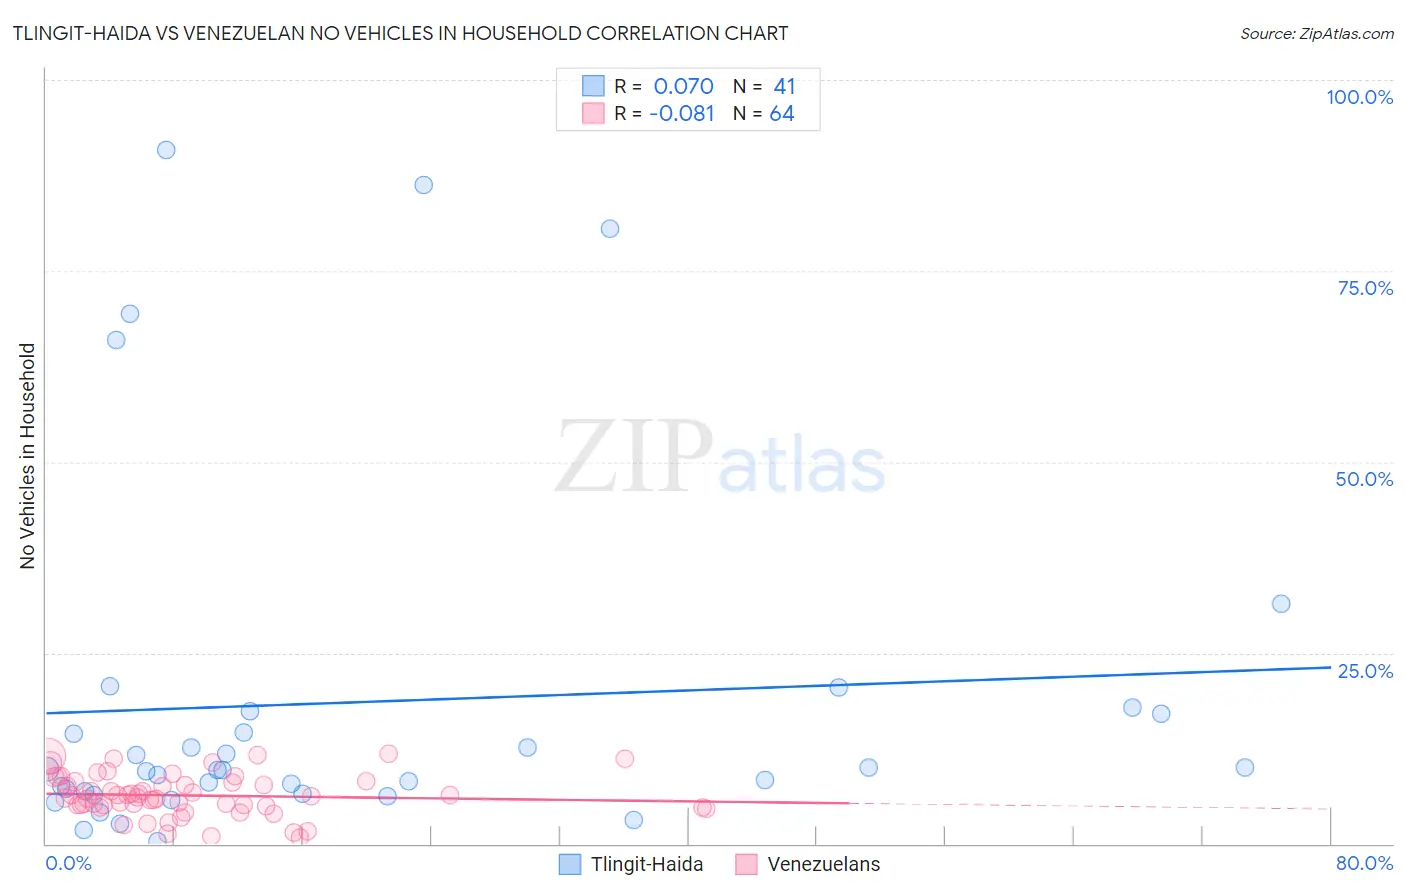
Tlingit-Haida vs Venezuelan No Vehicles in Household Correlation Chart
The statistical analysis conducted on geographies consisting of 60,779,226 people shows a slight positive correlation between the proportion of Tlingit-Haida and percentage of households with no vehicle available in the United States with a correlation coefficient (R) of 0.070 and weighted average of 10.1%. Similarly, the statistical analysis conducted on geographies consisting of 305,806,487 people shows a slight negative correlation between the proportion of Venezuelans and percentage of households with no vehicle available in the United States with a correlation coefficient (R) of -0.081 and weighted average of 8.1%, a difference of 23.8%.
No Vehicles in Household Correlation Summary
| Measurement | Tlingit-Haida | Venezuelan |
| Minimum | 0.39% | 0.90% |
| Maximum | 90.9% | 11.7% |
| Range | 90.5% | 10.8% |
| Mean | 18.5% | 6.3% |
| Median | 9.7% | 6.1% |
| Interquartile 25% (IQ1) | 6.7% | 5.0% |
| Interquartile 75% (IQ3) | 17.2% | 8.1% |
| Interquartile Range (IQR) | 10.4% | 3.1% |
| Standard Deviation (Sample) | 23.6% | 2.7% |
| Standard Deviation (Population) | 23.4% | 2.7% |
Similar Demographics by No Vehicles in Household
Demographics Similar to Tlingit-Haida by No Vehicles in Household
In terms of no vehicles in household, the demographic groups most similar to Tlingit-Haida are Sioux (10.1%, a difference of 0.020%), Salvadoran (10.1%, a difference of 0.030%), Immigrants from Congo (10.1%, a difference of 0.090%), Immigrants from Eastern Africa (10.0%, a difference of 0.23%), and Colombian (10.0%, a difference of 0.24%).
| Demographics | Rating | Rank | No Vehicles in Household |
| Hungarians | 80.0 /100 | #146 | Excellent 9.9% |
| Immigrants | Nicaragua | 79.8 /100 | #147 | Good 9.9% |
| Immigrants | Bosnia and Herzegovina | 79.1 /100 | #148 | Good 9.9% |
| Immigrants | Uganda | 76.1 /100 | #149 | Good 10.0% |
| Colombians | 73.9 /100 | #150 | Good 10.0% |
| Immigrants | Eastern Africa | 73.8 /100 | #151 | Good 10.0% |
| Immigrants | Congo | 73.0 /100 | #152 | Good 10.1% |
| Tlingit-Haida | 72.5 /100 | #153 | Good 10.1% |
| Sioux | 72.4 /100 | #154 | Good 10.1% |
| Salvadorans | 72.4 /100 | #155 | Good 10.1% |
| Immigrants | Micronesia | 70.9 /100 | #156 | Good 10.1% |
| Australians | 70.6 /100 | #157 | Good 10.1% |
| Spanish American Indians | 70.2 /100 | #158 | Good 10.1% |
| Immigrants | Indonesia | 69.3 /100 | #159 | Good 10.1% |
| Immigrants | Middle Africa | 65.7 /100 | #160 | Good 10.2% |
Demographics Similar to Venezuelans by No Vehicles in Household
In terms of no vehicles in household, the demographic groups most similar to Venezuelans are Immigrants from Mexico (8.1%, a difference of 0.11%), Immigrants from Afghanistan (8.1%, a difference of 0.28%), Immigrants from India (8.2%, a difference of 0.46%), Immigrants from Laos (8.2%, a difference of 0.53%), and Celtic (8.1%, a difference of 0.68%).
| Demographics | Rating | Rank | No Vehicles in Household |
| Belgians | 99.9 /100 | #50 | Exceptional 8.0% |
| Koreans | 99.9 /100 | #51 | Exceptional 8.0% |
| Hawaiians | 99.9 /100 | #52 | Exceptional 8.0% |
| Slovenes | 99.9 /100 | #53 | Exceptional 8.0% |
| Immigrants | Venezuela | 99.9 /100 | #54 | Exceptional 8.1% |
| Celtics | 99.9 /100 | #55 | Exceptional 8.1% |
| Immigrants | Afghanistan | 99.9 /100 | #56 | Exceptional 8.1% |
| Venezuelans | 99.8 /100 | #57 | Exceptional 8.1% |
| Immigrants | Mexico | 99.8 /100 | #58 | Exceptional 8.1% |
| Immigrants | India | 99.8 /100 | #59 | Exceptional 8.2% |
| Immigrants | Laos | 99.8 /100 | #60 | Exceptional 8.2% |
| Thais | 99.8 /100 | #61 | Exceptional 8.2% |
| Chinese | 99.8 /100 | #62 | Exceptional 8.2% |
| Slovaks | 99.8 /100 | #63 | Exceptional 8.3% |
| Croatians | 99.8 /100 | #64 | Exceptional 8.3% |