Indian (Asian) vs Basque No Vehicles in Household
COMPARE
Indian (Asian)
Basque
No Vehicles in Household
No Vehicles in Household Comparison
Indians (Asian)
Basques
14.1%
NO VEHICLES IN HOUSEHOLD
0.0/ 100
METRIC RATING
290th/ 347
METRIC RANK
7.8%
NO VEHICLES IN HOUSEHOLD
99.9/ 100
METRIC RATING
37th/ 347
METRIC RANK
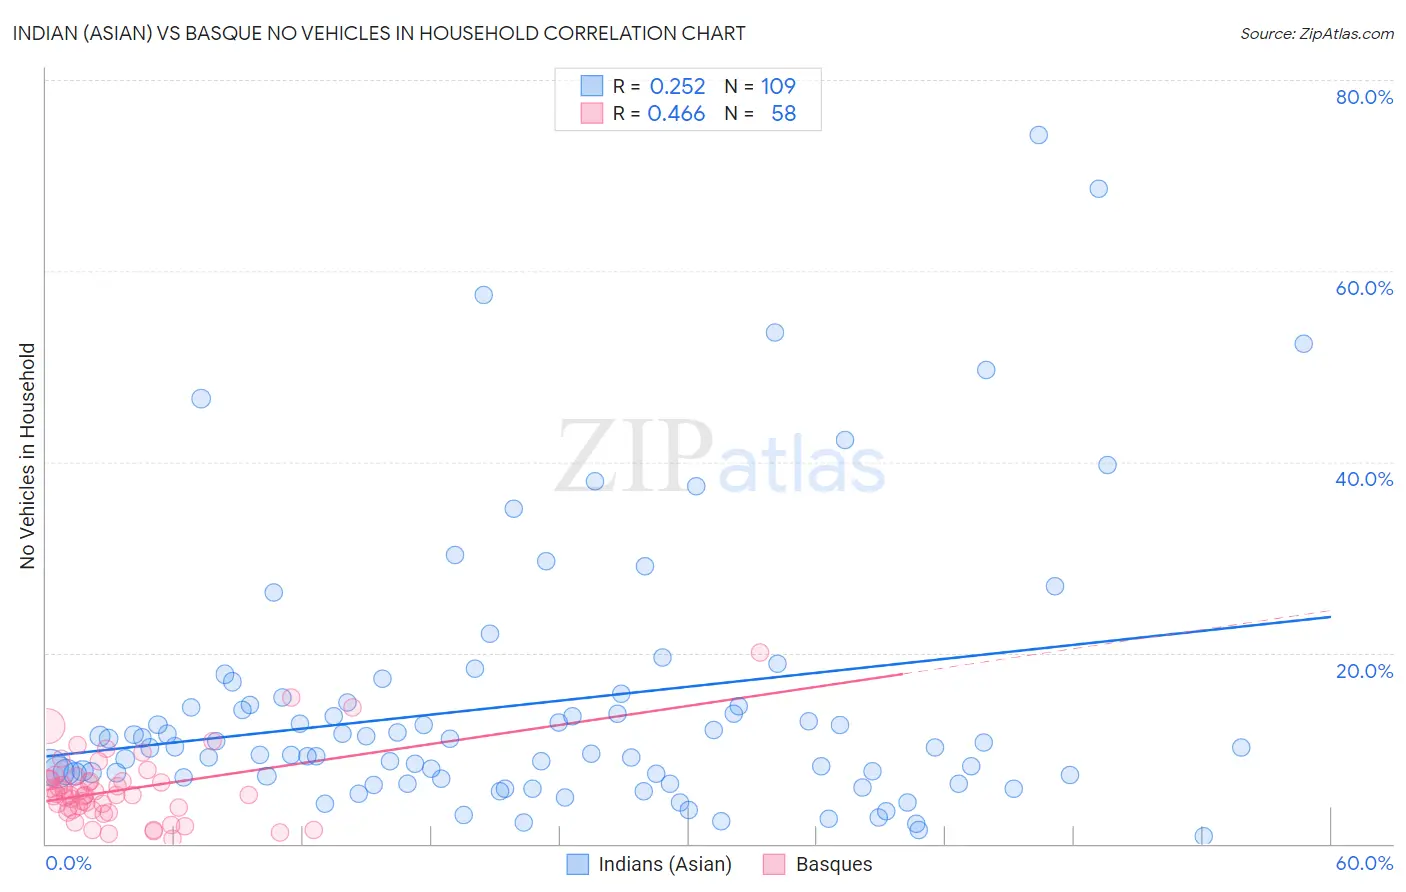
Indian (Asian) vs Basque No Vehicles in Household Correlation Chart
The statistical analysis conducted on geographies consisting of 492,881,185 people shows a weak positive correlation between the proportion of Indians (Asian) and percentage of households with no vehicle available in the United States with a correlation coefficient (R) of 0.252 and weighted average of 14.1%. Similarly, the statistical analysis conducted on geographies consisting of 165,489,078 people shows a moderate positive correlation between the proportion of Basques and percentage of households with no vehicle available in the United States with a correlation coefficient (R) of 0.466 and weighted average of 7.8%, a difference of 81.0%.
No Vehicles in Household Correlation Summary
| Measurement | Indian (Asian) | Basque |
| Minimum | 0.81% | 0.51% |
| Maximum | 74.2% | 20.0% |
| Range | 73.4% | 19.5% |
| Mean | 14.7% | 5.7% |
| Median | 10.1% | 5.1% |
| Interquartile 25% (IQ1) | 7.0% | 3.6% |
| Interquartile 75% (IQ3) | 14.7% | 6.7% |
| Interquartile Range (IQR) | 7.7% | 3.1% |
| Standard Deviation (Sample) | 14.2% | 3.7% |
| Standard Deviation (Population) | 14.1% | 3.6% |
Similar Demographics by No Vehicles in Household
Demographics Similar to Indians (Asian) by No Vehicles in Household
In terms of no vehicles in household, the demographic groups most similar to Indians (Asian) are Okinawan (14.1%, a difference of 0.0%), Pima (14.1%, a difference of 0.49%), Immigrants from Jamaica (14.2%, a difference of 1.1%), Immigrants from Australia (13.8%, a difference of 1.7%), and Belizean (14.3%, a difference of 1.9%).
| Demographics | Rating | Rank | No Vehicles in Household |
| Immigrants | Kazakhstan | 0.0 /100 | #283 | Tragic 13.6% |
| Immigrants | Malaysia | 0.0 /100 | #284 | Tragic 13.6% |
| Immigrants | Eastern Europe | 0.0 /100 | #285 | Tragic 13.6% |
| Colville | 0.0 /100 | #286 | Tragic 13.7% |
| Immigrants | Ireland | 0.0 /100 | #287 | Tragic 13.7% |
| Hopi | 0.0 /100 | #288 | Tragic 13.7% |
| Immigrants | Australia | 0.0 /100 | #289 | Tragic 13.8% |
| Indians (Asian) | 0.0 /100 | #290 | Tragic 14.1% |
| Okinawans | 0.0 /100 | #291 | Tragic 14.1% |
| Pima | 0.0 /100 | #292 | Tragic 14.1% |
| Immigrants | Jamaica | 0.0 /100 | #293 | Tragic 14.2% |
| Belizeans | 0.0 /100 | #294 | Tragic 14.3% |
| Paraguayans | 0.0 /100 | #295 | Tragic 14.4% |
| Immigrants | Spain | 0.0 /100 | #296 | Tragic 14.5% |
| Immigrants | Panama | 0.0 /100 | #297 | Tragic 14.6% |
Demographics Similar to Basques by No Vehicles in Household
In terms of no vehicles in household, the demographic groups most similar to Basques are Creek (7.8%, a difference of 0.14%), Iraqi (7.7%, a difference of 0.25%), Cherokee (7.7%, a difference of 0.39%), Immigrants from Vietnam (7.7%, a difference of 0.53%), and Immigrants from Taiwan (7.7%, a difference of 0.66%).
| Demographics | Rating | Rank | No Vehicles in Household |
| Finns | 100.0 /100 | #30 | Exceptional 7.7% |
| Native Hawaiians | 100.0 /100 | #31 | Exceptional 7.7% |
| Malaysians | 100.0 /100 | #32 | Exceptional 7.7% |
| Immigrants | Taiwan | 100.0 /100 | #33 | Exceptional 7.7% |
| Immigrants | Vietnam | 100.0 /100 | #34 | Exceptional 7.7% |
| Cherokee | 99.9 /100 | #35 | Exceptional 7.7% |
| Iraqis | 99.9 /100 | #36 | Exceptional 7.7% |
| Basques | 99.9 /100 | #37 | Exceptional 7.8% |
| Creek | 99.9 /100 | #38 | Exceptional 7.8% |
| Immigrants | Fiji | 99.9 /100 | #39 | Exceptional 7.8% |
| Czechoslovakians | 99.9 /100 | #40 | Exceptional 7.8% |
| French Canadians | 99.9 /100 | #41 | Exceptional 7.8% |
| Swiss | 99.9 /100 | #42 | Exceptional 7.9% |
| Chickasaw | 99.9 /100 | #43 | Exceptional 7.9% |
| Choctaw | 99.9 /100 | #44 | Exceptional 7.9% |