Tlingit-Haida vs Uruguayan No Vehicles in Household
COMPARE
Tlingit-Haida
Uruguayan
No Vehicles in Household
No Vehicles in Household Comparison
Tlingit-Haida
Uruguayans
10.1%
NO VEHICLES IN HOUSEHOLD
72.5/ 100
METRIC RATING
153rd/ 347
METRIC RANK
11.3%
NO VEHICLES IN HOUSEHOLD
7.7/ 100
METRIC RATING
223rd/ 347
METRIC RANK
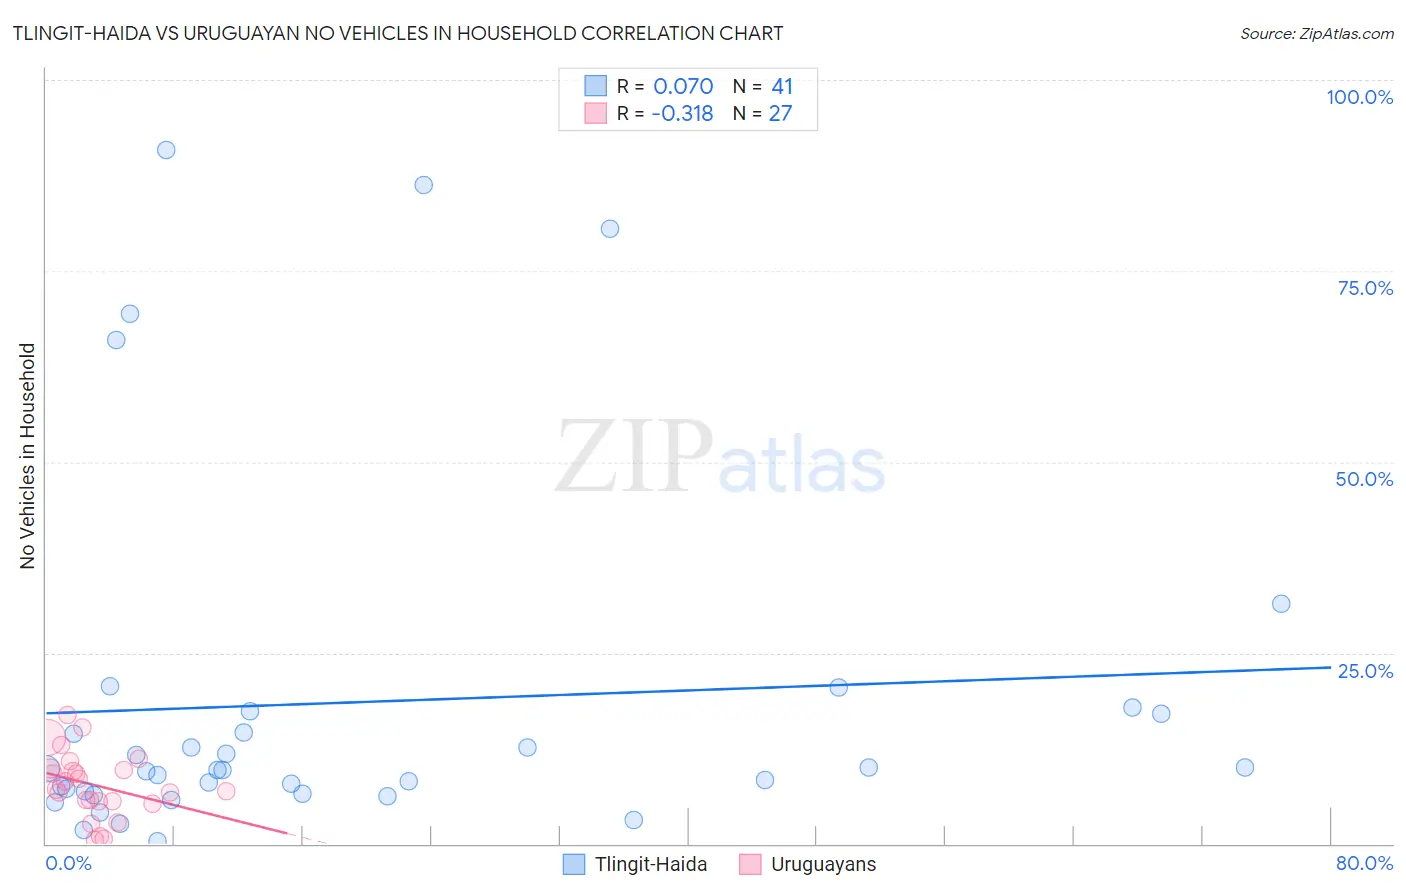
Tlingit-Haida vs Uruguayan No Vehicles in Household Correlation Chart
The statistical analysis conducted on geographies consisting of 60,779,226 people shows a slight positive correlation between the proportion of Tlingit-Haida and percentage of households with no vehicle available in the United States with a correlation coefficient (R) of 0.070 and weighted average of 10.1%. Similarly, the statistical analysis conducted on geographies consisting of 144,673,371 people shows a mild negative correlation between the proportion of Uruguayans and percentage of households with no vehicle available in the United States with a correlation coefficient (R) of -0.318 and weighted average of 11.3%, a difference of 12.1%.
No Vehicles in Household Correlation Summary
| Measurement | Tlingit-Haida | Uruguayan |
| Minimum | 0.39% | 0.52% |
| Maximum | 90.9% | 16.9% |
| Range | 90.5% | 16.4% |
| Mean | 18.5% | 7.7% |
| Median | 9.7% | 7.1% |
| Interquartile 25% (IQ1) | 6.7% | 5.6% |
| Interquartile 75% (IQ3) | 17.2% | 9.9% |
| Interquartile Range (IQR) | 10.4% | 4.3% |
| Standard Deviation (Sample) | 23.6% | 4.2% |
| Standard Deviation (Population) | 23.4% | 4.2% |
Similar Demographics by No Vehicles in Household
Demographics Similar to Tlingit-Haida by No Vehicles in Household
In terms of no vehicles in household, the demographic groups most similar to Tlingit-Haida are Sioux (10.1%, a difference of 0.020%), Salvadoran (10.1%, a difference of 0.030%), Immigrants from Congo (10.1%, a difference of 0.090%), Immigrants from Eastern Africa (10.0%, a difference of 0.23%), and Colombian (10.0%, a difference of 0.24%).
| Demographics | Rating | Rank | No Vehicles in Household |
| Hungarians | 80.0 /100 | #146 | Excellent 9.9% |
| Immigrants | Nicaragua | 79.8 /100 | #147 | Good 9.9% |
| Immigrants | Bosnia and Herzegovina | 79.1 /100 | #148 | Good 9.9% |
| Immigrants | Uganda | 76.1 /100 | #149 | Good 10.0% |
| Colombians | 73.9 /100 | #150 | Good 10.0% |
| Immigrants | Eastern Africa | 73.8 /100 | #151 | Good 10.0% |
| Immigrants | Congo | 73.0 /100 | #152 | Good 10.1% |
| Tlingit-Haida | 72.5 /100 | #153 | Good 10.1% |
| Sioux | 72.4 /100 | #154 | Good 10.1% |
| Salvadorans | 72.4 /100 | #155 | Good 10.1% |
| Immigrants | Micronesia | 70.9 /100 | #156 | Good 10.1% |
| Australians | 70.6 /100 | #157 | Good 10.1% |
| Spanish American Indians | 70.2 /100 | #158 | Good 10.1% |
| Immigrants | Indonesia | 69.3 /100 | #159 | Good 10.1% |
| Immigrants | Middle Africa | 65.7 /100 | #160 | Good 10.2% |
Demographics Similar to Uruguayans by No Vehicles in Household
In terms of no vehicles in household, the demographic groups most similar to Uruguayans are Immigrants from South America (11.3%, a difference of 0.16%), Immigrants from Hong Kong (11.3%, a difference of 0.22%), Peruvian (11.2%, a difference of 0.30%), Immigrants from Sierra Leone (11.3%, a difference of 0.59%), and Immigrants from Zaire (11.2%, a difference of 0.75%).
| Demographics | Rating | Rank | No Vehicles in Household |
| Immigrants | Argentina | 10.6 /100 | #216 | Poor 11.2% |
| Dutch West Indians | 10.2 /100 | #217 | Poor 11.2% |
| Immigrants | Guatemala | 10.0 /100 | #218 | Tragic 11.2% |
| Argentineans | 9.6 /100 | #219 | Tragic 11.2% |
| Immigrants | Zaire | 9.6 /100 | #220 | Tragic 11.2% |
| Peruvians | 8.4 /100 | #221 | Tragic 11.2% |
| Immigrants | South America | 8.0 /100 | #222 | Tragic 11.3% |
| Uruguayans | 7.7 /100 | #223 | Tragic 11.3% |
| Immigrants | Hong Kong | 7.2 /100 | #224 | Tragic 11.3% |
| Immigrants | Sierra Leone | 6.4 /100 | #225 | Tragic 11.3% |
| Immigrants | Somalia | 5.4 /100 | #226 | Tragic 11.4% |
| Immigrants | Pakistan | 5.4 /100 | #227 | Tragic 11.4% |
| Immigrants | Romania | 5.3 /100 | #228 | Tragic 11.4% |
| Ugandans | 5.3 /100 | #229 | Tragic 11.4% |
| Immigrants | Norway | 5.1 /100 | #230 | Tragic 11.4% |