Tlingit-Haida vs Immigrants from Ireland No Vehicles in Household
COMPARE
Tlingit-Haida
Immigrants from Ireland
No Vehicles in Household
No Vehicles in Household Comparison
Tlingit-Haida
Immigrants from Ireland
10.1%
NO VEHICLES IN HOUSEHOLD
72.5/ 100
METRIC RATING
153rd/ 347
METRIC RANK
13.7%
NO VEHICLES IN HOUSEHOLD
0.0/ 100
METRIC RATING
287th/ 347
METRIC RANK
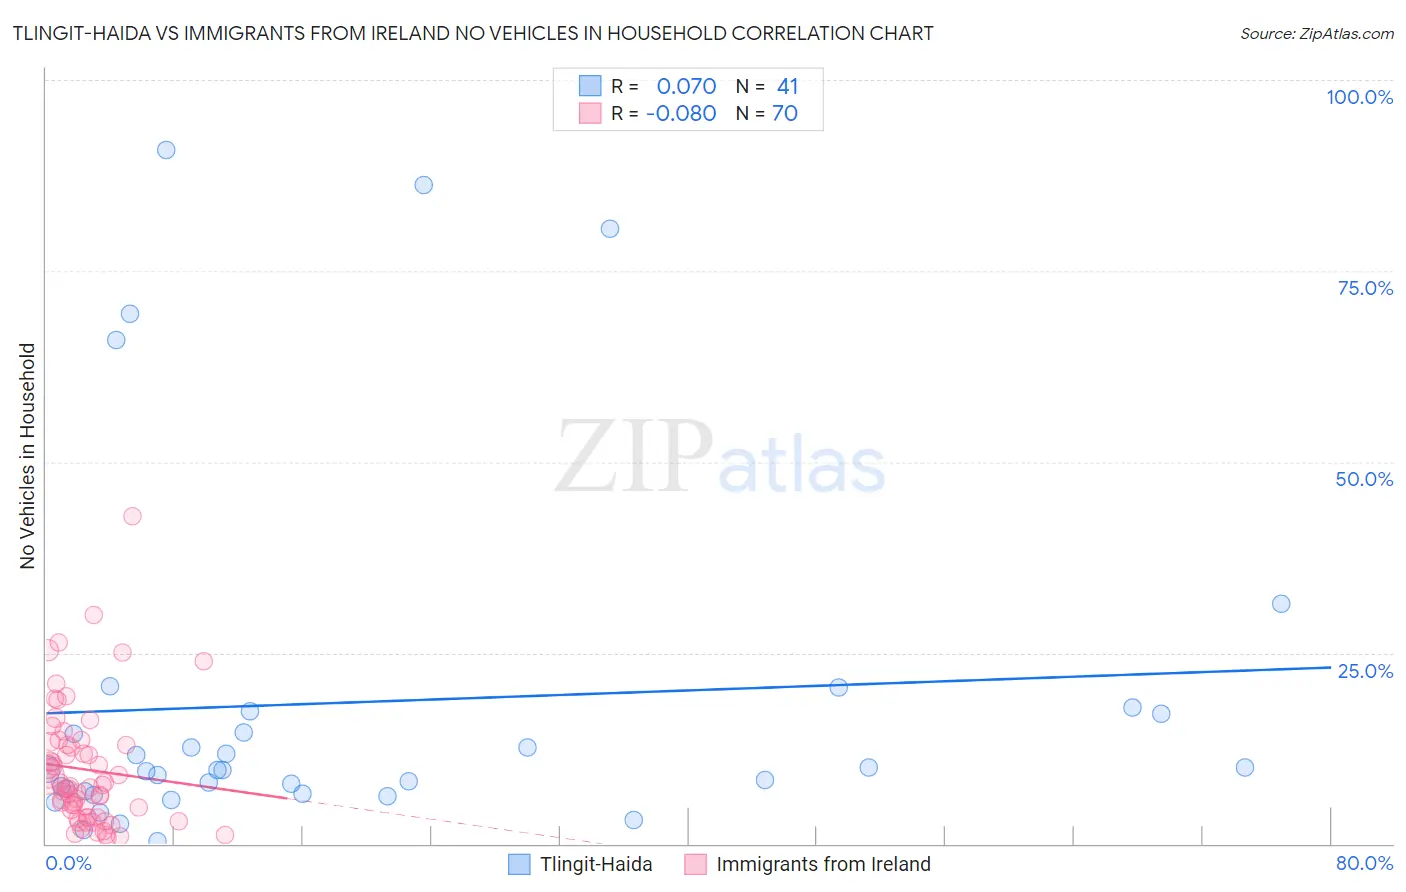
Tlingit-Haida vs Immigrants from Ireland No Vehicles in Household Correlation Chart
The statistical analysis conducted on geographies consisting of 60,779,226 people shows a slight positive correlation between the proportion of Tlingit-Haida and percentage of households with no vehicle available in the United States with a correlation coefficient (R) of 0.070 and weighted average of 10.1%. Similarly, the statistical analysis conducted on geographies consisting of 240,526,628 people shows a slight negative correlation between the proportion of Immigrants from Ireland and percentage of households with no vehicle available in the United States with a correlation coefficient (R) of -0.080 and weighted average of 13.7%, a difference of 36.3%.
No Vehicles in Household Correlation Summary
| Measurement | Tlingit-Haida | Immigrants from Ireland |
| Minimum | 0.39% | 0.75% |
| Maximum | 90.9% | 42.9% |
| Range | 90.5% | 42.1% |
| Mean | 18.5% | 9.7% |
| Median | 9.7% | 7.5% |
| Interquartile 25% (IQ1) | 6.7% | 3.5% |
| Interquartile 75% (IQ3) | 17.2% | 13.0% |
| Interquartile Range (IQR) | 10.4% | 9.5% |
| Standard Deviation (Sample) | 23.6% | 8.0% |
| Standard Deviation (Population) | 23.4% | 7.9% |
Similar Demographics by No Vehicles in Household
Demographics Similar to Tlingit-Haida by No Vehicles in Household
In terms of no vehicles in household, the demographic groups most similar to Tlingit-Haida are Sioux (10.1%, a difference of 0.020%), Salvadoran (10.1%, a difference of 0.030%), Immigrants from Congo (10.1%, a difference of 0.090%), Immigrants from Eastern Africa (10.0%, a difference of 0.23%), and Colombian (10.0%, a difference of 0.24%).
| Demographics | Rating | Rank | No Vehicles in Household |
| Hungarians | 80.0 /100 | #146 | Excellent 9.9% |
| Immigrants | Nicaragua | 79.8 /100 | #147 | Good 9.9% |
| Immigrants | Bosnia and Herzegovina | 79.1 /100 | #148 | Good 9.9% |
| Immigrants | Uganda | 76.1 /100 | #149 | Good 10.0% |
| Colombians | 73.9 /100 | #150 | Good 10.0% |
| Immigrants | Eastern Africa | 73.8 /100 | #151 | Good 10.0% |
| Immigrants | Congo | 73.0 /100 | #152 | Good 10.1% |
| Tlingit-Haida | 72.5 /100 | #153 | Good 10.1% |
| Sioux | 72.4 /100 | #154 | Good 10.1% |
| Salvadorans | 72.4 /100 | #155 | Good 10.1% |
| Immigrants | Micronesia | 70.9 /100 | #156 | Good 10.1% |
| Australians | 70.6 /100 | #157 | Good 10.1% |
| Spanish American Indians | 70.2 /100 | #158 | Good 10.1% |
| Immigrants | Indonesia | 69.3 /100 | #159 | Good 10.1% |
| Immigrants | Middle Africa | 65.7 /100 | #160 | Good 10.2% |
Demographics Similar to Immigrants from Ireland by No Vehicles in Household
In terms of no vehicles in household, the demographic groups most similar to Immigrants from Ireland are Hopi (13.7%, a difference of 0.13%), Colville (13.7%, a difference of 0.21%), Immigrants from Australia (13.8%, a difference of 0.80%), Immigrants from Eastern Europe (13.6%, a difference of 0.87%), and Immigrants from Malaysia (13.6%, a difference of 0.92%).
| Demographics | Rating | Rank | No Vehicles in Household |
| Alsatians | 0.0 /100 | #280 | Tragic 13.2% |
| Central American Indians | 0.0 /100 | #281 | Tragic 13.3% |
| Immigrants | Eastern Asia | 0.0 /100 | #282 | Tragic 13.5% |
| Immigrants | Kazakhstan | 0.0 /100 | #283 | Tragic 13.6% |
| Immigrants | Malaysia | 0.0 /100 | #284 | Tragic 13.6% |
| Immigrants | Eastern Europe | 0.0 /100 | #285 | Tragic 13.6% |
| Colville | 0.0 /100 | #286 | Tragic 13.7% |
| Immigrants | Ireland | 0.0 /100 | #287 | Tragic 13.7% |
| Hopi | 0.0 /100 | #288 | Tragic 13.7% |
| Immigrants | Australia | 0.0 /100 | #289 | Tragic 13.8% |
| Indians (Asian) | 0.0 /100 | #290 | Tragic 14.1% |
| Okinawans | 0.0 /100 | #291 | Tragic 14.1% |
| Pima | 0.0 /100 | #292 | Tragic 14.1% |
| Immigrants | Jamaica | 0.0 /100 | #293 | Tragic 14.2% |
| Belizeans | 0.0 /100 | #294 | Tragic 14.3% |