Immigrants from Romania vs Basque No Vehicles in Household
COMPARE
Immigrants from Romania
Basque
No Vehicles in Household
No Vehicles in Household Comparison
Immigrants from Romania
Basques
11.4%
NO VEHICLES IN HOUSEHOLD
5.3/ 100
METRIC RATING
228th/ 347
METRIC RANK
7.8%
NO VEHICLES IN HOUSEHOLD
99.9/ 100
METRIC RATING
37th/ 347
METRIC RANK
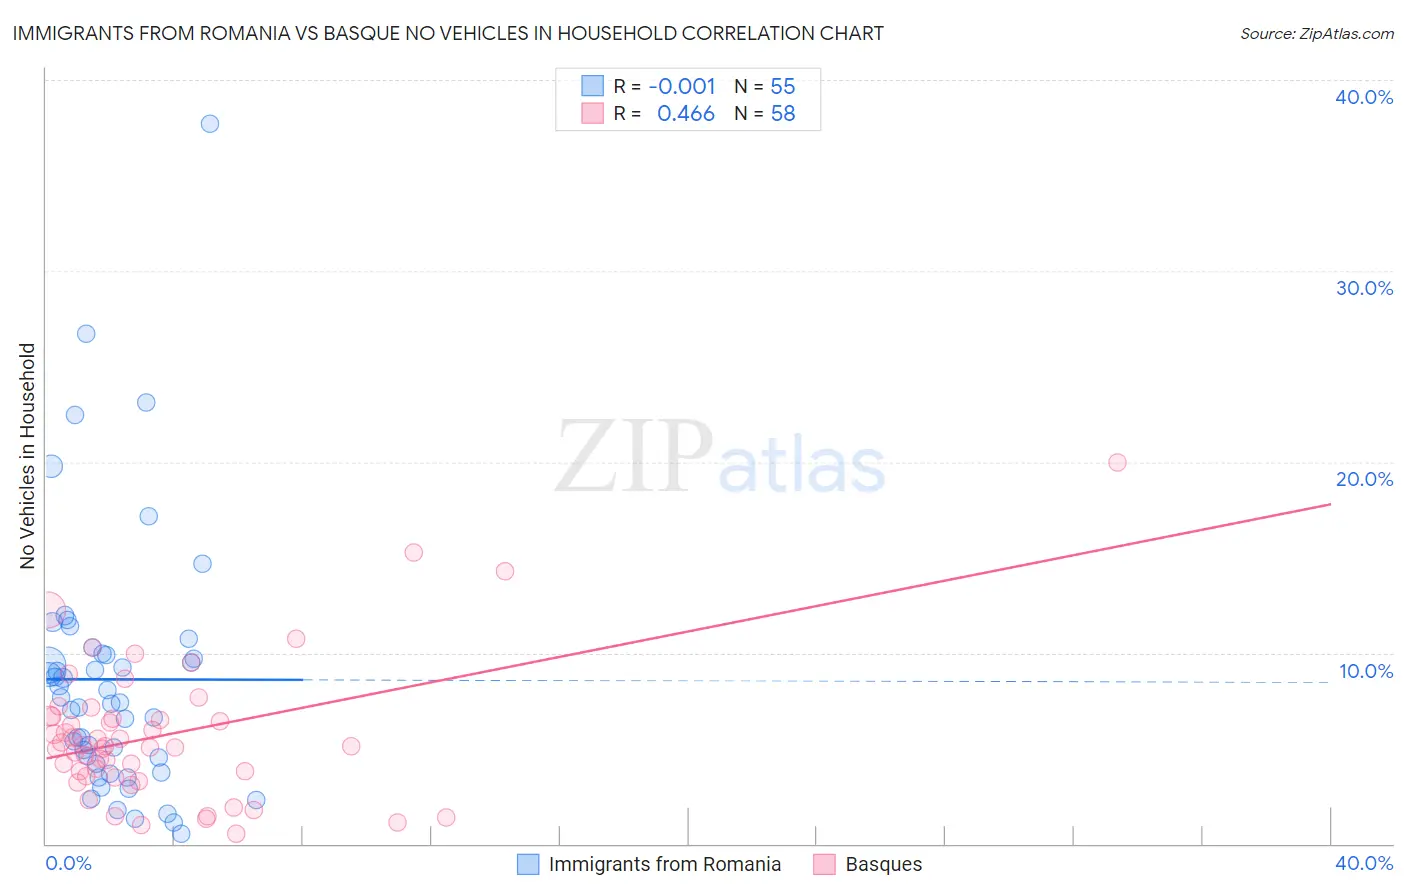
Immigrants from Romania vs Basque No Vehicles in Household Correlation Chart
The statistical analysis conducted on geographies consisting of 256,713,633 people shows no correlation between the proportion of Immigrants from Romania and percentage of households with no vehicle available in the United States with a correlation coefficient (R) of -0.001 and weighted average of 11.4%. Similarly, the statistical analysis conducted on geographies consisting of 165,489,078 people shows a moderate positive correlation between the proportion of Basques and percentage of households with no vehicle available in the United States with a correlation coefficient (R) of 0.466 and weighted average of 7.8%, a difference of 47.0%.
No Vehicles in Household Correlation Summary
| Measurement | Immigrants from Romania | Basque |
| Minimum | 0.55% | 0.51% |
| Maximum | 37.7% | 20.0% |
| Range | 37.2% | 19.5% |
| Mean | 8.6% | 5.7% |
| Median | 7.4% | 5.1% |
| Interquartile 25% (IQ1) | 4.2% | 3.6% |
| Interquartile 75% (IQ3) | 9.9% | 6.7% |
| Interquartile Range (IQR) | 5.8% | 3.1% |
| Standard Deviation (Sample) | 6.8% | 3.7% |
| Standard Deviation (Population) | 6.8% | 3.6% |
Similar Demographics by No Vehicles in Household
Demographics Similar to Immigrants from Romania by No Vehicles in Household
In terms of no vehicles in household, the demographic groups most similar to Immigrants from Romania are Immigrants from Pakistan (11.4%, a difference of 0.040%), Ugandan (11.4%, a difference of 0.040%), Immigrants from Somalia (11.4%, a difference of 0.060%), Immigrants from Norway (11.4%, a difference of 0.16%), and Immigrants from Japan (11.4%, a difference of 0.17%).
| Demographics | Rating | Rank | No Vehicles in Household |
| Peruvians | 8.4 /100 | #221 | Tragic 11.2% |
| Immigrants | South America | 8.0 /100 | #222 | Tragic 11.3% |
| Uruguayans | 7.7 /100 | #223 | Tragic 11.3% |
| Immigrants | Hong Kong | 7.2 /100 | #224 | Tragic 11.3% |
| Immigrants | Sierra Leone | 6.4 /100 | #225 | Tragic 11.3% |
| Immigrants | Somalia | 5.4 /100 | #226 | Tragic 11.4% |
| Immigrants | Pakistan | 5.4 /100 | #227 | Tragic 11.4% |
| Immigrants | Romania | 5.3 /100 | #228 | Tragic 11.4% |
| Ugandans | 5.3 /100 | #229 | Tragic 11.4% |
| Immigrants | Norway | 5.1 /100 | #230 | Tragic 11.4% |
| Immigrants | Japan | 5.1 /100 | #231 | Tragic 11.4% |
| Immigrants | Turkey | 4.8 /100 | #232 | Tragic 11.5% |
| Houma | 4.7 /100 | #233 | Tragic 11.5% |
| Immigrants | Peru | 4.5 /100 | #234 | Tragic 11.5% |
| Kiowa | 4.0 /100 | #235 | Tragic 11.5% |
Demographics Similar to Basques by No Vehicles in Household
In terms of no vehicles in household, the demographic groups most similar to Basques are Creek (7.8%, a difference of 0.14%), Iraqi (7.7%, a difference of 0.25%), Cherokee (7.7%, a difference of 0.39%), Immigrants from Vietnam (7.7%, a difference of 0.53%), and Immigrants from Taiwan (7.7%, a difference of 0.66%).
| Demographics | Rating | Rank | No Vehicles in Household |
| Finns | 100.0 /100 | #30 | Exceptional 7.7% |
| Native Hawaiians | 100.0 /100 | #31 | Exceptional 7.7% |
| Malaysians | 100.0 /100 | #32 | Exceptional 7.7% |
| Immigrants | Taiwan | 100.0 /100 | #33 | Exceptional 7.7% |
| Immigrants | Vietnam | 100.0 /100 | #34 | Exceptional 7.7% |
| Cherokee | 99.9 /100 | #35 | Exceptional 7.7% |
| Iraqis | 99.9 /100 | #36 | Exceptional 7.7% |
| Basques | 99.9 /100 | #37 | Exceptional 7.8% |
| Creek | 99.9 /100 | #38 | Exceptional 7.8% |
| Immigrants | Fiji | 99.9 /100 | #39 | Exceptional 7.8% |
| Czechoslovakians | 99.9 /100 | #40 | Exceptional 7.8% |
| French Canadians | 99.9 /100 | #41 | Exceptional 7.8% |
| Swiss | 99.9 /100 | #42 | Exceptional 7.9% |
| Chickasaw | 99.9 /100 | #43 | Exceptional 7.9% |
| Choctaw | 99.9 /100 | #44 | Exceptional 7.9% |