Inupiat vs Basque No Vehicles in Household
COMPARE
Inupiat
Basque
No Vehicles in Household
No Vehicles in Household Comparison
Inupiat
Basques
29.9%
NO VEHICLES IN HOUSEHOLD
0.0/ 100
METRIC RATING
343rd/ 347
METRIC RANK
7.8%
NO VEHICLES IN HOUSEHOLD
99.9/ 100
METRIC RATING
37th/ 347
METRIC RANK
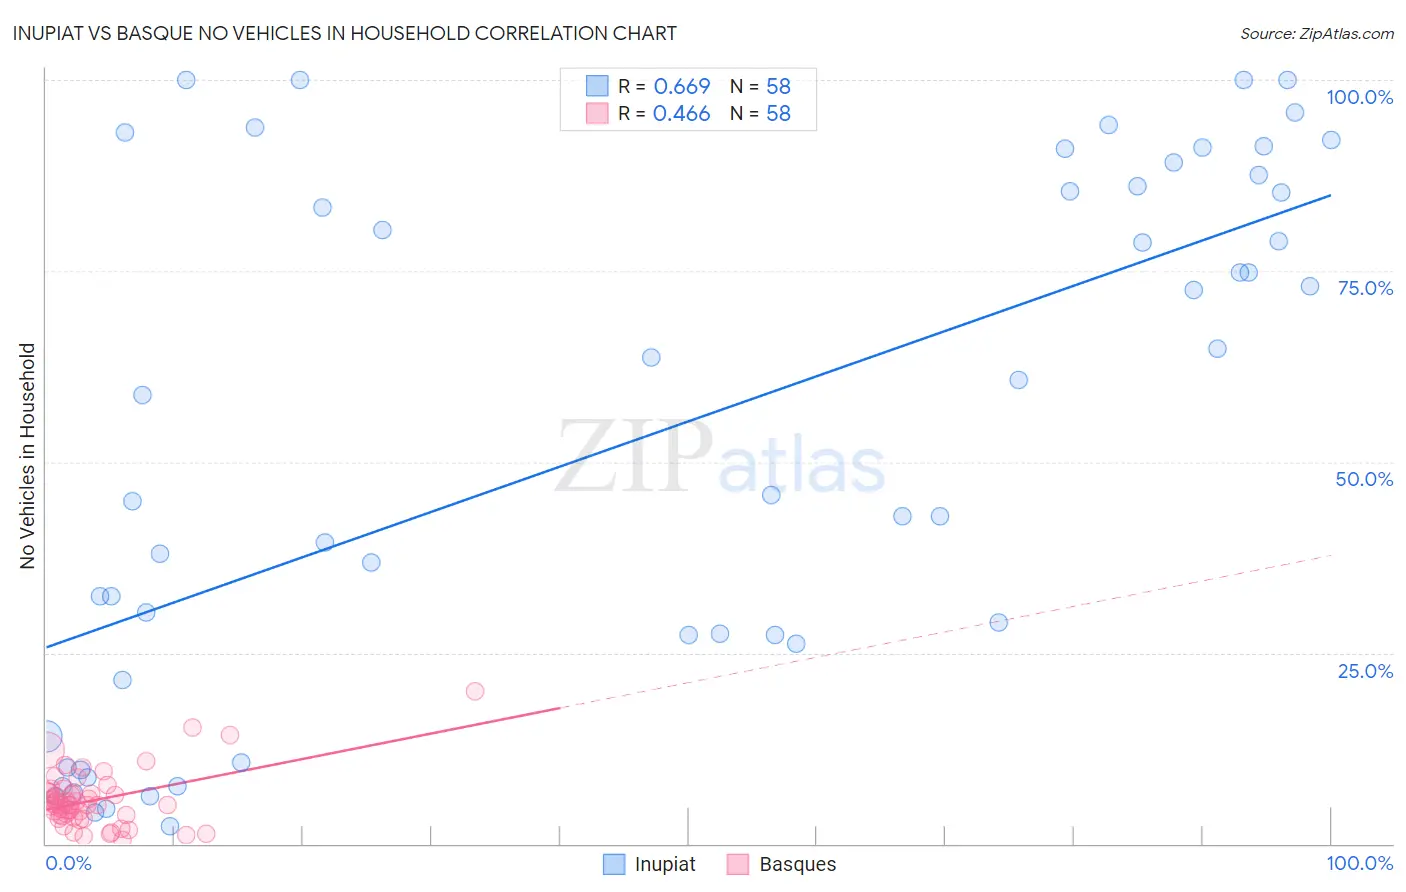
Inupiat vs Basque No Vehicles in Household Correlation Chart
The statistical analysis conducted on geographies consisting of 96,243,666 people shows a significant positive correlation between the proportion of Inupiat and percentage of households with no vehicle available in the United States with a correlation coefficient (R) of 0.669 and weighted average of 29.9%. Similarly, the statistical analysis conducted on geographies consisting of 165,489,078 people shows a moderate positive correlation between the proportion of Basques and percentage of households with no vehicle available in the United States with a correlation coefficient (R) of 0.466 and weighted average of 7.8%, a difference of 284.5%.
No Vehicles in Household Correlation Summary
| Measurement | Inupiat | Basque |
| Minimum | 2.2% | 0.51% |
| Maximum | 100.0% | 20.0% |
| Range | 97.8% | 19.5% |
| Mean | 53.1% | 5.7% |
| Median | 52.3% | 5.1% |
| Interquartile 25% (IQ1) | 26.2% | 3.6% |
| Interquartile 75% (IQ3) | 86.0% | 6.7% |
| Interquartile Range (IQR) | 59.9% | 3.1% |
| Standard Deviation (Sample) | 34.0% | 3.7% |
| Standard Deviation (Population) | 33.7% | 3.6% |
Similar Demographics by No Vehicles in Household
Demographics Similar to Inupiat by No Vehicles in Household
In terms of no vehicles in household, the demographic groups most similar to Inupiat are British West Indian (29.7%, a difference of 0.41%), Immigrants from Guyana (29.5%, a difference of 1.3%), Immigrants from Barbados (29.5%, a difference of 1.3%), Dominican (29.4%, a difference of 1.5%), and Guyanese (29.3%, a difference of 1.9%).
| Demographics | Rating | Rank | No Vehicles in Household |
| Immigrants | Trinidad and Tobago | 0.0 /100 | #333 | Tragic 24.6% |
| Immigrants | Bangladesh | 0.0 /100 | #334 | Tragic 25.8% |
| Barbadians | 0.0 /100 | #335 | Tragic 26.1% |
| Vietnamese | 0.0 /100 | #336 | Tragic 26.2% |
| Immigrants | Uzbekistan | 0.0 /100 | #337 | Tragic 26.7% |
| Guyanese | 0.0 /100 | #338 | Tragic 29.3% |
| Dominicans | 0.0 /100 | #339 | Tragic 29.4% |
| Immigrants | Barbados | 0.0 /100 | #340 | Tragic 29.5% |
| Immigrants | Guyana | 0.0 /100 | #341 | Tragic 29.5% |
| British West Indians | 0.0 /100 | #342 | Tragic 29.7% |
| Inupiat | 0.0 /100 | #343 | Tragic 29.9% |
| Immigrants | Dominican Republic | 0.0 /100 | #344 | Tragic 31.4% |
| Immigrants | St. Vincent and the Grenadines | 0.0 /100 | #345 | Tragic 35.4% |
| Immigrants | Grenada | 0.0 /100 | #346 | Tragic 37.5% |
| Yup'ik | 0.0 /100 | #347 | Tragic 45.9% |
Demographics Similar to Basques by No Vehicles in Household
In terms of no vehicles in household, the demographic groups most similar to Basques are Creek (7.8%, a difference of 0.14%), Iraqi (7.7%, a difference of 0.25%), Cherokee (7.7%, a difference of 0.39%), Immigrants from Vietnam (7.7%, a difference of 0.53%), and Immigrants from Taiwan (7.7%, a difference of 0.66%).
| Demographics | Rating | Rank | No Vehicles in Household |
| Finns | 100.0 /100 | #30 | Exceptional 7.7% |
| Native Hawaiians | 100.0 /100 | #31 | Exceptional 7.7% |
| Malaysians | 100.0 /100 | #32 | Exceptional 7.7% |
| Immigrants | Taiwan | 100.0 /100 | #33 | Exceptional 7.7% |
| Immigrants | Vietnam | 100.0 /100 | #34 | Exceptional 7.7% |
| Cherokee | 99.9 /100 | #35 | Exceptional 7.7% |
| Iraqis | 99.9 /100 | #36 | Exceptional 7.7% |
| Basques | 99.9 /100 | #37 | Exceptional 7.8% |
| Creek | 99.9 /100 | #38 | Exceptional 7.8% |
| Immigrants | Fiji | 99.9 /100 | #39 | Exceptional 7.8% |
| Czechoslovakians | 99.9 /100 | #40 | Exceptional 7.8% |
| French Canadians | 99.9 /100 | #41 | Exceptional 7.8% |
| Swiss | 99.9 /100 | #42 | Exceptional 7.9% |
| Chickasaw | 99.9 /100 | #43 | Exceptional 7.9% |
| Choctaw | 99.9 /100 | #44 | Exceptional 7.9% |