Austrian vs Basque No Vehicles in Household
COMPARE
Austrian
Basque
No Vehicles in Household
No Vehicles in Household Comparison
Austrians
Basques
8.8%
NO VEHICLES IN HOUSEHOLD
98.9/ 100
METRIC RATING
94th/ 347
METRIC RANK
7.8%
NO VEHICLES IN HOUSEHOLD
99.9/ 100
METRIC RATING
37th/ 347
METRIC RANK
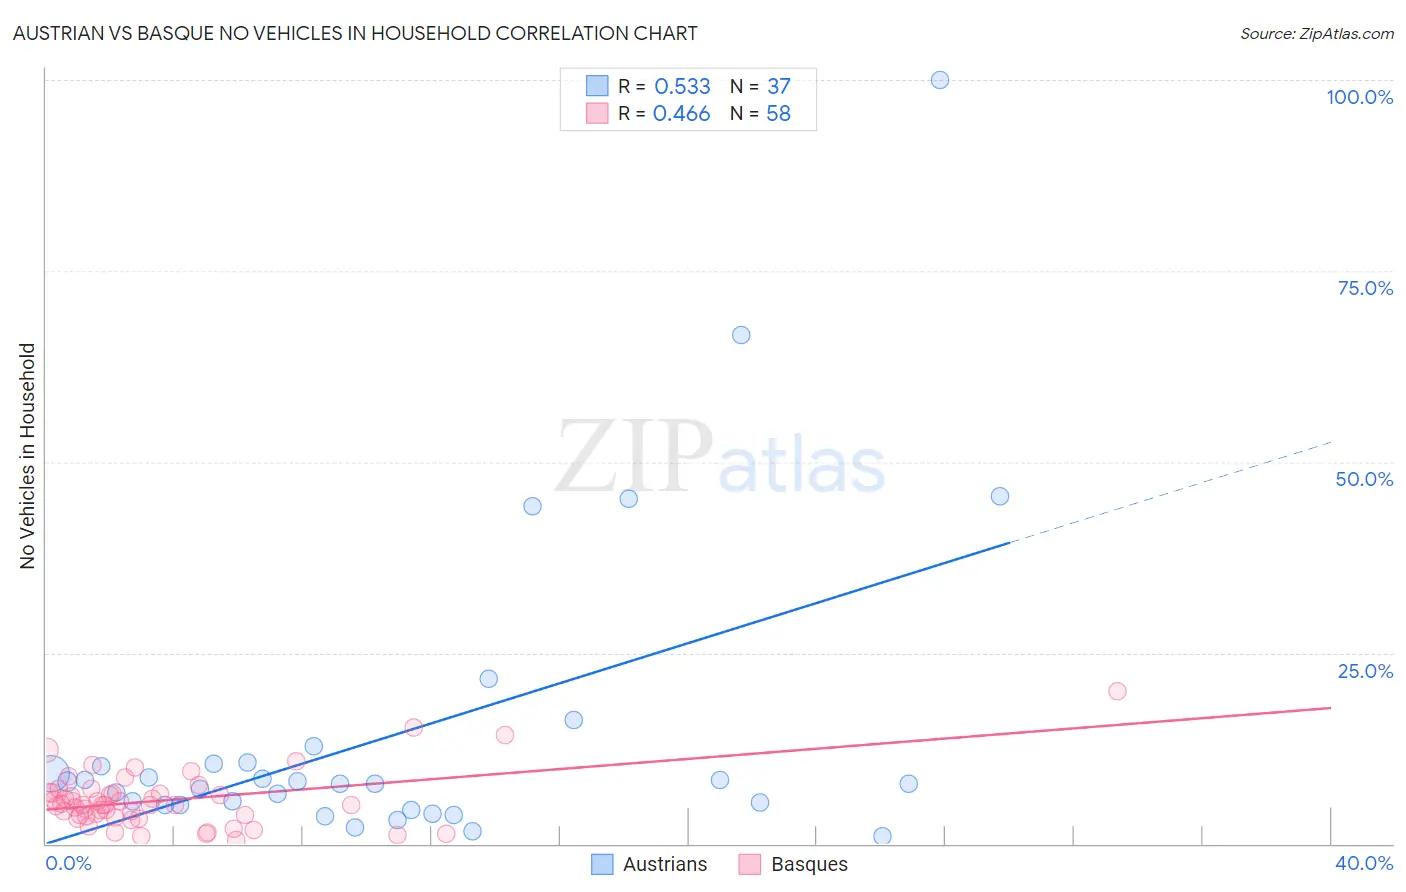
Austrian vs Basque No Vehicles in Household Correlation Chart
The statistical analysis conducted on geographies consisting of 450,345,618 people shows a substantial positive correlation between the proportion of Austrians and percentage of households with no vehicle available in the United States with a correlation coefficient (R) of 0.533 and weighted average of 8.8%. Similarly, the statistical analysis conducted on geographies consisting of 165,489,078 people shows a moderate positive correlation between the proportion of Basques and percentage of households with no vehicle available in the United States with a correlation coefficient (R) of 0.466 and weighted average of 7.8%, a difference of 13.7%.
No Vehicles in Household Correlation Summary
| Measurement | Austrian | Basque |
| Minimum | 0.94% | 0.51% |
| Maximum | 100.0% | 20.0% |
| Range | 99.1% | 19.5% |
| Mean | 14.5% | 5.7% |
| Median | 7.9% | 5.1% |
| Interquartile 25% (IQ1) | 5.1% | 3.6% |
| Interquartile 75% (IQ3) | 10.5% | 6.7% |
| Interquartile Range (IQR) | 5.4% | 3.1% |
| Standard Deviation (Sample) | 20.4% | 3.7% |
| Standard Deviation (Population) | 20.1% | 3.6% |
Similar Demographics by No Vehicles in Household
Demographics Similar to Austrians by No Vehicles in Household
In terms of no vehicles in household, the demographic groups most similar to Austrians are Potawatomi (8.8%, a difference of 0.14%), Immigrants from Bolivia (8.9%, a difference of 0.43%), Immigrants from North America (8.7%, a difference of 0.95%), Immigrants from Central America (8.9%, a difference of 1.1%), and Immigrants from Canada (8.7%, a difference of 1.1%).
| Demographics | Rating | Rank | No Vehicles in Household |
| Immigrants | England | 99.2 /100 | #87 | Exceptional 8.7% |
| Osage | 99.2 /100 | #88 | Exceptional 8.7% |
| Immigrants | Cuba | 99.2 /100 | #89 | Exceptional 8.7% |
| Bhutanese | 99.2 /100 | #90 | Exceptional 8.7% |
| Immigrants | Germany | 99.1 /100 | #91 | Exceptional 8.7% |
| Immigrants | Canada | 99.1 /100 | #92 | Exceptional 8.7% |
| Immigrants | North America | 99.1 /100 | #93 | Exceptional 8.7% |
| Austrians | 98.9 /100 | #94 | Exceptional 8.8% |
| Potawatomi | 98.8 /100 | #95 | Exceptional 8.8% |
| Immigrants | Bolivia | 98.7 /100 | #96 | Exceptional 8.9% |
| Immigrants | Central America | 98.5 /100 | #97 | Exceptional 8.9% |
| Slavs | 98.4 /100 | #98 | Exceptional 9.0% |
| Bulgarians | 98.4 /100 | #99 | Exceptional 9.0% |
| Asians | 98.3 /100 | #100 | Exceptional 9.0% |
| Pakistanis | 98.3 /100 | #101 | Exceptional 9.0% |
Demographics Similar to Basques by No Vehicles in Household
In terms of no vehicles in household, the demographic groups most similar to Basques are Creek (7.8%, a difference of 0.14%), Iraqi (7.7%, a difference of 0.25%), Cherokee (7.7%, a difference of 0.39%), Immigrants from Vietnam (7.7%, a difference of 0.53%), and Immigrants from Taiwan (7.7%, a difference of 0.66%).
| Demographics | Rating | Rank | No Vehicles in Household |
| Finns | 100.0 /100 | #30 | Exceptional 7.7% |
| Native Hawaiians | 100.0 /100 | #31 | Exceptional 7.7% |
| Malaysians | 100.0 /100 | #32 | Exceptional 7.7% |
| Immigrants | Taiwan | 100.0 /100 | #33 | Exceptional 7.7% |
| Immigrants | Vietnam | 100.0 /100 | #34 | Exceptional 7.7% |
| Cherokee | 99.9 /100 | #35 | Exceptional 7.7% |
| Iraqis | 99.9 /100 | #36 | Exceptional 7.7% |
| Basques | 99.9 /100 | #37 | Exceptional 7.8% |
| Creek | 99.9 /100 | #38 | Exceptional 7.8% |
| Immigrants | Fiji | 99.9 /100 | #39 | Exceptional 7.8% |
| Czechoslovakians | 99.9 /100 | #40 | Exceptional 7.8% |
| French Canadians | 99.9 /100 | #41 | Exceptional 7.8% |
| Swiss | 99.9 /100 | #42 | Exceptional 7.9% |
| Chickasaw | 99.9 /100 | #43 | Exceptional 7.9% |
| Choctaw | 99.9 /100 | #44 | Exceptional 7.9% |