Tlingit-Haida vs Pueblo No Vehicles in Household
COMPARE
Tlingit-Haida
Pueblo
No Vehicles in Household
No Vehicles in Household Comparison
Tlingit-Haida
Pueblo
10.1%
NO VEHICLES IN HOUSEHOLD
72.5/ 100
METRIC RATING
153rd/ 347
METRIC RANK
10.8%
NO VEHICLES IN HOUSEHOLD
27.0/ 100
METRIC RATING
194th/ 347
METRIC RANK
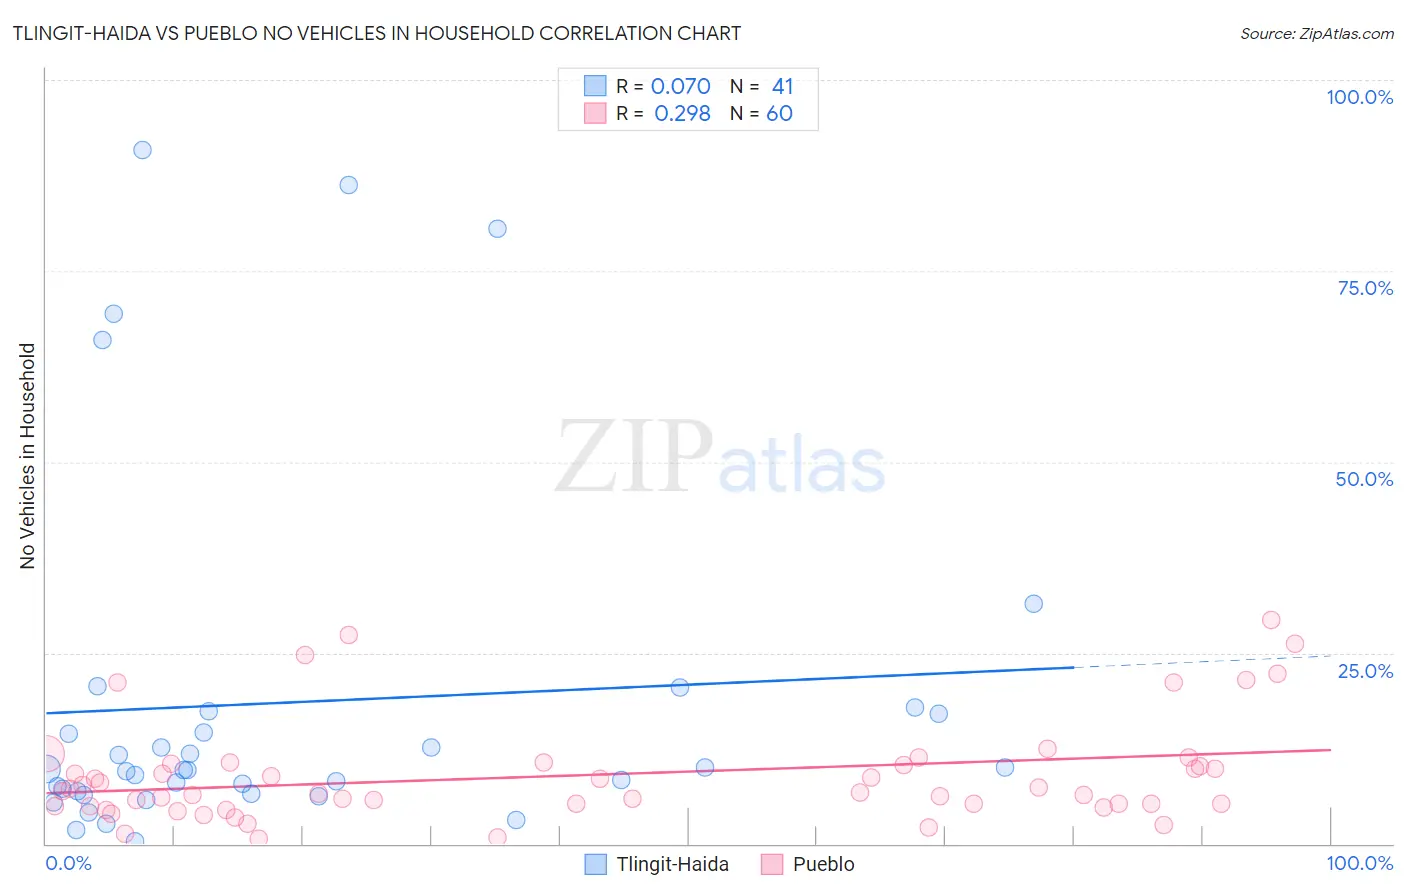
Tlingit-Haida vs Pueblo No Vehicles in Household Correlation Chart
The statistical analysis conducted on geographies consisting of 60,779,226 people shows a slight positive correlation between the proportion of Tlingit-Haida and percentage of households with no vehicle available in the United States with a correlation coefficient (R) of 0.070 and weighted average of 10.1%. Similarly, the statistical analysis conducted on geographies consisting of 120,011,033 people shows a weak positive correlation between the proportion of Pueblo and percentage of households with no vehicle available in the United States with a correlation coefficient (R) of 0.298 and weighted average of 10.8%, a difference of 6.9%.
No Vehicles in Household Correlation Summary
| Measurement | Tlingit-Haida | Pueblo |
| Minimum | 0.39% | 0.72% |
| Maximum | 90.9% | 29.3% |
| Range | 90.5% | 28.6% |
| Mean | 18.5% | 9.0% |
| Median | 9.7% | 6.7% |
| Interquartile 25% (IQ1) | 6.7% | 5.1% |
| Interquartile 75% (IQ3) | 17.2% | 10.4% |
| Interquartile Range (IQR) | 10.4% | 5.3% |
| Standard Deviation (Sample) | 23.6% | 6.7% |
| Standard Deviation (Population) | 23.4% | 6.7% |
Similar Demographics by No Vehicles in Household
Demographics Similar to Tlingit-Haida by No Vehicles in Household
In terms of no vehicles in household, the demographic groups most similar to Tlingit-Haida are Sioux (10.1%, a difference of 0.020%), Salvadoran (10.1%, a difference of 0.030%), Immigrants from Congo (10.1%, a difference of 0.090%), Immigrants from Eastern Africa (10.0%, a difference of 0.23%), and Colombian (10.0%, a difference of 0.24%).
| Demographics | Rating | Rank | No Vehicles in Household |
| Hungarians | 80.0 /100 | #146 | Excellent 9.9% |
| Immigrants | Nicaragua | 79.8 /100 | #147 | Good 9.9% |
| Immigrants | Bosnia and Herzegovina | 79.1 /100 | #148 | Good 9.9% |
| Immigrants | Uganda | 76.1 /100 | #149 | Good 10.0% |
| Colombians | 73.9 /100 | #150 | Good 10.0% |
| Immigrants | Eastern Africa | 73.8 /100 | #151 | Good 10.0% |
| Immigrants | Congo | 73.0 /100 | #152 | Good 10.1% |
| Tlingit-Haida | 72.5 /100 | #153 | Good 10.1% |
| Sioux | 72.4 /100 | #154 | Good 10.1% |
| Salvadorans | 72.4 /100 | #155 | Good 10.1% |
| Immigrants | Micronesia | 70.9 /100 | #156 | Good 10.1% |
| Australians | 70.6 /100 | #157 | Good 10.1% |
| Spanish American Indians | 70.2 /100 | #158 | Good 10.1% |
| Immigrants | Indonesia | 69.3 /100 | #159 | Good 10.1% |
| Immigrants | Middle Africa | 65.7 /100 | #160 | Good 10.2% |
Demographics Similar to Pueblo by No Vehicles in Household
In terms of no vehicles in household, the demographic groups most similar to Pueblo are Immigrants from Brazil (10.8%, a difference of 0.11%), Ukrainian (10.7%, a difference of 0.17%), Central American (10.8%, a difference of 0.45%), Shoshone (10.8%, a difference of 0.50%), and Immigrants from Sweden (10.8%, a difference of 0.71%).
| Demographics | Rating | Rank | No Vehicles in Household |
| Immigrants | Poland | 38.4 /100 | #187 | Fair 10.6% |
| Immigrants | Armenia | 37.5 /100 | #188 | Fair 10.6% |
| Immigrants | Eritrea | 36.3 /100 | #189 | Fair 10.6% |
| Immigrants | North Macedonia | 34.6 /100 | #190 | Fair 10.6% |
| Immigrants | Northern Europe | 33.1 /100 | #191 | Fair 10.7% |
| Carpatho Rusyns | 32.1 /100 | #192 | Fair 10.7% |
| Ukrainians | 28.0 /100 | #193 | Fair 10.7% |
| Pueblo | 27.0 /100 | #194 | Fair 10.8% |
| Immigrants | Brazil | 26.3 /100 | #195 | Fair 10.8% |
| Central Americans | 24.3 /100 | #196 | Fair 10.8% |
| Shoshone | 24.1 /100 | #197 | Fair 10.8% |
| Immigrants | Sweden | 22.9 /100 | #198 | Fair 10.8% |
| Immigrants | Asia | 21.3 /100 | #199 | Fair 10.9% |
| Cambodians | 19.6 /100 | #200 | Poor 10.9% |
| Immigrants | Western Europe | 19.1 /100 | #201 | Poor 10.9% |