Tlingit-Haida vs Senegalese No Vehicles in Household
COMPARE
Tlingit-Haida
Senegalese
No Vehicles in Household
No Vehicles in Household Comparison
Tlingit-Haida
Senegalese
10.1%
NO VEHICLES IN HOUSEHOLD
72.5/ 100
METRIC RATING
153rd/ 347
METRIC RANK
19.8%
NO VEHICLES IN HOUSEHOLD
0.0/ 100
METRIC RATING
325th/ 347
METRIC RANK
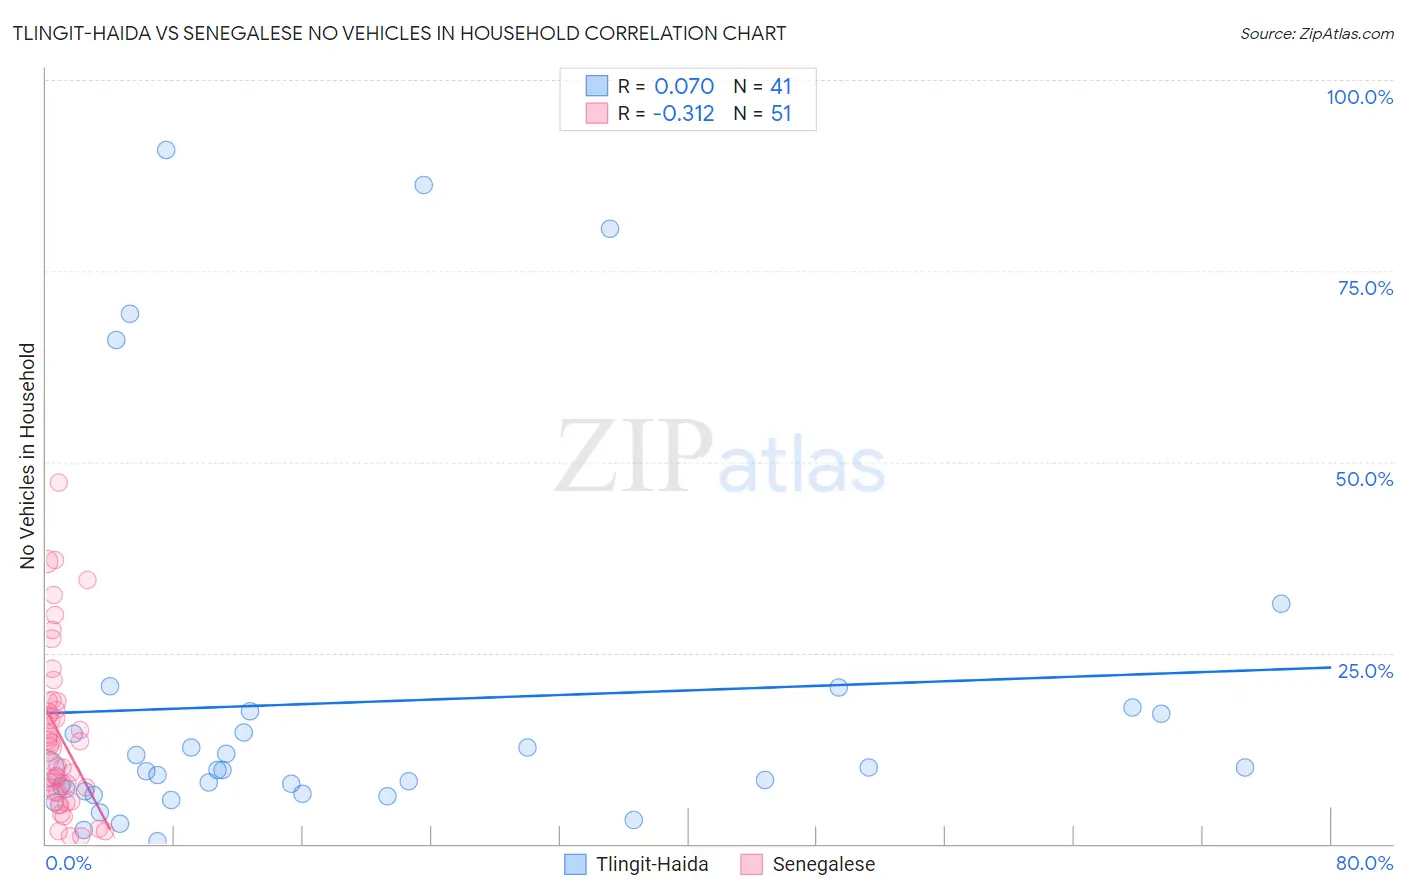
Tlingit-Haida vs Senegalese No Vehicles in Household Correlation Chart
The statistical analysis conducted on geographies consisting of 60,779,226 people shows a slight positive correlation between the proportion of Tlingit-Haida and percentage of households with no vehicle available in the United States with a correlation coefficient (R) of 0.070 and weighted average of 10.1%. Similarly, the statistical analysis conducted on geographies consisting of 78,058,872 people shows a mild negative correlation between the proportion of Senegalese and percentage of households with no vehicle available in the United States with a correlation coefficient (R) of -0.312 and weighted average of 19.8%, a difference of 96.3%.
No Vehicles in Household Correlation Summary
| Measurement | Tlingit-Haida | Senegalese |
| Minimum | 0.39% | 0.99% |
| Maximum | 90.9% | 47.3% |
| Range | 90.5% | 46.3% |
| Mean | 18.5% | 14.1% |
| Median | 9.7% | 12.8% |
| Interquartile 25% (IQ1) | 6.7% | 6.7% |
| Interquartile 75% (IQ3) | 17.2% | 18.7% |
| Interquartile Range (IQR) | 10.4% | 11.9% |
| Standard Deviation (Sample) | 23.6% | 10.5% |
| Standard Deviation (Population) | 23.4% | 10.4% |
Similar Demographics by No Vehicles in Household
Demographics Similar to Tlingit-Haida by No Vehicles in Household
In terms of no vehicles in household, the demographic groups most similar to Tlingit-Haida are Sioux (10.1%, a difference of 0.020%), Salvadoran (10.1%, a difference of 0.030%), Immigrants from Congo (10.1%, a difference of 0.090%), Immigrants from Eastern Africa (10.0%, a difference of 0.23%), and Colombian (10.0%, a difference of 0.24%).
| Demographics | Rating | Rank | No Vehicles in Household |
| Hungarians | 80.0 /100 | #146 | Excellent 9.9% |
| Immigrants | Nicaragua | 79.8 /100 | #147 | Good 9.9% |
| Immigrants | Bosnia and Herzegovina | 79.1 /100 | #148 | Good 9.9% |
| Immigrants | Uganda | 76.1 /100 | #149 | Good 10.0% |
| Colombians | 73.9 /100 | #150 | Good 10.0% |
| Immigrants | Eastern Africa | 73.8 /100 | #151 | Good 10.0% |
| Immigrants | Congo | 73.0 /100 | #152 | Good 10.1% |
| Tlingit-Haida | 72.5 /100 | #153 | Good 10.1% |
| Sioux | 72.4 /100 | #154 | Good 10.1% |
| Salvadorans | 72.4 /100 | #155 | Good 10.1% |
| Immigrants | Micronesia | 70.9 /100 | #156 | Good 10.1% |
| Australians | 70.6 /100 | #157 | Good 10.1% |
| Spanish American Indians | 70.2 /100 | #158 | Good 10.1% |
| Immigrants | Indonesia | 69.3 /100 | #159 | Good 10.1% |
| Immigrants | Middle Africa | 65.7 /100 | #160 | Good 10.2% |
Demographics Similar to Senegalese by No Vehicles in Household
In terms of no vehicles in household, the demographic groups most similar to Senegalese are Immigrants from Caribbean (19.6%, a difference of 0.72%), Immigrants from Yemen (19.5%, a difference of 1.5%), Immigrants from West Indies (20.5%, a difference of 3.9%), Immigrants from Senegal (21.1%, a difference of 7.0%), and Immigrants from Cabo Verde (18.4%, a difference of 7.1%).
| Demographics | Rating | Rank | No Vehicles in Household |
| Immigrants | Belarus | 0.0 /100 | #318 | Tragic 16.7% |
| Alaska Natives | 0.0 /100 | #319 | Tragic 17.4% |
| Soviet Union | 0.0 /100 | #320 | Tragic 17.4% |
| Jamaicans | 0.0 /100 | #321 | Tragic 17.9% |
| Immigrants | Cabo Verde | 0.0 /100 | #322 | Tragic 18.4% |
| Immigrants | Yemen | 0.0 /100 | #323 | Tragic 19.5% |
| Immigrants | Caribbean | 0.0 /100 | #324 | Tragic 19.6% |
| Senegalese | 0.0 /100 | #325 | Tragic 19.8% |
| Immigrants | West Indies | 0.0 /100 | #326 | Tragic 20.5% |
| Immigrants | Senegal | 0.0 /100 | #327 | Tragic 21.1% |
| Immigrants | Dominica | 0.0 /100 | #328 | Tragic 22.2% |
| Ecuadorians | 0.0 /100 | #329 | Tragic 22.8% |
| West Indians | 0.0 /100 | #330 | Tragic 23.7% |
| Trinidadians and Tobagonians | 0.0 /100 | #331 | Tragic 23.7% |
| Immigrants | Ecuador | 0.0 /100 | #332 | Tragic 23.8% |