Malaysian vs Basque No Vehicles in Household
COMPARE
Malaysian
Basque
No Vehicles in Household
No Vehicles in Household Comparison
Malaysians
Basques
7.7%
NO VEHICLES IN HOUSEHOLD
100.0/ 100
METRIC RATING
32nd/ 347
METRIC RANK
7.8%
NO VEHICLES IN HOUSEHOLD
99.9/ 100
METRIC RATING
37th/ 347
METRIC RANK
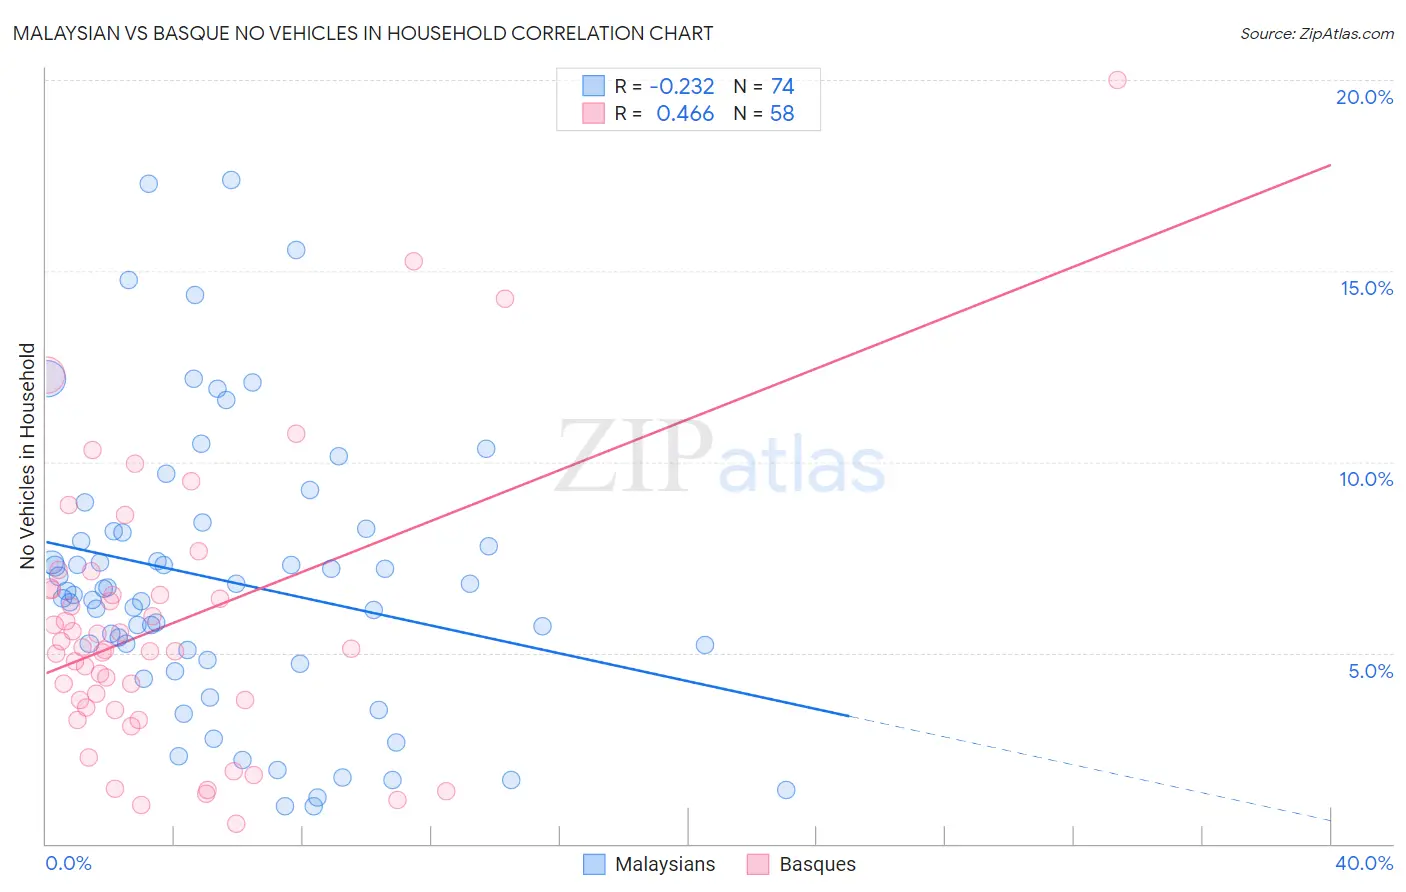
Malaysian vs Basque No Vehicles in Household Correlation Chart
The statistical analysis conducted on geographies consisting of 225,868,450 people shows a weak negative correlation between the proportion of Malaysians and percentage of households with no vehicle available in the United States with a correlation coefficient (R) of -0.232 and weighted average of 7.7%. Similarly, the statistical analysis conducted on geographies consisting of 165,489,078 people shows a moderate positive correlation between the proportion of Basques and percentage of households with no vehicle available in the United States with a correlation coefficient (R) of 0.466 and weighted average of 7.8%, a difference of 0.77%.
No Vehicles in Household Correlation Summary
| Measurement | Malaysian | Basque |
| Minimum | 0.99% | 0.51% |
| Maximum | 17.4% | 20.0% |
| Range | 16.4% | 19.5% |
| Mean | 6.9% | 5.7% |
| Median | 6.6% | 5.1% |
| Interquartile 25% (IQ1) | 4.8% | 3.6% |
| Interquartile 75% (IQ3) | 8.2% | 6.7% |
| Interquartile Range (IQR) | 3.4% | 3.1% |
| Standard Deviation (Sample) | 3.7% | 3.7% |
| Standard Deviation (Population) | 3.7% | 3.6% |
Demographics Similar to Malaysians and Basques by No Vehicles in Household
In terms of no vehicles in household, the demographic groups most similar to Malaysians are Immigrants from Taiwan (7.7%, a difference of 0.11%), Immigrants from Vietnam (7.7%, a difference of 0.24%), Native Hawaiian (7.7%, a difference of 0.25%), Cherokee (7.7%, a difference of 0.38%), and Finnish (7.7%, a difference of 0.40%). Similarly, the demographic groups most similar to Basques are Creek (7.8%, a difference of 0.14%), Iraqi (7.7%, a difference of 0.25%), Cherokee (7.7%, a difference of 0.39%), Immigrants from Vietnam (7.7%, a difference of 0.53%), and Immigrants from Taiwan (7.7%, a difference of 0.66%).
| Demographics | Rating | Rank | No Vehicles in Household |
| Immigrants | Iraq | 100.0 /100 | #24 | Exceptional 7.5% |
| Yaqui | 100.0 /100 | #25 | Exceptional 7.5% |
| Sri Lankans | 100.0 /100 | #26 | Exceptional 7.6% |
| British | 100.0 /100 | #27 | Exceptional 7.6% |
| Samoans | 100.0 /100 | #28 | Exceptional 7.6% |
| Americans | 100.0 /100 | #29 | Exceptional 7.7% |
| Finns | 100.0 /100 | #30 | Exceptional 7.7% |
| Native Hawaiians | 100.0 /100 | #31 | Exceptional 7.7% |
| Malaysians | 100.0 /100 | #32 | Exceptional 7.7% |
| Immigrants | Taiwan | 100.0 /100 | #33 | Exceptional 7.7% |
| Immigrants | Vietnam | 100.0 /100 | #34 | Exceptional 7.7% |
| Cherokee | 99.9 /100 | #35 | Exceptional 7.7% |
| Iraqis | 99.9 /100 | #36 | Exceptional 7.7% |
| Basques | 99.9 /100 | #37 | Exceptional 7.8% |
| Creek | 99.9 /100 | #38 | Exceptional 7.8% |
| Immigrants | Fiji | 99.9 /100 | #39 | Exceptional 7.8% |
| Czechoslovakians | 99.9 /100 | #40 | Exceptional 7.8% |
| French Canadians | 99.9 /100 | #41 | Exceptional 7.8% |
| Swiss | 99.9 /100 | #42 | Exceptional 7.9% |
| Chickasaw | 99.9 /100 | #43 | Exceptional 7.9% |
| Choctaw | 99.9 /100 | #44 | Exceptional 7.9% |